You shipped the onboarding overhaul. Activation moved. Support tickets changed. Nobody agrees why.
Product says one thing. Customer Success reads the numbers differently. Finance has a third version of the same metric. The data exists somewhere in your stack, but "somewhere" is doing a lot of work. According to Avasant's 2026 research, 82% of organizations had adopted business and data analytics by 2024, up from 65% in 2020. Adoption is no longer the problem. The problem is trustworthy signal at the speed your release cadence demands.
Most "best big data analytics" roundups treat dashboards, data warehouses, ETL pipelines, and distributed compute engines as if they're interchangeable. They're not. Choosing the wrong category of tool doesn't just waste a procurement cycle; it creates a maintenance burden your data team will resent for years.
This guide separates the four practical jobs: Data platform and warehousing, distributed processing and machine learning, business intelligence and reporting, and data ingestion. Start with your bottleneck, not the biggest brand name.
What's inside
This guide evaluates 15 platforms across product analytics, business intelligence, machine learning, data engineering, and ingestion for product and data teams in 2026. Items were selected based on four criteria:
- Scale and performance: Can it handle real event volumes and complex joins?
- Product and business reporting fit: Does it give PMs trustworthy activation, retention, and adoption signals?
- Governance and security: Who controls access, lineage, and metric definitions?
- Engineering effort and operating cost: Who builds and maintains it after launch?
Guideflow does not appear in this list. Big data analytics is a separate category from interactive product demos, and forcing a fit would waste your time.
TL;DR
- Best overall data and AI platform: Databricks, for teams that need data engineering, SQL analytics, and machine learning in one governed environment
- Best cloud data warehouse: Snowflake, for organizations standardizing on governed SQL analytics across multiple teams and data domains
- Best for Google Cloud stacks: Google BigQuery, for serverless SQL analytics in a Google-native environment
- Best for Microsoft-centered organizations: Microsoft Fabric and Microsoft Power BI, for teams already on Azure and Microsoft 365
- Best for fast BI adoption: Tableau, Looker, Qlik Sense, or Domo, depending on governance depth, embedded analytics needs, and business user requirements
- Best for data movement: Fivetran handles ingestion; Apache Spark handles distributed processing when engineering owns the workload
What is big data analytics software?
Big data analytics software is technology that collects, stores, processes, analyzes, and visualizes large or complex datasets so teams can make decisions from reliable patterns rather than isolated reports.
The five Vs in plain English
- Volume: More records than a spreadsheet or desktop database can handle reliably
- Velocity: Events and transactions arriving continuously or near real time
- Variety: Structured tables alongside semi-structured and unstructured data
- Veracity: Data quality, lineage, and definition gaps that make teams distrust the same metric
- Value: The business decision the analysis needs to improve
Core software categories
- Data platforms and warehouses: Store governed data for analytics workloads, including data lakehouse architectures that combine warehouse and lake capabilities
- Processing engines: Transform large datasets and run distributed computations at scale
- Business intelligence platforms: Turn governed data into dashboards, reports, and self-service analysis; see our guide to data visualization tools for the full picture
- Machine learning environments: Build predictive analytics models and operationalize data science work
- Integration platforms: Move source data into analytics systems reliably; cloud data security considerations belong here too
Four analytical methods tied to PM outcomes
- Descriptive: What happened to activation last month?
- Diagnostic: Which onboarding segment caused the drop?
- Predictive: Which accounts are likely to churn in the next 30 days?
- Prescriptive: Which action should a lifecycle campaign trigger next?
A dashboard is not a data platform. A warehouse is not an ETL tool. Build your shortlist around the job you need done, not the category with the biggest marketing budget.
When to use big data analytics software
Analyze high-volume product and customer data
Event streams, feature usage, customer health signals, and multi-product telemetry eventually outgrow spreadsheet exports and ad hoc queries. When data refreshes, joins, and segmentation become unreliable, it's time to move beyond manual reporting. PMs who need to answer "which onboarding segment activated fastest last sprint" need a real instrumentation layer, not a pivot table updated on Fridays.
Give teams a trusted view of product performance
Product, Sales, Customer Success, and Finance often use different definitions for "active user," "activation," or "expansion." Governed semantic models and shared dashboards reduce the time your team spends reconciling numbers before a board meeting. If the first 20 minutes of your weekly review is a debate about whose metric is right, you have a governance problem, not a dashboard problem.
Run predictive or real-time decisions
Fraud detection, anomaly detection, usage-based alerts, churn risk scoring, and large-scale experimentation all require more than a BI layer. These use cases need a platform or processing engine that can handle the computation. Shortlist by job: Need ingestion? Start with Fivetran. Need governed SQL storage? Start with Snowflake, BigQuery, or Microsoft Fabric. Need distributed engineering or ML? Start with Databricks or Apache Spark. Need business reporting and dashboard adoption? Start with Power BI, Tableau, Looker, Qlik Sense, or Domo.
Big data analytics software comparison
The table below maps all 15 platforms across their primary job, pricing model, and G2 rating. Use it to narrow your shortlist before reading the full entries. Pricing and G2 ratings verified in October 2026 from vendor pricing pages and G2 listings.
| # | Product | Best for | Key differentiator | Pricing | G2 rating |
|---|---|---|---|---|---|
| 1 | Databricks | Data engineering, SQL analytics, and ML teams | Unified lakehouse for data, AI, and governance | Usage-based; free trial available | 4.6/5 |
| 2 | Snowflake | Governed cloud data warehousing at scale | Elastic compute with secure cross-cloud data sharing | Consumption-based; 30-day trial with $400 credits | 4.6/5 |
| 3 | Google BigQuery | Google Cloud analytics teams | Serverless SQL with native Google Cloud integration | From $6.25/TiB; 1 TiB free per month | 4.5/5 |
| 4 | Microsoft Fabric | Microsoft-centered enterprises | Unified data engineering, warehousing, and Power BI | Capacity-based; free trial available | N/A |
| 5 | Microsoft Power BI | Business reporting in Microsoft environments | Broad Microsoft 365 integration and accessibility | From $14/user/month (billed annually) | 4.5/5 |
| 6 | Tableau | Visual analytics and executive dashboards | Flexible visual exploration and polished dashboards | From $15/user/month (billed annually) | N/A |
| 7 | Looker | Governed metrics and embedded analytics | LookML semantic modeling layer | Custom pricing | 4.4/5 |
| 8 | Qlik Sense | Associative analysis across complex data | Associative engine for exploratory analysis | From $300/month (10 users, billed annually) | 4.4/5 |
| 9 | Domo | Cross-functional operational dashboards | 1,000+ connectors with business-user dashboards | 30-day free trial; consumption-based paid plans | 4.3/5 |
| 10 | SAS Viya | Enterprise predictive analytics and model governance | Advanced statistics and regulated decisioning | Custom pricing | 4.3/5 |
| 11 | IBM Cognos Analytics | Enterprise reporting and formal BI governance | Reporting depth for IBM-aligned environments | From $10.60/user/month | 4.1/5 |
| 12 | Apache Spark | Distributed large-scale data processing | Open-source engine for batch and streaming workloads | Free open-source; managed service costs vary | 4.3/5 |
| 13 | Altair AI Studio | Visual data science and explainable ML | Code-free workflow designer with enterprise deployment | Free for non-commercial use; commercial pricing by quote | 4.6/5 |
| 14 | RapidMiner | Visual machine learning and analytics workflows | Drag-and-drop AutoML and generative AI modeling | Contact vendor for current pricing | 4.6/5 |
| 15 | Fivetran | Managed ELT and reliable source ingestion | 700+ fully managed connectors to warehouses and lakes | Free tier available; paid plans consumption-based | 4.3/5 |
Best 15 big data analytics software tools for 2026
1. Databricks
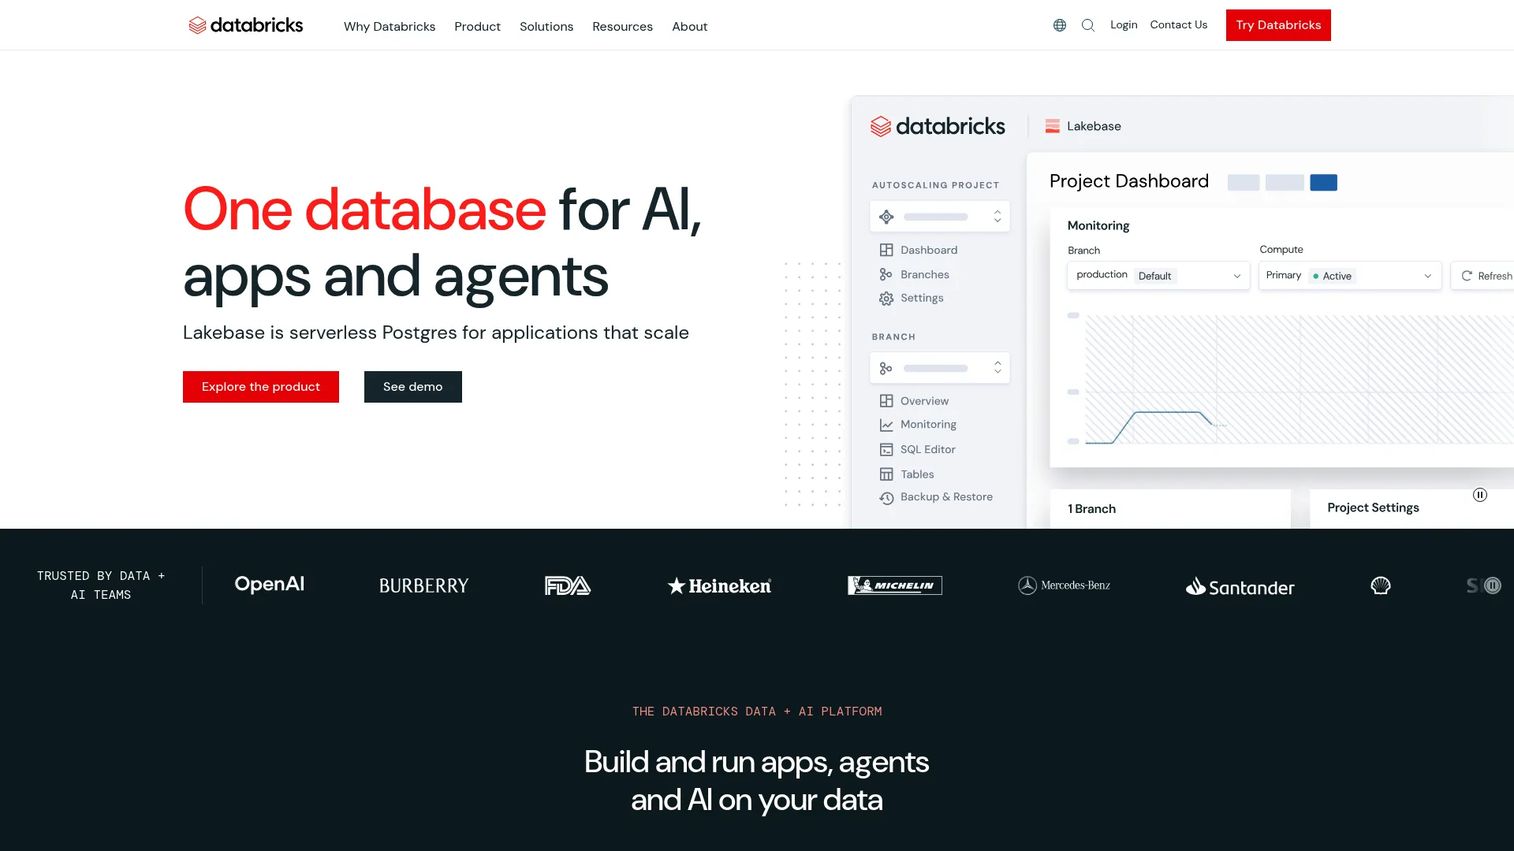
Databricks is a unified Data and AI platform that combines data engineering, SQL analytics, machine learning, and AI application development in a single governed environment. Its lakehouse architecture sits on open table formats and lets data, analytics, and data science teams share the same governed data assets without copying datasets between systems. Product organizations with mature data pipelines and ML use cases tend to converge on Databricks when they need scale and governance together.
Best for: Product organizations with large event volumes, ML use cases, or multiple data teams sharing a governed platform.
Key features
- Unified lakehouse for data engineering, SQL analytics, and AI workloads
- Unity Catalog for permissions, lineage, and auditing across all data assets
- Notebooks for data engineering and data science in Python, SQL, and Scala
- Streaming and batch processing for real-time and historical event data
- Feature Store for governed feature engineering and model serving
Why choose Databricks: Choose Databricks when your PM questions require engineering-grade data pipelines or advanced modeling, not only dashboarding. It rewards teams with data engineering ownership and a roadmap that includes ML.
Databricks pricing: Databricks uses usage-based pricing billed at per-second granularity across cloud providers. A Community Edition provides limited free access, and a free trial is available. Committed use contracts offer discounted rates for teams ready to commit to volume.
G2 rating: 4.6/5 (verified October 2026)
2. Snowflake
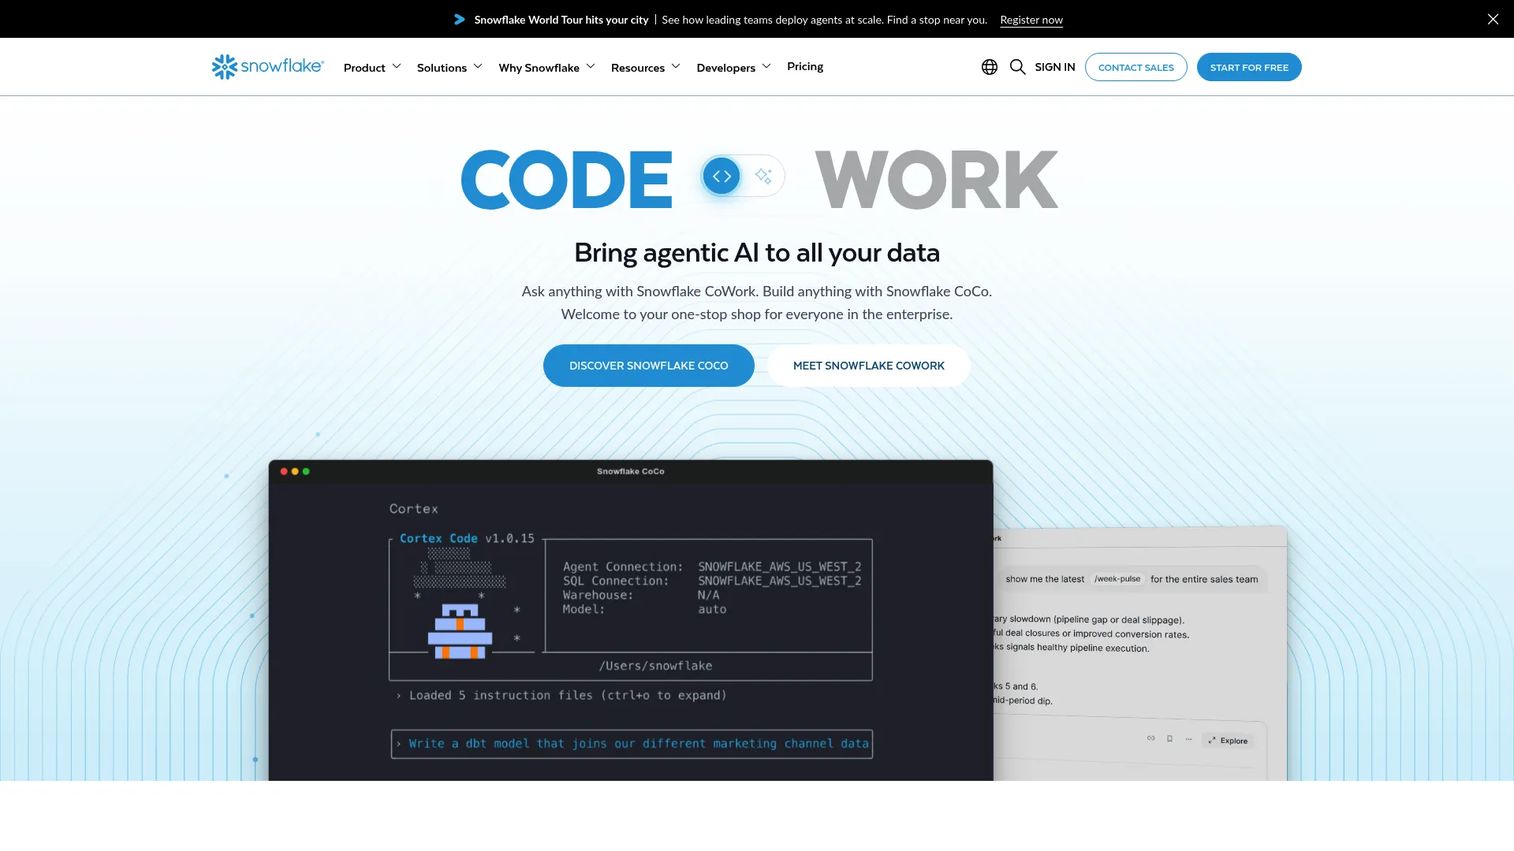
Snowflake is a fully managed, cross-cloud data and AI platform built for governed analytics, data engineering, and secure data sharing. Its separation of storage and compute means teams scale query capacity without touching storage costs, and its secure data sharing capabilities let different business units work from the same governed data without duplication. For PMs who need a stable, shared metric foundation without owning infrastructure, Snowflake is the most common answer. See our guide to customer data platforms for complementary tools that feed data into warehouses like Snowflake.
Best for: Organizations standardizing on a cloud data warehouse for product, customer, revenue, and operational data across multiple teams.
Key features
- Elastic cloud data warehouse with separated storage and compute
- Secure data sharing across teams, clouds, and external partners
- SQL analytics with Snowflake Cortex and ML capabilities
- Built-in governance, access controls, and encryption
- Multi-cloud availability across AWS, Azure, and Google Cloud
Why choose Snowflake: Snowflake works best when cross-team metric consistency matters as much as query performance. It usually needs ELT tooling, a modeling layer, and a BI product alongside it to complete the stack.
Snowflake pricing: Snowflake uses consumption-based pricing for compute, storage, and data transfer, with rates varying by cloud provider, region, and edition (Standard, Enterprise, Business Critical). A 30-day trial with $400 in free credits is available to get started.
G2 rating: 4.6/5 (verified October 2026)
3. Google BigQuery
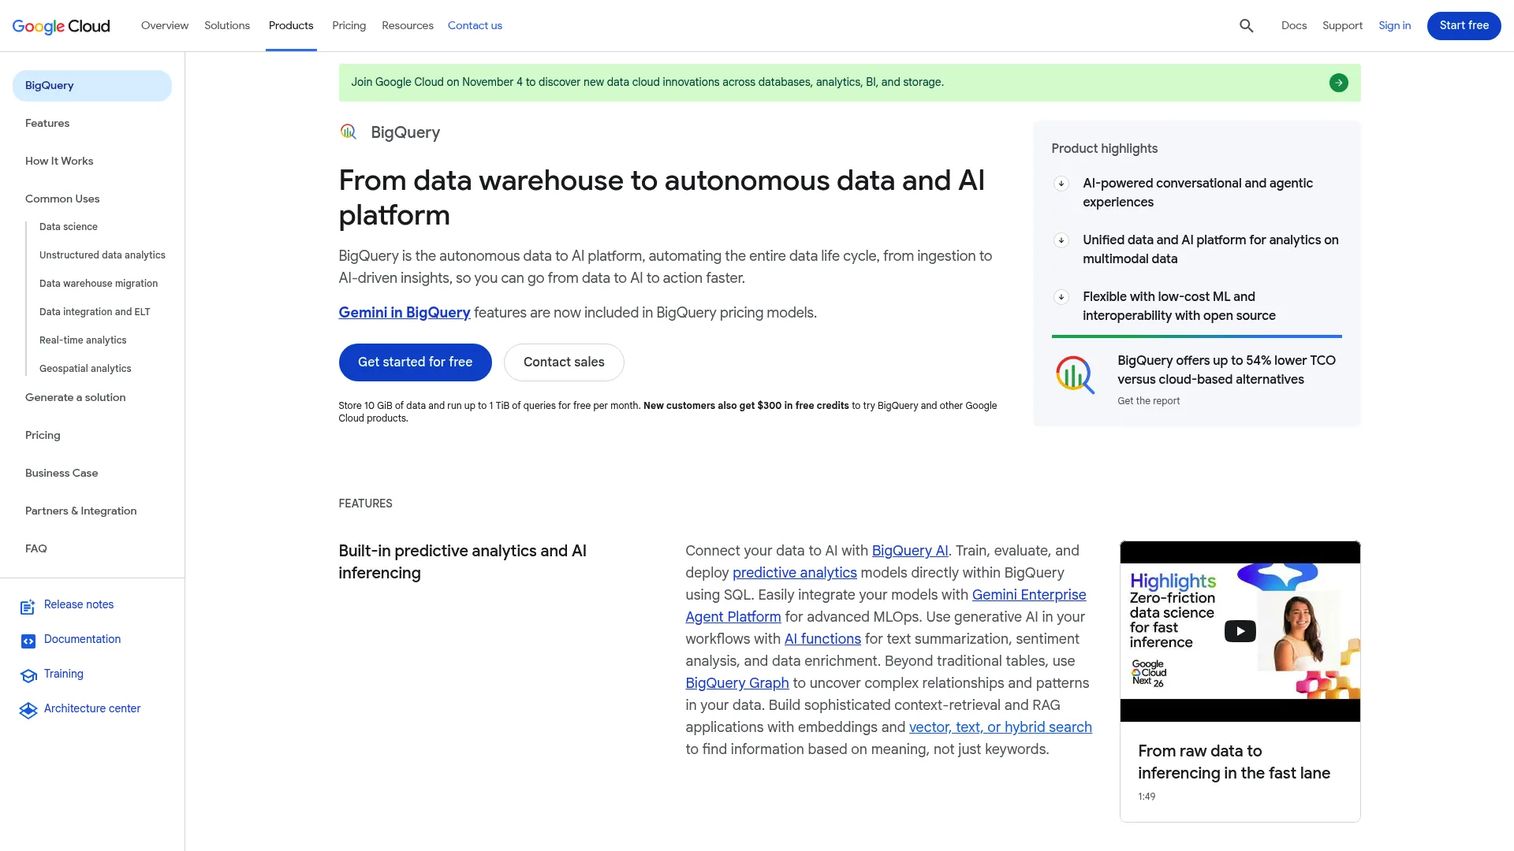
Google BigQuery is Google Cloud's fully managed, serverless data warehouse for SQL-driven analytics at petabyte scale. Teams in Google-native stacks benefit from native integrations across Firebase, Google Analytics, and Google marketing data, alongside BigQuery ML for in-database machine learning without moving data to a separate environment. Cost governance matters: Ad hoc querying across large teams can drive up bills quickly if spend controls are not set from day one.
Best for: Teams already running on Google Cloud who need fast, serverless SQL analytics over high-volume event data.
Key features
- Serverless SQL data warehouse with automatic scaling
- Native integration across Google Cloud services
- BigQuery ML for in-database machine learning
- Streaming ingestion and real-time analytics
- Usage controls, access management, and data lineage
Why choose Google BigQuery: BigQuery removes infrastructure management entirely, which reduces engineering opportunity cost for smaller data teams. Its per-query model rewards disciplined querying but requires cost controls as analyst headcount grows.
Google BigQuery pricing: The first 1 TiB of on-demand query processing and 10 GiB of storage are free each month. On-demand queries start at $6.25 per TiB processed. Capacity pricing and sandbox options are also available for teams with predictable workloads.
G2 rating: 4.5/5 (verified October 2026)
4. Microsoft Fabric
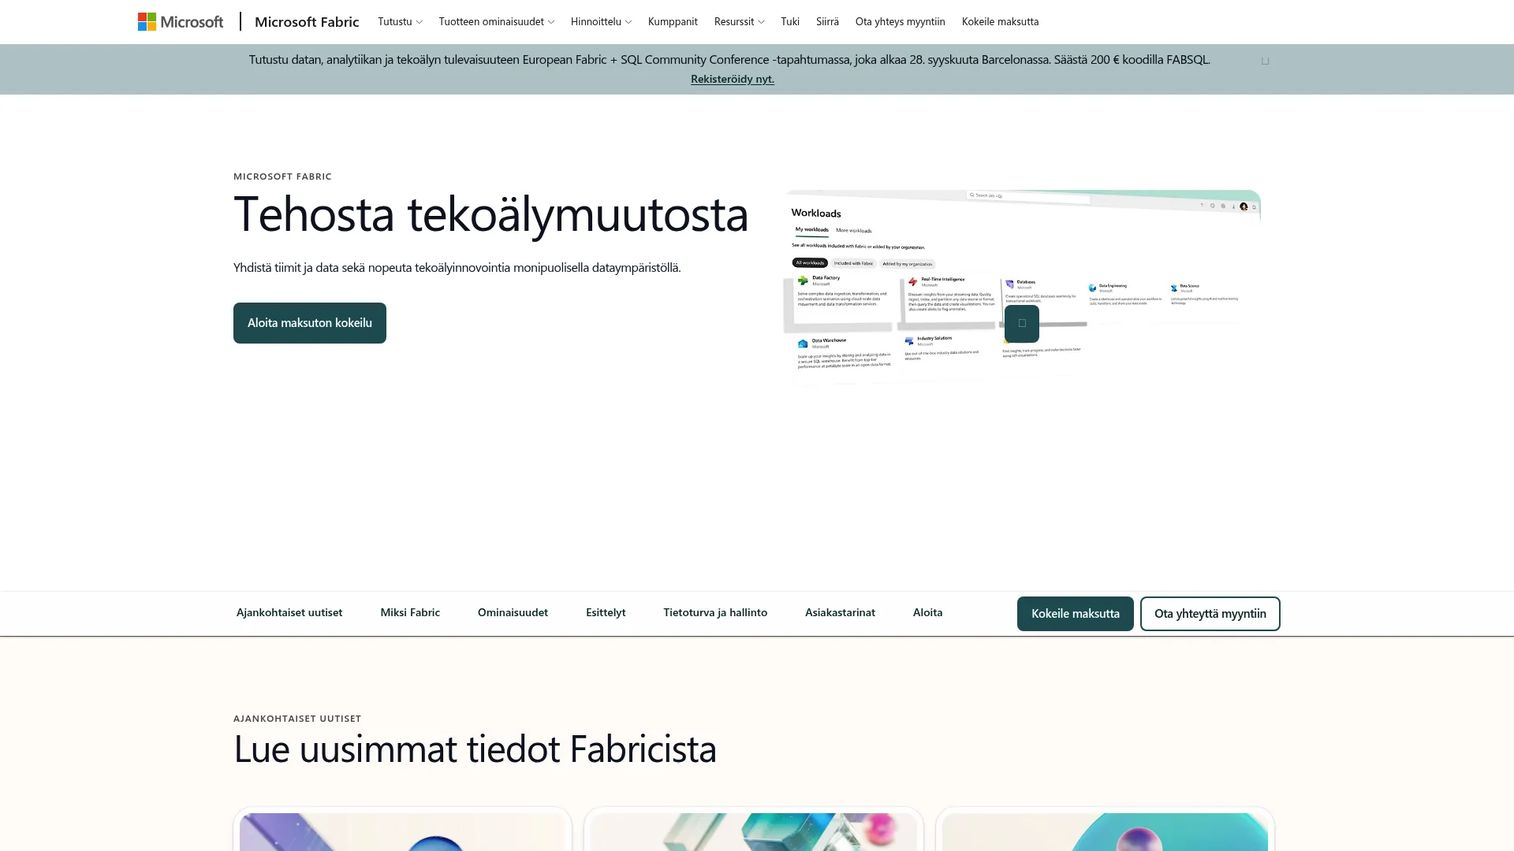
Microsoft Fabric is an end-to-end SaaS analytics platform that brings data integration, engineering, warehousing, real-time intelligence, data science, and Power BI reporting into a single Microsoft-governed environment. OneLake serves as the unified data lake foundation, and Data Factory provides 170+ connectors for ingesting source data. For product organizations whose procurement, identity, and governance standards are already built around Microsoft, Fabric reduces the number of handoffs across the data lifecycle. Its maturity is growing fast, and it fits best when Azure is already strategic.
Best for: Enterprise product teams using Azure, Microsoft 365, and Microsoft governance controls who want a unified data-to-reporting environment.
Key features
- OneLake unified data lake as the foundation for all workloads
- Data Factory with 170+ connectors for ingestion and transformation
- Warehouse and lakehouse workloads in a single environment
- Real-Time Intelligence for streaming data and event processing
- Power BI reporting and AI Copilot capabilities built in
Why choose Microsoft Fabric: Fabric reduces platform sprawl for Microsoft-committed organizations. Teams that already pay for Azure and Power BI often find Fabric capacity pricing more cost-effective than assembling separate tools for each data layer.
Microsoft Fabric pricing: Fabric uses capacity-based pricing with pay-as-you-go or reservation purchasing options across multiple capacity tiers (F2 through F8192). A free trial is available. Numeric pricing for capacity units was not displayed on the official pricing page at verification time; contact Microsoft for current rates.
5. Microsoft Power BI
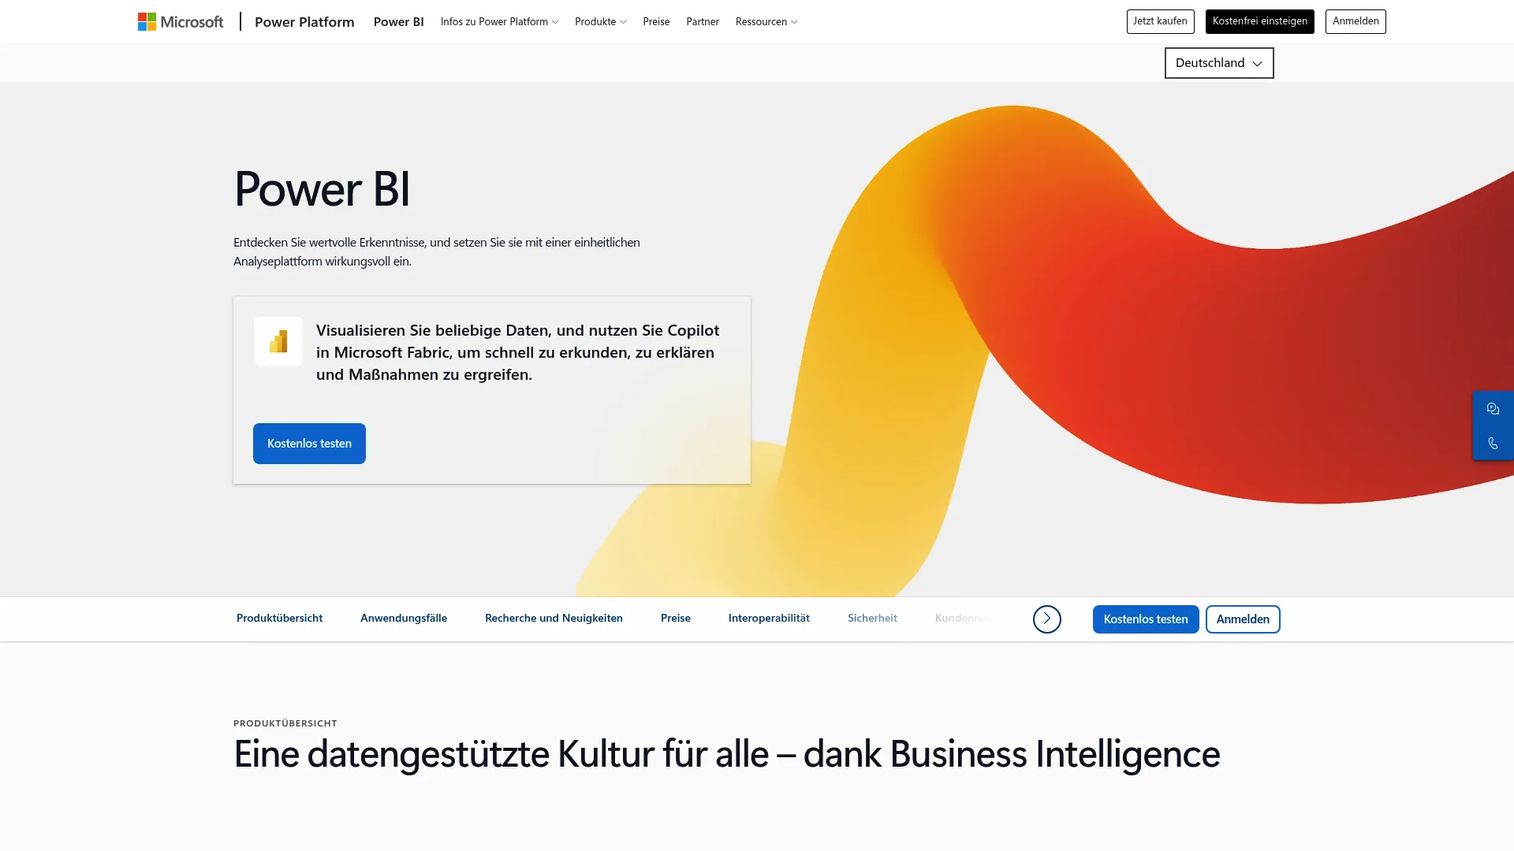
Microsoft Power BI is a broadly adopted business intelligence platform for building interactive dashboards and reports from product, sales, support, and finance data. Power Query handles data preparation, DAX enables semantic calculations, and the Microsoft 365 integration means most business stakeholders can access reports without leaving familiar tools. Metric governance still requires intentional work: Dataset ownership, refresh schedules, and semantic model discipline determine whether PMs get trustworthy activation numbers or conflicting definitions. For a broader look at the BI category, our best business intelligence software guide covers the full landscape.
Best for: Product managers who need accessible dashboards and self-service reporting in a Microsoft-centered organization.
Key features
- Interactive reports and dashboards with Power BI Desktop and cloud
- Power Query for data connection, preparation, and transformation
- Semantic models and DAX calculations for governed metrics
- Microsoft 365 integration for broad stakeholder access
- Embedded analytics options for in-app reporting
Why choose Microsoft Power BI: Power BI's strength is adoption speed across non-technical stakeholders. Its pricing entry point is low, analyst availability is high, and the Microsoft ecosystem fit removes integration friction. The tradeoff: Metric consistency requires active governance discipline, not just a license.
Microsoft Power BI pricing: A free account is available. Power BI Pro starts at $14/user/month (billed annually). Power BI Premium Per User is $24/user/month (billed annually). Power BI Embedded pricing is variable; contact sales for capacity-based options.
G2 rating: 4.5/5 (verified October 2026)
6. Tableau
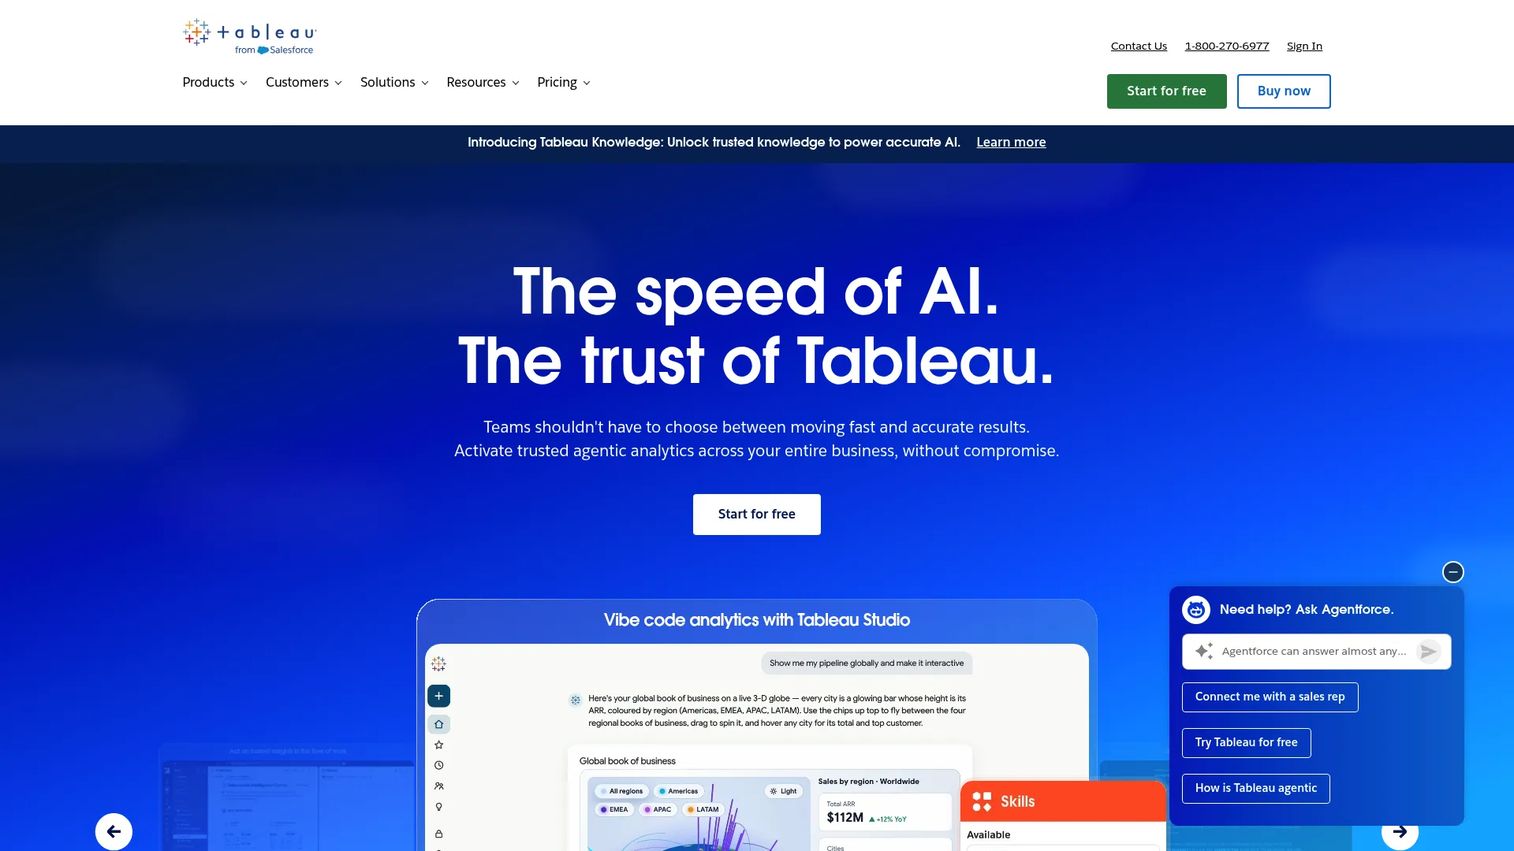
Tableau is a visual analytics platform for teams that need rich exploratory analysis and polished executive dashboards alongside governed data management. Tableau Prep handles data preparation, the drag-and-drop dashboard builder supports complex visual compositions, and broad data source connectivity means analysts can reach most modern data platforms. Deployment planning and governance require deliberate attention at enterprise scale; licensing structure and data governance ownership should be resolved before broad rollout. Our data visualization tools guide includes Tableau alongside tools built for different visualization jobs.
Best for: Teams that need analyst-led exploratory analysis, flexible dashboard design, and polished stakeholder communication.
Key features
- Interactive visual analysis with drag-and-drop dashboard builder
- Tableau Prep for data preparation and shaping
- Broad connectivity to databases, warehouses, and flat files
- AI-assisted and conversational analytics features
- Embedded analytics and governance controls
Why choose Tableau: Tableau rewards teams with dedicated analysts who need visual flexibility. Its strength in data storytelling and stakeholder communication is real, but it works best when paired with a governed data layer rather than sitting on top of raw exports.
Tableau pricing: Standard Viewer starts at $15/user/month (billed annually). Standard Explorer is $42/user/month and Standard Creator is $75/user/month. Enterprise plans start at $35/user/month for Viewer, with Creator at $115/user/month. Tableau Public and a free Desktop edition are available at no cost. Tableau+ (a Cloud-only bundle) requires contacting sales.
7. Looker
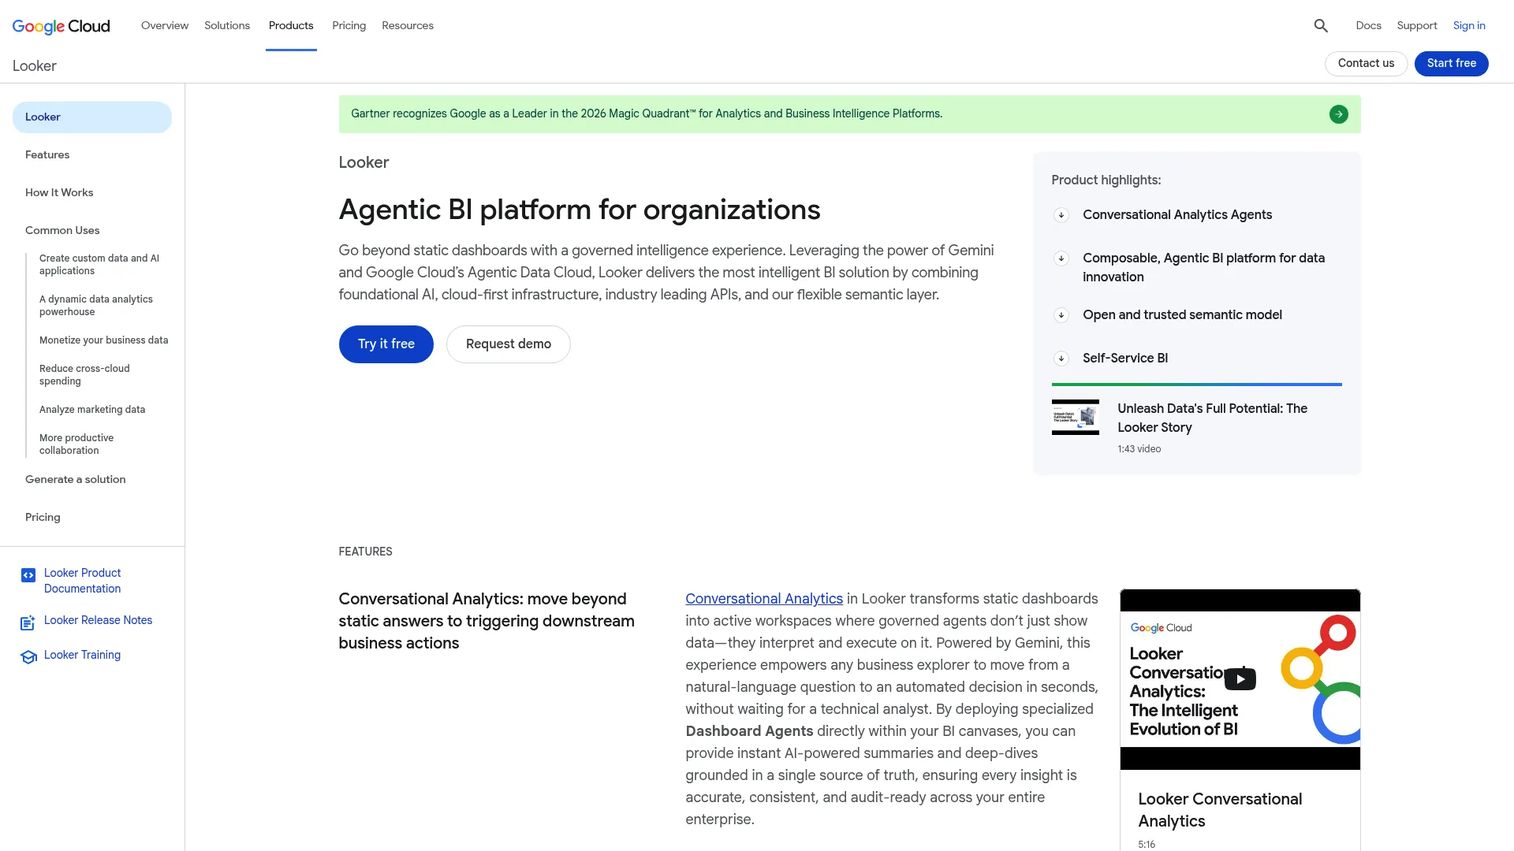
Looker is a business intelligence platform built around LookML, a semantic modeling language that defines governed, reusable metric definitions before any dashboard is built. For PMs tired of metric drift across dashboards, Looker's approach is structurally different: You define "activation" or "retention" once in LookML, and every dashboard that references that metric reflects the same definition. It rewards teams willing to invest in analytics engineering upfront. Conversational Analytics and AI-assisted exploration extend self-service to non-technical stakeholders once the model is in place.
Best for: Data-conscious organizations that need reusable metric definitions, governed self-service, and embedded analytics on top of a modern warehouse.
Key features
- LookML semantic modeling for centralized, governed metric definitions
- Self-service Explore interface for ad hoc data analysis
- Embedded analytics and APIs for custom data applications
- Conversational Analytics and AI-assisted exploration
- Google Cloud integration and native warehouse connectivity
Why choose Looker: Looker is the right choice when metric consistency is more important than dashboard speed. It requires analytics engineering investment, but that investment pays back every time someone asks "why does your number differ from mine?" and the answer is "it doesn't."
Looker pricing: All platform editions (Standard, Enterprise, Embed) require contacting sales for pricing. Annual commitment contracts apply. Each edition includes 10 standard users and 2 developer users; additional user licensing varies by type.
G2 rating: 4.4/5 (verified October 2026)
8. Qlik Sense
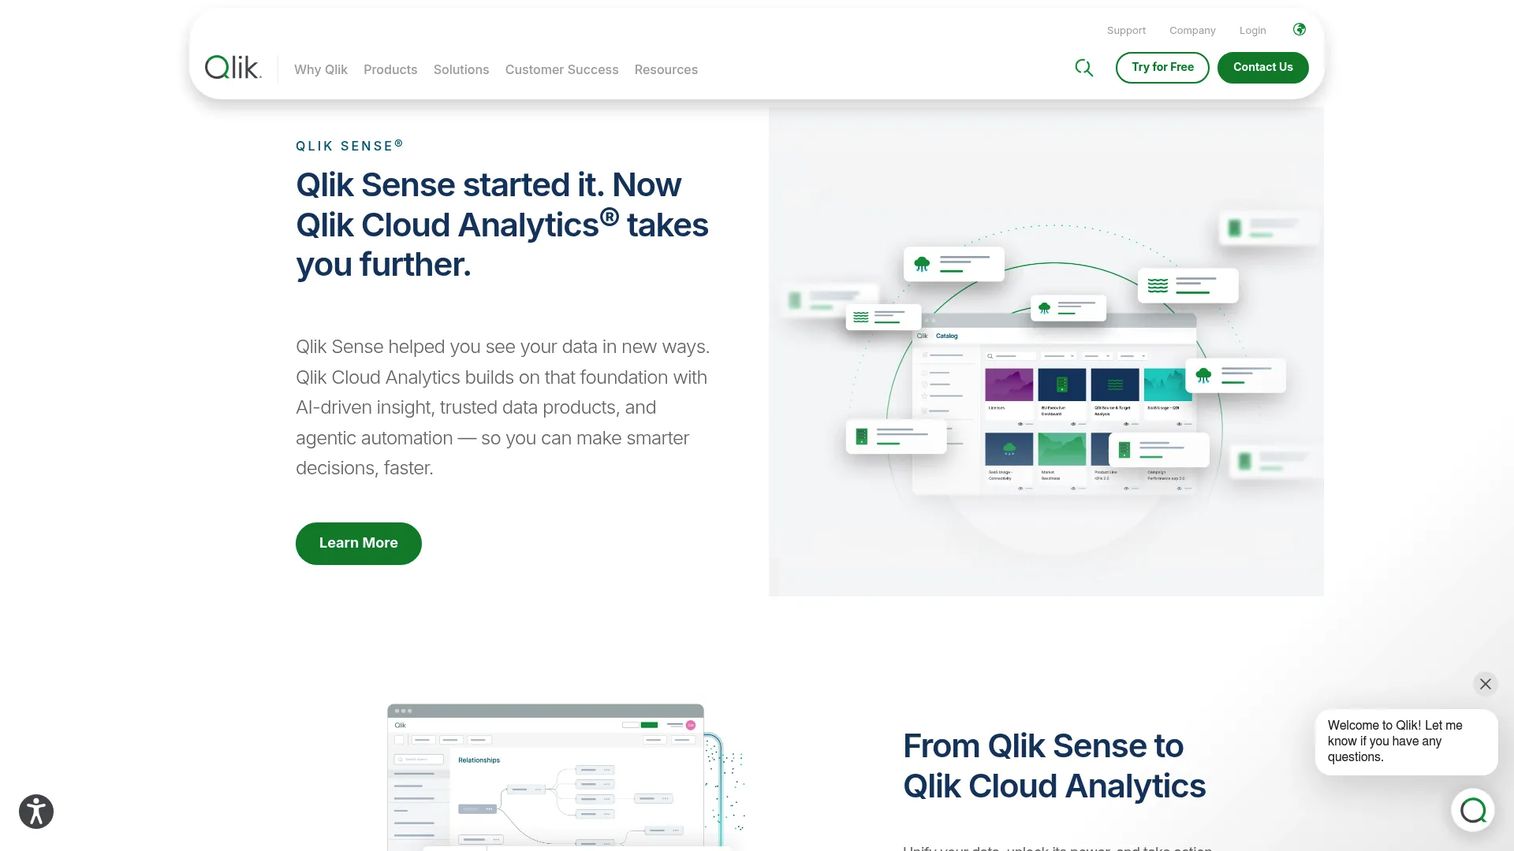
Qlik Sense uses an associative analytics engine that lets users explore relationships across datasets without being constrained to prebuilt dashboard paths. Most BI tools filter data linearly; Qlik's engine keeps all data relationships in memory, so clicking a dimension shows you what is selected, what is associated, and what is excluded simultaneously. For complex product and operational datasets where stakeholders ask unplanned questions, this exploration model reduces the need for analysts to rebuild queries for every new angle. Governance, licensing tiers, and skill requirements should be validated before broad deployment.
Best for: Organizations that need flexible exploratory analysis across complex, varied business data where prebuilt dashboard paths aren't enough.
Key features
- Associative analytics engine for multi-directional data exploration
- AI-powered insight generation and natural-language search
- Interactive dashboards, alerting, and mobile access
- Enterprise governance controls and role-based permissions
- Data integration capabilities alongside BI workloads
Why choose Qlik Sense: Qlik Sense fits teams where the questions change faster than dashboards can be built. Its associative model surfaces connections that standard filter-based BI hides, which matters when your product data crosses multiple source systems.
Qlik Sense pricing: Qlik Cloud Analytics Starter plans begin at $300/month for 10 users (billed annually). Standard is $825/month for 25 GB of data and Premium is $2,750/month for 50 GB, both billed annually. Enterprise pricing requires contacting sales. Client-managed Qlik Sense pricing is contact-sales only.
G2 rating: 4.4/5 (verified October 2026)
9. Domo
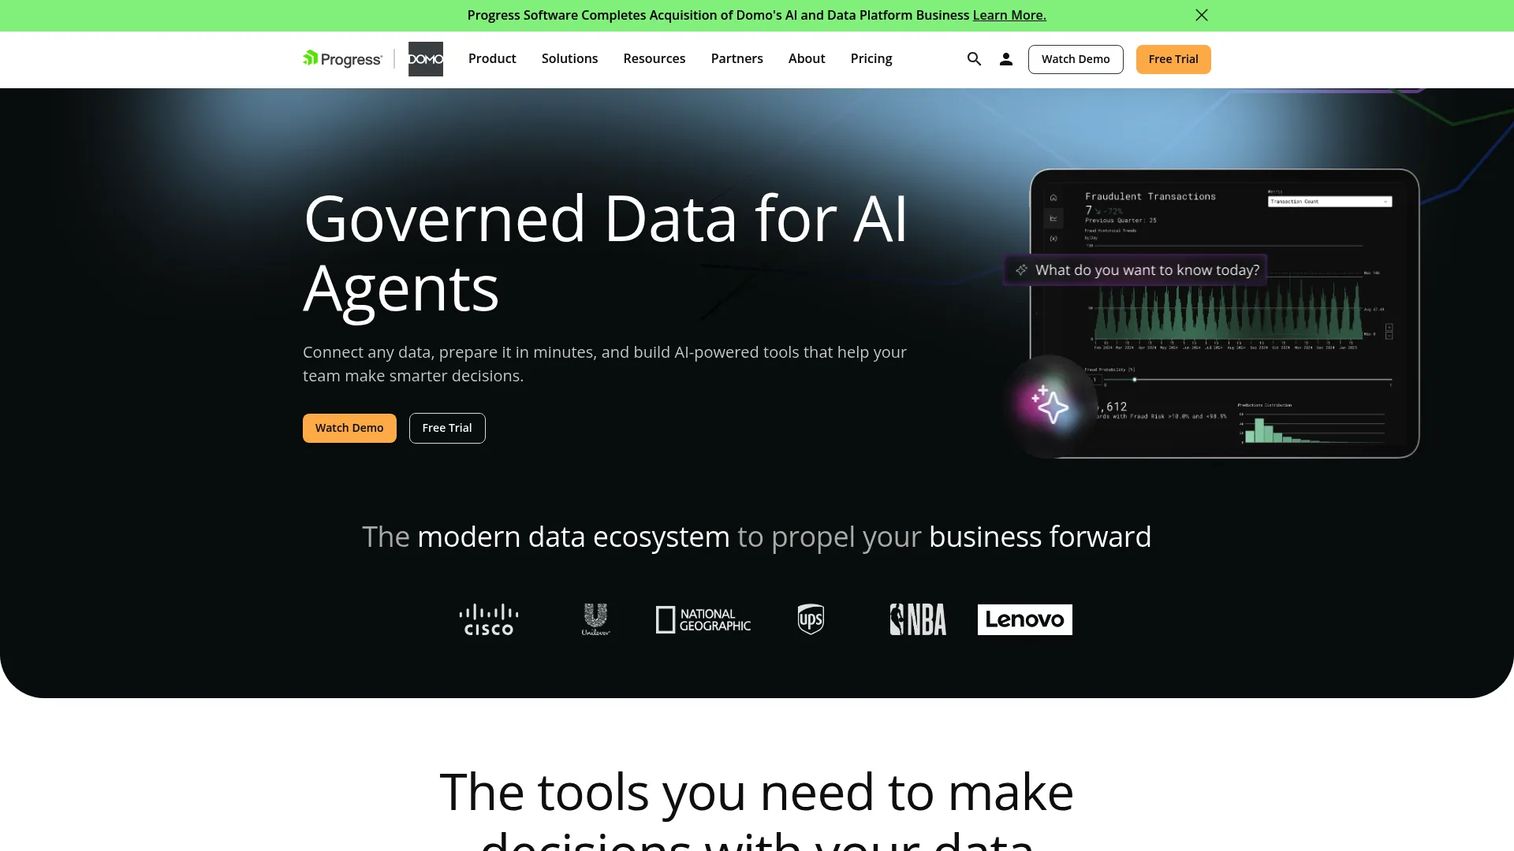
Domo is a cloud-based data and AI platform focused on connecting data from many business systems into operational dashboards that non-technical users can navigate without waiting on analysts. Its connector library spans 1,000+ pre-built integrations, and its Magic ETL tool handles visual data preparation without code. For PMs coordinating product data alongside go-to-market, support, and finance systems, Domo's breadth reduces the "we can't get that data into the dashboard" conversation. Total cost scales with usage, users, and data volume, so model that carefully before committing.
Best for: Cross-functional teams that need fast operational reporting from many SaaS and business systems without heavy data engineering overhead.
Key features
- 1,000+ pre-built data connectors for SaaS and business systems
- Magic ETL for visual, low-code data preparation
- BI dashboards with 150+ chart types and natural-language exploration
- AI and machine learning capabilities built into the platform
- Embedded analytics and alert-driven mobile access
Why choose Domo: Domo's connector depth and business-user focus reduce time-to-dashboard for cross-functional reporting. It's less suited to teams that need deep semantic modeling or engineering-grade data transformation pipelines.
Domo pricing: A 30-day free trial with unlimited users is available. Paid plans use credit-based, consumption pricing and require contacting sales. Costs scale with usage volume, so request a model from Domo that reflects your expected monthly active rows and connector count.
G2 rating: 4.3/5 (verified October 2026)
10. SAS Viya
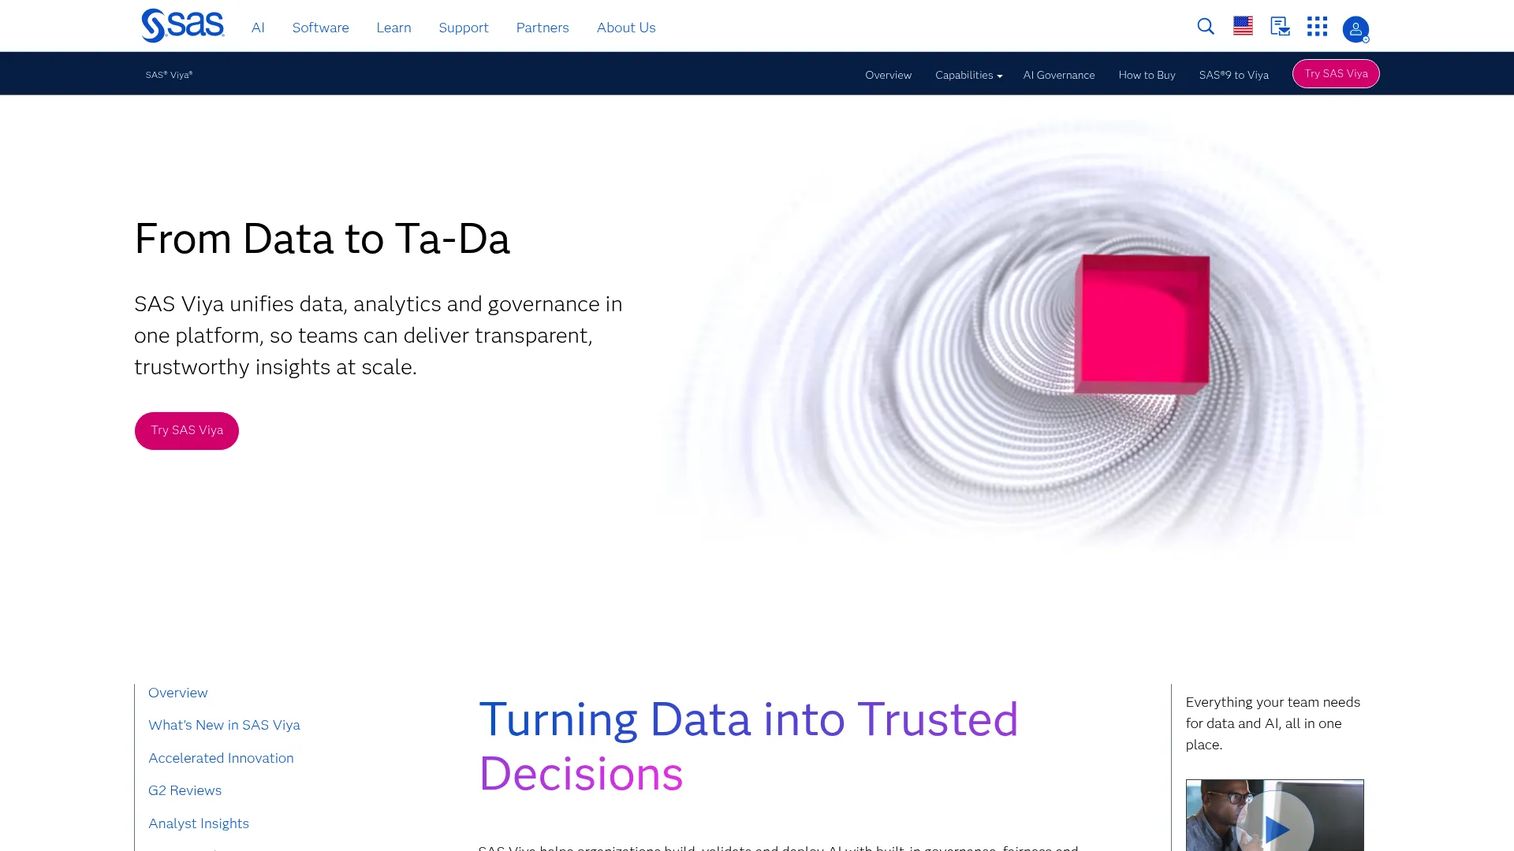
SAS Viya is an enterprise analytics and AI platform with deep roots in advanced statistical modeling, model governance, and regulated decisioning environments. Industries where model auditability is a regulatory requirement, including financial services, healthcare, and insurance, have standardized on SAS for decades. Viya brings those capabilities to a cloud-native architecture with data management, machine learning, and interactive reporting in one environment. This is rarely the first tool a lean product team buys for activation dashboards; it fits where advanced modeling and compliance governance are genuine requirements. For a focused look at predictive analytics software, that guide covers the broader landscape.
Best for: Large organizations with advanced analytics, model governance, risk, fraud, or regulated decisioning requirements.
Key features
- Advanced analytics and statistical modeling workflows
- Machine learning and AI model development and deployment
- Model governance and auditability for regulated environments
- Interactive reports, dashboards, and data visualization
- Enterprise deployment across cloud and on-premises
Why choose SAS Viya: Choose SAS Viya when statistical rigor and model governance are non-negotiable requirements, not nice-to-haves. It's not the fastest path to an activation dashboard, but it's a defensible choice for organizations where the analytics must withstand regulatory scrutiny.
SAS Viya pricing: SAS provides customized quotes and offers a private free trial. Contact SAS sales for current commercial pricing based on your deployment model and product selection.
G2 rating: 4.3/5 (verified October 2026)
11. IBM Cognos Analytics
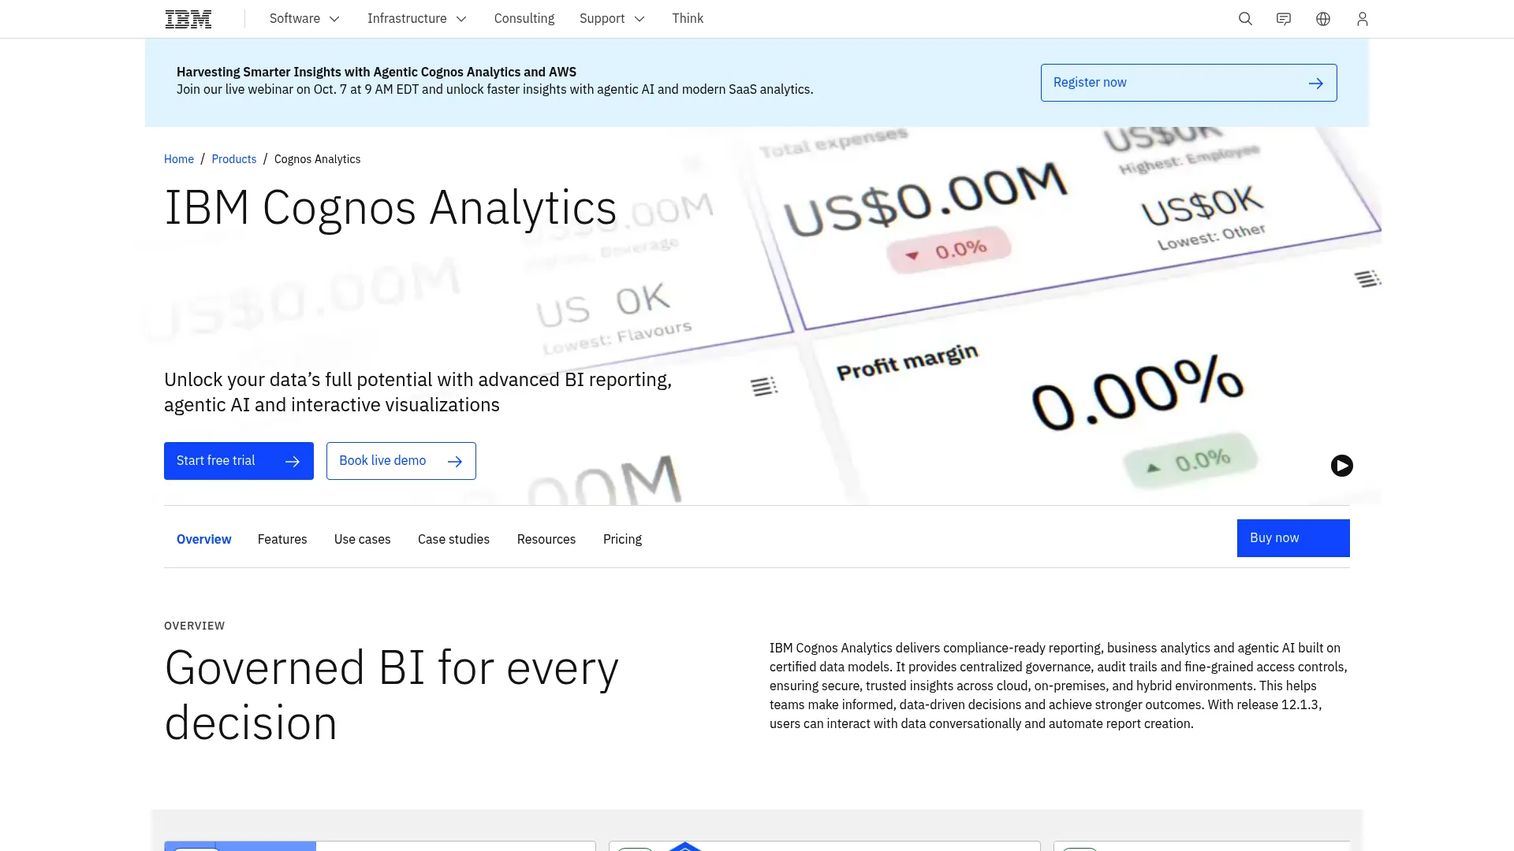
IBM Cognos Analytics is an enterprise BI and reporting platform for organizations that need governed, repeatable reporting with strong administrative controls. Its AI Assistant and reporting agents extend self-service capabilities, while scheduled report distribution and centralized governance make it a fit for enterprises with formal reporting requirements. Teams not already aligned to IBM's technology stack should weigh whether Cognos's governance depth justifies the setup investment compared to lighter BI tools. For PMs at lean product organizations, it may be more infrastructure than the job requires.
Best for: Enterprises with formal reporting requirements, established data governance, and existing IBM-centered technology environments.
Key features
- Business reporting with customizable, scheduled report authoring
- Interactive dashboards, stories, and data exploration
- AI Assistant and reporting agents for self-service analysis
- Governed data access and centralized administration
- Predictive forecasting built into the analytics layer
Why choose IBM Cognos Analytics: Cognos fits organizations where reporting standardization and audit trails matter more than dashboarding speed. It's a governance-first choice for enterprises that already operate inside IBM's infrastructure.
IBM Cognos Analytics pricing: Standard plans start at $10.60/user/month (billed monthly). Premium plans start at $42.40/user/month. IBM notes that displayed prices are indicative and may vary by country.
G2 rating: 4.1/5 (verified October 2026)
12. Apache Spark
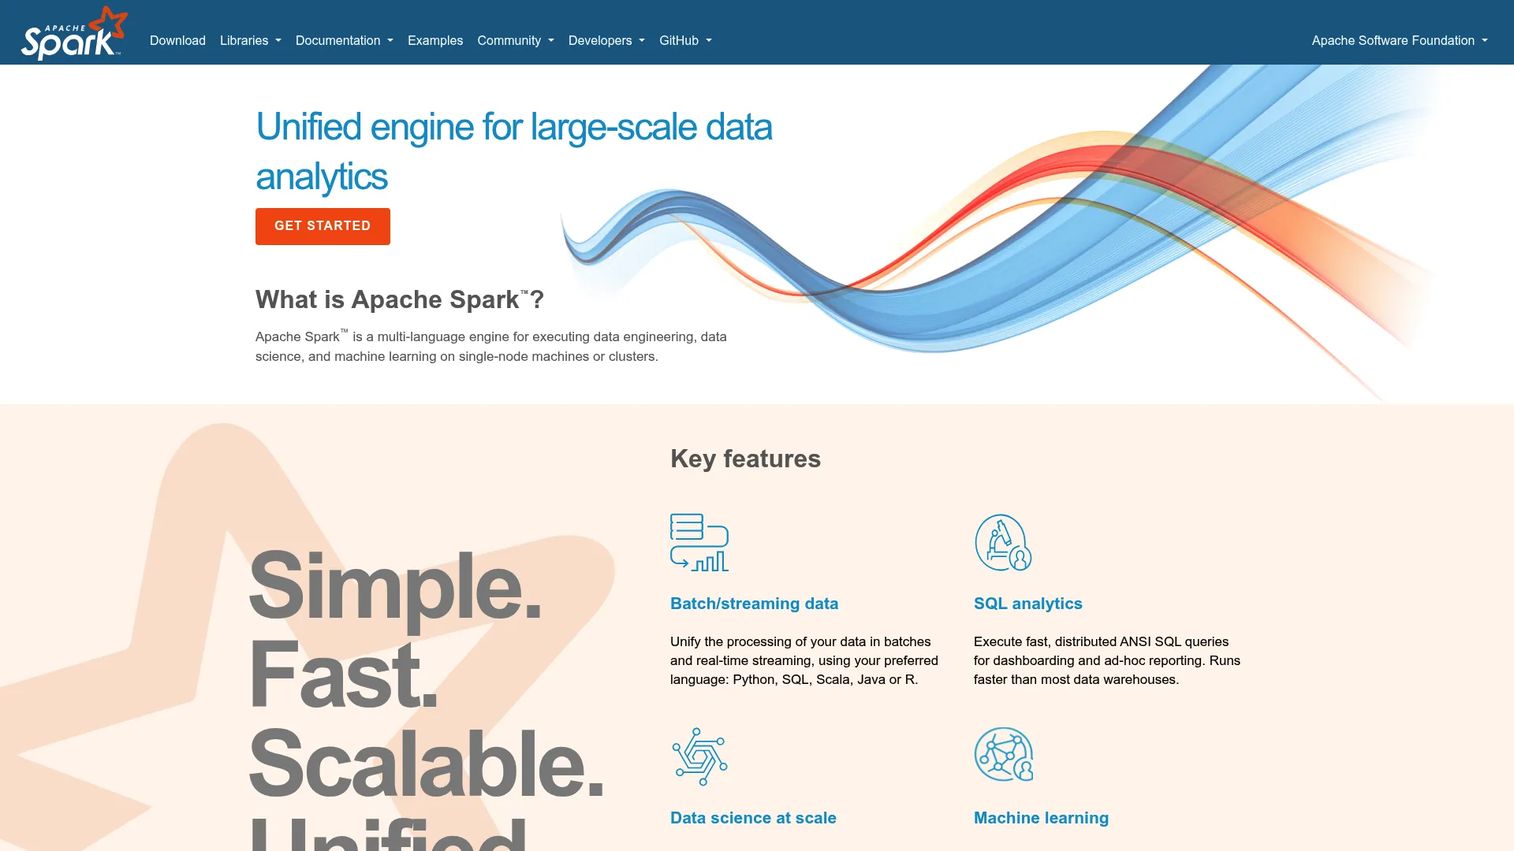
Apache Spark is an open-source distributed processing engine, not a dashboard or warehouse platform. That distinction matters: Teams who select Spark are choosing infrastructure for large-scale computation, not a complete analytics product. It handles batch processing, streaming, SQL analytics via DataFrames, and machine learning at scale. Spark requires engineering ownership, deployment decisions (self-managed cluster vs. managed service like Databricks or EMR), and downstream storage and BI tools to complete the stack. It earns a place on this list because processing engines are a distinct job in the analytics architecture, and Spark is the most widely adopted open-source option for that job.
Best for: Data engineering teams that need custom large-scale processing across batch, streaming, or machine learning workloads with full infrastructure control.
Key features
- Distributed batch and real-time streaming data processing
- SQL and DataFrame APIs for large-scale analytics
- MLlib for machine learning at distributed scale
- Graph processing with GraphX
- Open-source ecosystem with broad cloud and managed service support
Why choose Apache Spark: Choose Spark when engineering owns the computation layer and needs flexibility that managed platforms can't provide at your scale or cost point. Factor in the deployment and maintenance burden before comparing it to managed alternatives.
Apache Spark pricing: The core Apache Spark project is free and open source. Costs for managed deployments vary by cloud provider and service tier; verify separately with AWS EMR, Azure HDInsight, Google Dataproc, or Databricks depending on your environment.
G2 rating: 4.3/5 (verified October 2026)
13. Altair AI Studio
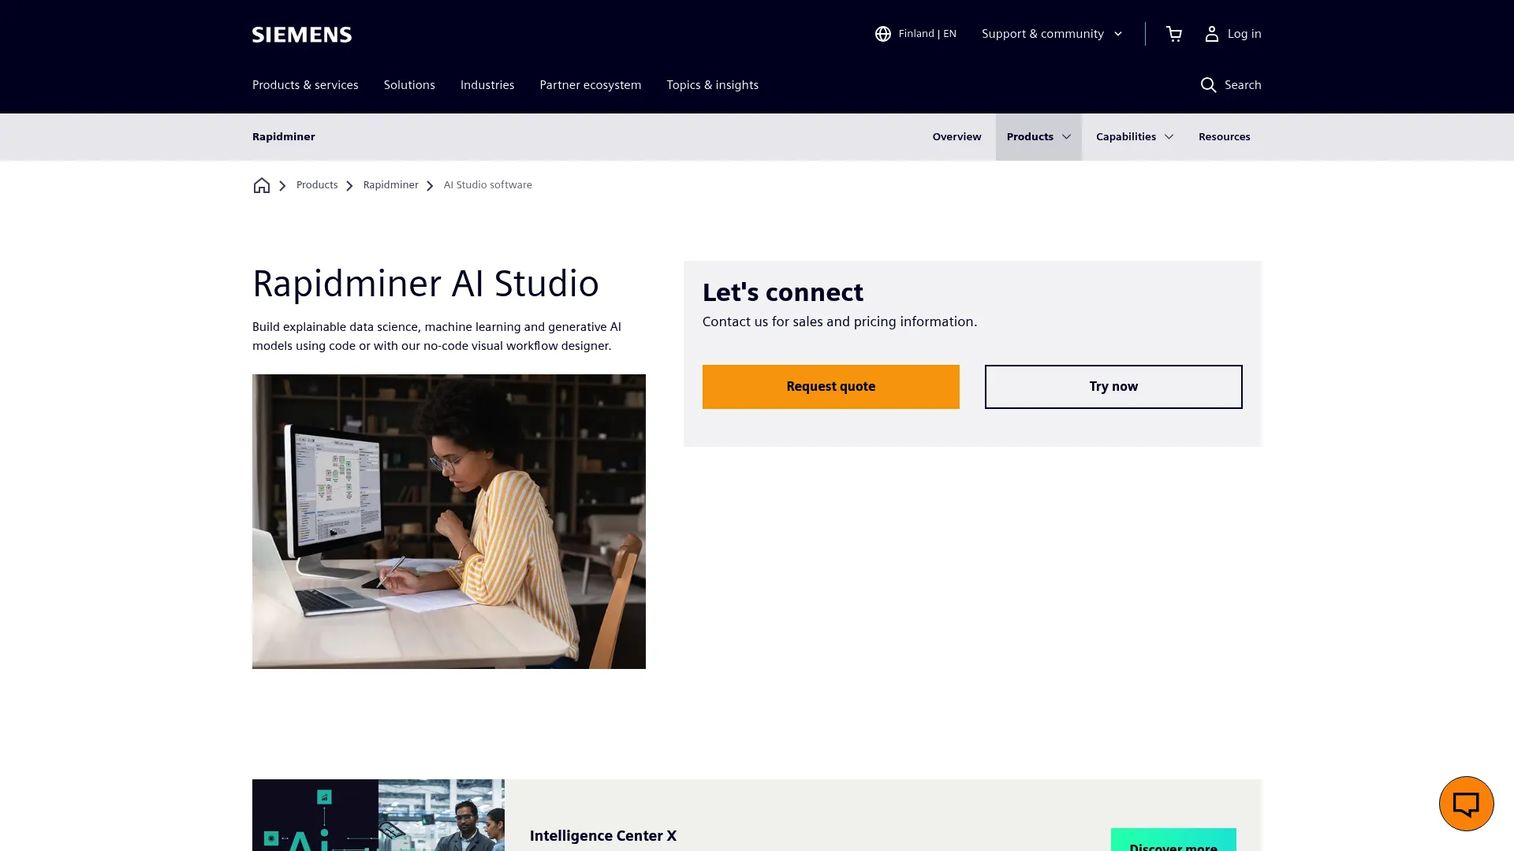
Altair AI Studio is an end-to-end data science platform for building, training, testing, and deploying explainable AI and machine learning models through a code-free visual workflow editor alongside integrated Python and R notebooks. Its connectivity spans cloud platforms, data lakes, warehouses, SQL databases, and IoT data streams. Analysts and data science teams that need faster prototype analysis without writing every step in code will find the drag-and-drop workflow designer reduces iteration time. It complements a warehouse and BI layer rather than replacing either; position it as the modeling and experimentation environment in a broader stack.
Best for: Analysts and data science teams building explainable ML models and predictive analytics workflows from exploration through deployment.
Key features
- Code-free drag-and-drop visual workflow editor
- Integrated Python and R notebook environment
- Connectivity to cloud platforms, data lakes, warehouses, and SQL databases
- Explainable AI and machine learning model development
- Enterprise deployment across cloud, on-premises, or hybrid
Why choose Altair AI Studio: Altair AI Studio reduces the gap between business analysts and data scientists by making workflow construction visual. Its explainability focus matters for organizations where model decisions need to be auditable, not just accurate.
Altair AI Studio pricing: A free edition is available for non-commercial purposes (renewable one-year license). Commercial pricing is not publicly displayed; contact Altair for enterprise licensing. The free edition is a practical entry point for teams evaluating fit before procurement.
G2 rating: 4.6/5 (verified October 2026)
14. RapidMiner
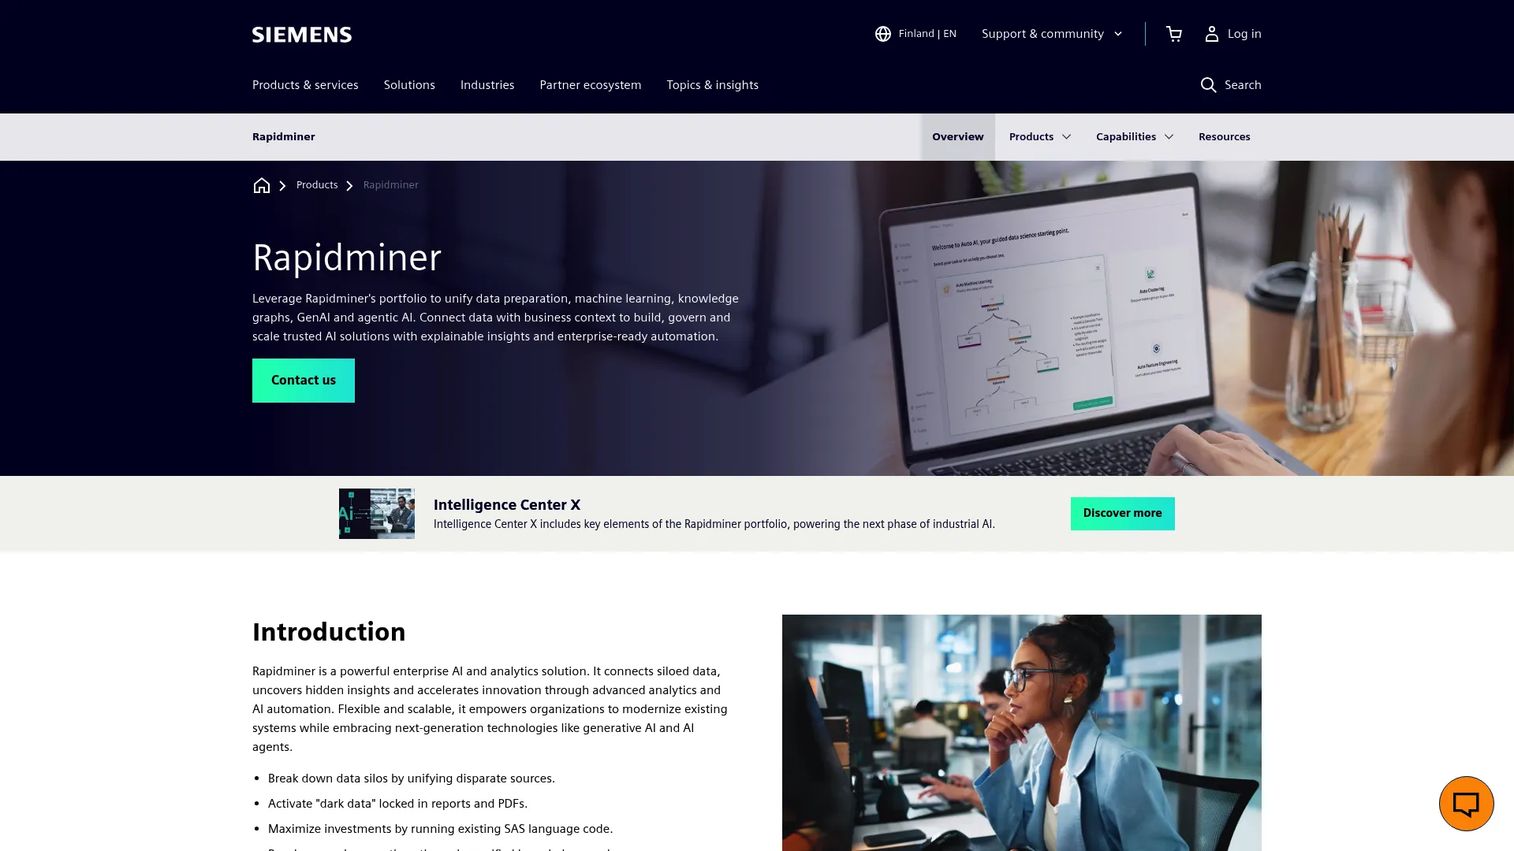
RapidMiner is enterprise AI and analytics software for data preparation, machine learning, knowledge graphs, generative AI, and agentic AI workflows, now part of Altair following its acquisition. The platform supports visual drag-and-drop data science, AutoML, and explainable modeling alongside SAS language, Python, R, and SQL. Teams with limited appetite for code-heavy data science but serious modeling requirements use RapidMiner to build reusable analytic pipelines. Verify current product packaging, commercial availability, and deployment models directly with Altair before finalizing any procurement decision, as the product has undergone ownership changes.
Best for: Teams evaluating visual data preparation and predictive analytics workflows with limited appetite for code-heavy data science.
Key features
- Visual drag-and-drop machine learning and data preparation workflows
- AutoML, generative AI, and explainable model development
- Data preparation from PDFs, spreadsheets, databases, and cloud sources
- Knowledge graph creation for contextual AI applications
- Real-time and historical data visualization
Why choose RapidMiner: RapidMiner fits teams that need serious modeling capabilities without requiring every analyst to write production Python. Its visual workflow approach accelerates iteration for mixed-skill data teams.
RapidMiner pricing: Pricing is not publicly displayed on the current Altair site. Contact Altair sales for current commercial licensing, deployment options, and available tiers. Verify product availability and roadmap directly before committing.
G2 rating: 4.6/5 (verified October 2026)
15. Fivetran
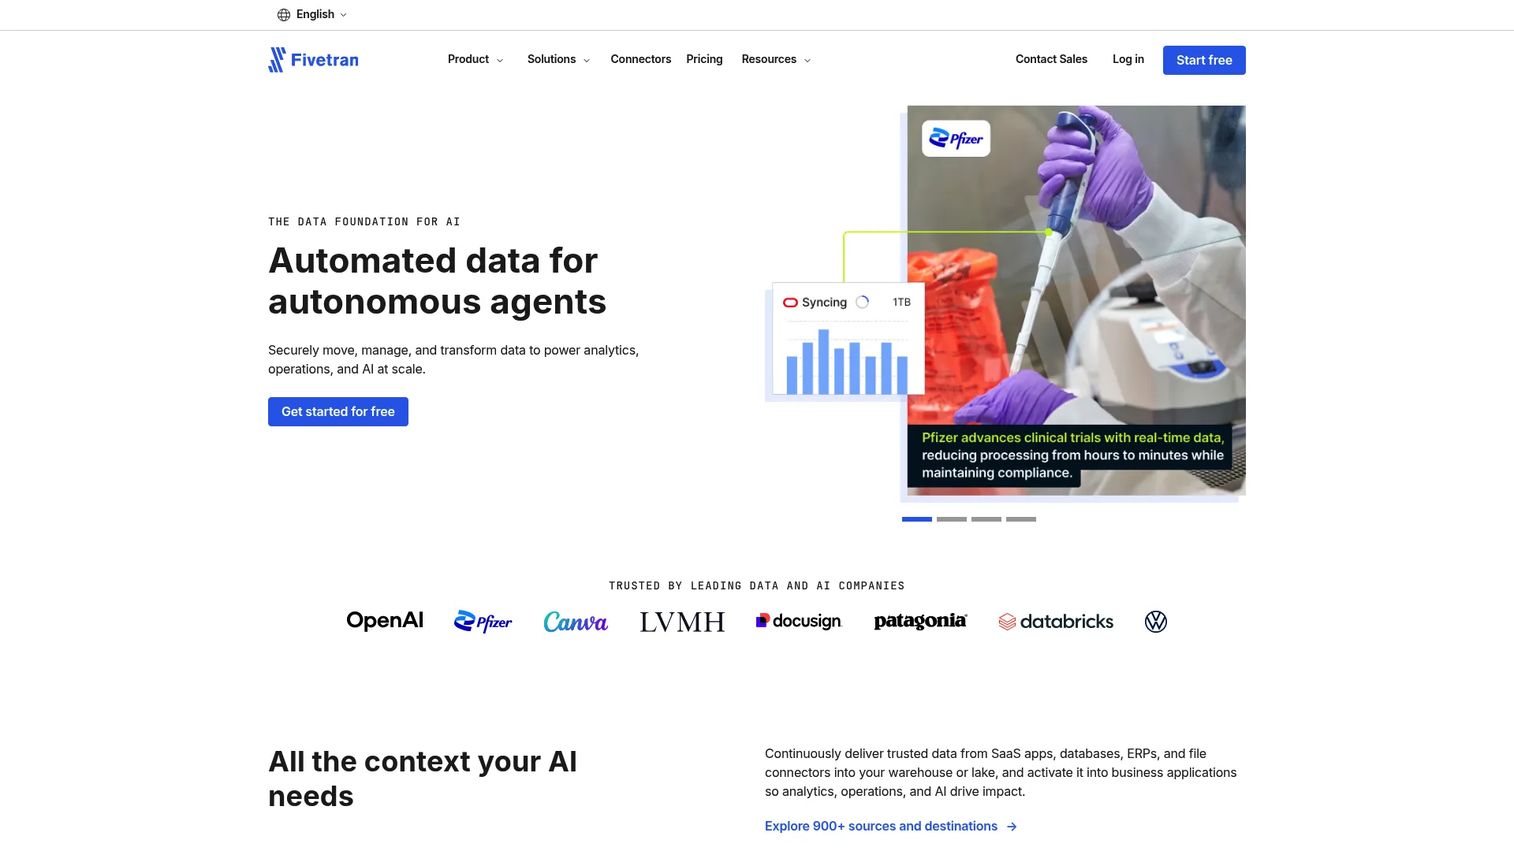
Fivetran is an automated data movement platform that replicates applications, databases, events, and files into data warehouses and lakehouses. It earns a place on this list because analytics fails when product, CRM, billing, support, and marketing data never arrives reliably in the destination platform. Fivetran's 700+ fully managed connectors handle schema changes, incremental syncs, and deletion capture automatically. It complements Snowflake, BigQuery, Databricks, and Microsoft Fabric rather than replacing any of them. For teams evaluating the full data layer, our guide on analytics platforms and ROI covers how integration quality affects downstream reporting.
Best for: Data teams that need managed connectors and dependable ingestion into a cloud warehouse or lakehouse without maintaining custom pipelines.
Key features
- 700+ fully managed connectors for SaaS apps, databases, and files
- Automated schema handling and incremental data syncs
- Data replication to warehouse and lakehouse destinations
- dbt Core integration for transformation workflows
- Role-based access control and private networking options
Why choose Fivetran: Fivetran reduces the engineering cost of keeping source data current in your warehouse. Teams that have built custom ingestion pipelines know the maintenance burden; Fivetran's managed connectors shift that work off the engineering backlog.
Fivetran pricing: A free tier is available with usage limits. Paid plans (Standard, Enterprise, Business Critical) use consumption-based pricing measured primarily by monthly active rows. Annual contracts may receive discounts. Contact Fivetran for current plan pricing and row-based cost modeling.
G2 rating: 4.3/5 (verified October 2026)
Considerations when choosing big data analytics software
Match the platform to the data job
Don't buy a processing engine because you need executive dashboards, and don't buy a BI layer when your event data never reaches a governed warehouse. Map your team's bottleneck before comparing feature lists. A lower license cost that creates a higher operating cost is still a bad tradeoff.
Define metric ownership before rollout
Product managers need shared definitions for activation, retention, active users, and adoption before any dashboard goes live. Assign owners for the metric layer, data quality checks, and reporting changes at the start of the procurement process. Governance failures discovered post-launch cost more to fix than they would have to prevent.
Measure engineering opportunity cost
Ask who builds pipelines, manages permissions, maintains semantic models, and investigates failed refreshes. Teams often undercount this when comparing license costs. A platform that requires dedicated engineering support for every dashboard change is not a BI tool; it's an engineering dependency.
Test security, governance, and access controls
Review role-based access, auditability, data residency requirements, and how the platform integrates with your existing identity system. Treat this as a required evaluation track, not a late procurement checkbox. Tools that handle cloud data security well document their controls explicitly.
Plan for release cadence and schema changes
Product data evolves every sprint. Evaluate how changes to events, properties, or source schemas affect downstream dashboards and transformation models. A platform that creates constant repair work slows decision making at exactly the moments when you need it most.
Conclusion
The 15 platforms in this guide cover four distinct jobs in the analytics stack.
Databricks, Snowflake, BigQuery, and Microsoft Fabric fit teams solving data platform and scale problems, where governed storage and processing are the foundation everything else depends on.
Power BI, Tableau, Looker, Qlik Sense, Domo, and IBM Cognos Analytics fit teams prioritizing BI, reporting, and shared decisions across product, finance, and go-to-market stakeholders.
SAS Viya, Altair AI Studio, and RapidMiner serve advanced analytics and predictive modeling requirements, particularly where explainability and governance are non-negotiable.
Apache Spark supports engineering-led distributed processing when scale and flexibility outweigh managed-service convenience. Fivetran keeps data moving reliably into the rest of the stack.
Start with the decision your team cannot make today because the data is missing, inconsistent, late, or inaccessible. Then choose the category before choosing the brand.
For teams building the product analytics layer specifically, our guides on product analytics software and predictive analytics tools cover adjacent tools worth evaluating alongside those listed here.
Start your journey with Guideflow today!
FAQs
The best option depends on which layer of the stack is broken. Product teams typically combine a cloud data warehouse (Snowflake, BigQuery, or Fabric), an ingestion tool (Fivetran), and a BI layer (Power BI, Looker, or Tableau). Prioritize trustworthy event instrumentation, metric governance, and segment analysis over dashboarding features when comparing options. Maintenance burden matters as much as capability when your release cadence is weekly.
Business intelligence software focuses on dashboards, reporting, and self-service analysis for stakeholders. Big data analytics software is a broader category that also includes the storage, processing, streaming, data science, and integration layers that make BI possible in the first place. You can have BI without big data infrastructure, but reliable BI at scale usually requires a governed data layer underneath it.
A warehouse becomes necessary when you need to join product event data with CRM, billing, support, or finance data to answer cross-functional questions. Smaller teams often begin with a dedicated product analytics tool, but cross-functional reporting and metric consistency across Product, Sales, and Customer Success almost always create a warehouse requirement eventually.
Databricks provides the most complete end-to-end ML environment, from feature engineering to model deployment. Google BigQuery includes BigQuery ML for in-database modeling. SAS Viya, Altair AI Studio, and RapidMiner each provide visual ML workflow environments with varying levels of code flexibility. Apache Spark handles distributed ML computation through MLlib. The right choice depends on whether your team needs a managed ML platform or distributed compute infrastructure.
Apache Spark is a distributed processing engine, not a complete analytics platform. It handles large-scale data transformation, batch computation, streaming workloads, and ML training, but it relies on separate storage, orchestration, governance, and BI tools to complete the architecture. Teams choosing Spark are choosing infrastructure, not a ready-to-use analytics product.
Evaluate against six practical criteria: Reliable instrumentation for your event data, segment analysis across user personas and lifecycle stages, shared metric definitions that hold across Product and Finance, experiment evaluation speed, manageable maintenance across release cycles, and access controls that meet your organization's compliance posture. Feature volume is not a useful evaluation criterion; maintenance cost and metric trustworthiness are.
Costs vary significantly by category. BI tools typically use per-user subscriptions starting from roughly $10 to $75 per user per month depending on tier and vendor. Cloud warehouses charge for compute and storage consumption, which can range from near-zero for small teams to six figures for large enterprises. Integration tools charge by usage metrics like monthly active rows. Platforms like Databricks use per-second consumption pricing. Always model total operating cost, including engineering time for setup and ongoing maintenance, not just license fees.
Rarely. Platforms like Microsoft Fabric or Databricks cover multiple layers (ingestion, storage, processing, and BI in one environment), which reduces the number of separate tools needed. Most production architectures still use dedicated tooling for at least two of the four jobs: Ingestion, storage, transformation, and reporting. The right architecture depends on your data volume, governance requirements, and how much in-house technical ownership your team can sustain.