

Your customers want to see their data inside your product, not in a separate login on someone else's domain. Every time they leave your app to open a reporting tool, you lose the moment, the context, and a little bit of perceived product value. For SaaS teams, that gap between "we have the data" and "the customer sees the data where they work" is where retention quietly leaks.
Building that experience from scratch is expensive. According to Toucan Toco's 2026 build-vs-buy analysis, a production-grade embedded analytics module typically costs $181,000 to $310,000 in year one and takes six to twelve months to ship a first dashboard, usually with two senior engineers working full time. Buying an embedded analytics platform instead brings that first dashboard down to four to eight weeks. That math is why most product teams now treat embedded analytics as a buy decision, not a build one.
This guide is written for product marketing managers and product teams evaluating embedded analytics for SaaS. You already know you need customer-facing analytics. The harder question is which tool fits your data stack, your security requirements, your brand standards, and your pricing model without locking you into something you regret at scale. If your evaluation also touches in-product education, our roundup of the best product analytics software tools is a useful companion read.
What embedded analytics is
Embedded analytics is the practice of placing dashboards, reports, and data exploration directly inside another software product, so users analyze data in the same place they already work instead of switching to a standalone business intelligence tool.
Traditional BI lives as a destination. A user logs into a separate platform, finds the right workspace, and interprets charts disconnected from the workflow that generated them. Embedded BI flips that. The analytics appear inside your SaaS product, under your brand, in the context of the task at hand.
For SaaS teams, embedded analytics usually covers four things:
- Dashboard embedding: Charts, KPIs, and visualizations rendered inside your app's own interface.
- Reporting: Scheduled or on-demand reports your customers can read, filter, and export without leaving your product.
- Personalization: Views shaped by who the user is, which account they belong to, and what they are allowed to see.
- Self-service analytics: The ability for end users to filter, drill down, and explore without filing a request to your data team.
Why embedded analytics matters for SaaS teams
The embedded analytics market is growing fast. Fortune Business Insights values it at $22.93 billion in 2025 and projects $26.88 billion in 2026, reaching $86.2 billion by 2034 at a 15.68% CAGR. North America held 31.26% of that market in 2025. The growth tells you something simple: data inside the product has become a baseline expectation, not a premium add-on.
For product marketing managers, embedded analytics maps directly to the metrics you own.
- Adoption: When users see their results inside your product, the value proposition stops being a claim and becomes visible. Analytics turns "trust us, this works" into "look at what you did this month."
- Stickiness: A dashboard that surfaces a customer's own data is a reason to log in. It is harder to churn from a product that holds your reporting than one that holds your settings.
- Monetization: Embedded dashboards become a tier. Advanced analytics, custom reports, and white-label dashboards are features you can package and charge for.
- Customer education: In-product analytics is proof. It shows customers the outcome of adopting a feature, which is the strongest argument any launch can make. The same logic applies to interactive demos that show customers exactly how a feature delivers value.
- Reduced context switching: Every tool a customer opens to understand their data is friction. Embedded analytics removes the round trip.
The PMM angle is the most important one: embedded analytics is in-product storytelling. It is where your positioning meets the customer's actual results, with no slide deck in between. Pairing that data story with product tours can guide users to the dashboards that matter most.
How embedded analytics works
Embedded analytics tools support several implementation models. The method you choose shapes how fast you ship, how much UI control you get, and how deeply the analytics feel native to your product.
Here is how the main approaches compare at a glance.
| Method | What it does | Commonly used when |
|---|---|---|
| iFrames | Embeds a hosted dashboard inside a frame in your app | You want a fast path to live dashboards |
| SDKs and web components | Renders analytics as native UI elements you control | You want a product-native, branded experience |
| APIs and URL-based | Programmatic control over data, provisioning, and behavior | You need orchestration, automation, or dynamic logic |
iFrames
An iFrame is the simplest embed path. You generate a secure URL for a dashboard and drop it into a frame inside your application. The analytics vendor hosts and renders everything, so your engineering team writes very little code.
This approach works best when you need dashboards live quickly and basic interactivity covers the use case. iFrames handle authentication through signed URLs or tokens, which keeps multi-tenant data separated.
SDKs and web components
SDKs and web components give you tighter control over how analytics look and behave inside your product. Instead of loading a hosted page in a frame, you render charts and controls as components within your own front-end framework.
This is where embedded dashboards start to feel native. You control layout, styling, interactivity, and how the analytics respond to events in the rest of your app. SDK embedding is the path teams take when brand consistency and a product-native experience matter more than speed alone.
APIs and URL-based approaches
APIs handle the orchestration layer. They let you provision workspaces, manage users, sync data permissions, automate report delivery, and control analytics behavior programmatically. URL-based approaches generate dynamic, parameterized links that adapt to the user and context.
These methods matter most when analytics has to participate in a lifecycle. If you provision a new tenant on signup, update permissions when a customer upgrades, or trigger reports based on product events, APIs are how you wire that together.
What to look for in embedded analytics tools
Before the list, here is the framework. Judge every tool against the same criteria so the comparison stays honest.
White-labeling and brand control
Customer-facing analytics carries your brand, not the vendor's. If a dashboard shows a third-party logo, mismatched fonts, or a color scheme that clashes with your product, the experience reads as bolted on.
White-label analytics means you control colors, fonts, layout, navigation, and domain. Evaluate how deep that control goes. Some platforms gate full white-labeling behind enterprise tiers, so confirm what branding you get at the price you plan to pay.
Use this quick checklist:
- Custom colors, fonts, and themes
- Your domain, not the vendor's
- Removable or replaceable vendor branding
- Control over chart styling and layout
- Custom navigation and interaction patterns
Security and governance
Embedded analytics security is a buying gate, not a feature. The moment you show one customer's data inside your product, you have to guarantee they never see another customer's data. Reviewing a vendor's security and compliance posture early saves headaches later.
Look for these governance capabilities:
- SSO: Single sign-on so users authenticate through your existing identity provider.
- Row-level security: Data filtered at the row level so each user sees only their permitted records.
- Role-based access control: Permissions tied to roles, so an admin and an end user see different things.
- Tenant isolation: Hard separation between accounts in multi-tenant analytics setups.
- Auditability: Logs of who accessed what, which enterprise buyers and security reviews require.
Treat governance as a requirement. A platform that nails visualization but fumbles tenant isolation is not a fit for multi-tenant SaaS.
Self-service analytics experience
Self-service analytics is what your end users can do without asking your product or data team for help. The more they can do alone, the better your adoption and retention numbers. Building self-service experiences around your dashboards compounds that effect.
At minimum, evaluate whether users can:
- Filter and segment data on their own
- Drill down from summary to detail
- Adjust date ranges and dimensions
- Save and share views
- Export data and reports
Every self-service action a user takes is one they did not need a support ticket for. That deflection is real cost savings and a better experience at the same time.
Pricing and licensing model
Embedded analytics pricing varies more than almost any other software category, and the model matters as much as the number. Pricing predictability is the difference between a cost you can forecast and a surprise that arrives with your next growth spurt.
| Pricing model | How it scales | Watch for |
|---|---|---|
| Per-user / per-seat | Cost rises with named users | Expensive for wide, customer-facing rollouts |
| Usage-based | Cost rises with queries, sessions, or data | Hard to forecast under spiky usage |
| Capacity-based | Fixed capacity tiers | Step-changes when you exceed a tier |
| Core-based | Tied to compute resources | Predictable, but requires capacity planning |
For customer-facing analytics where you may have thousands of end users, per-seat pricing often scales painfully. Capacity and core-based models tend to give better pricing predictability at scale. Model your costs against your real user count before you commit.
AI and augmented analytics
AI analytics has moved from demo to default. The practical capabilities to look for, grounded in real product value rather than hype:
- Natural language query: Users ask questions in plain language instead of building queries.
- Guided insights: The platform surfaces notable changes automatically.
- Anomaly detection: Outliers and unexpected shifts get flagged without manual monitoring.
- Agentic analytics: AI agents that explore data and answer follow-up questions in context.
Judge AI features by whether they reduce work for your end users, not by how impressive the keynote demo looked.
Comparison table
This table covers the embedded analytics platforms in this guide. Pricing reflects publicly listed values where available; several vendors quote custom pricing for embedded use cases. Ratings come from G2.
| # | Product | Intent | Key differentiation | Pricing | G2 rating |
|---|---|---|---|---|---|
| 1 | Tableau | Governed visual analytics | Deep Salesforce ecosystem and embedding APIs | From $15/user/mo, annual | 4.4/5 |
| 2 | Microsoft Power BI | Microsoft-native BI | Broad adoption and flexible deployment | From $14/user/mo | 4.5/5 |
| 3 | GoodData | Embedded analytics platform | Semantic layer and multi-tenant architecture | Custom (quote-based) | 4.2/5 |
| 4 | Yellowfin | Embedded BI and guided insights | Automated insights and collaboration | Request pricing | 4.4/5 |
| 5 | Luzmo | Embedding-first for SaaS | White-label dashboards, fast delivery | From €495/mo, annual | 4.6/5 |
| 6 | Looker | Governed metrics | LookML semantic model, Google Cloud fit | Call sales | 4.4/5 |
| 7 | Sisense | Developer-oriented embedding | Compose SDK and AI throughout | From $399/mo | Not listed |
| 8 | Domo | Business-user analytics | Domo Everywhere and 1000+ connectors | Consumption-based | 4.3/5 |
| 9 | ThoughtSpot | Search and AI analytics | Natural language search, Spotter agent | From $25/user/mo, annual | 4.4/5 |
| 10 | Qlik | Enterprise data and analytics | Associative engine and Insight Advisor | From $300/mo, annual | 4.4/5 |
| 11 | Amazon QuickSight | AWS-native BI | SPICE engine and QuickSight Q | From $3/user/mo | 4.3/5 |
| 12 | Sigma | Warehouse-native analytics | Spreadsheet interface on live data | Custom | 4.4/5 |
| 13 | Oracle Analytics | Enterprise reporting | Governed reporting at large-org scale | From 74,40 €/user/mo | 4.1/5 |
Best embedded analytics tools for SaaS teams in 2026
We selected these embedded analytics platforms based on four factors that matter most to SaaS product teams: embedding flexibility (iFrames, SDKs, APIs, web components), security and multi-tenant governance, white-labeling depth, and pricing model fit for customer-facing rollouts. The list reflects tools with genuine embedded use cases, not standalone BI repackaged. Each entry connects capabilities to the jobs a product or PMM team actually needs to ship.
1. Tableau
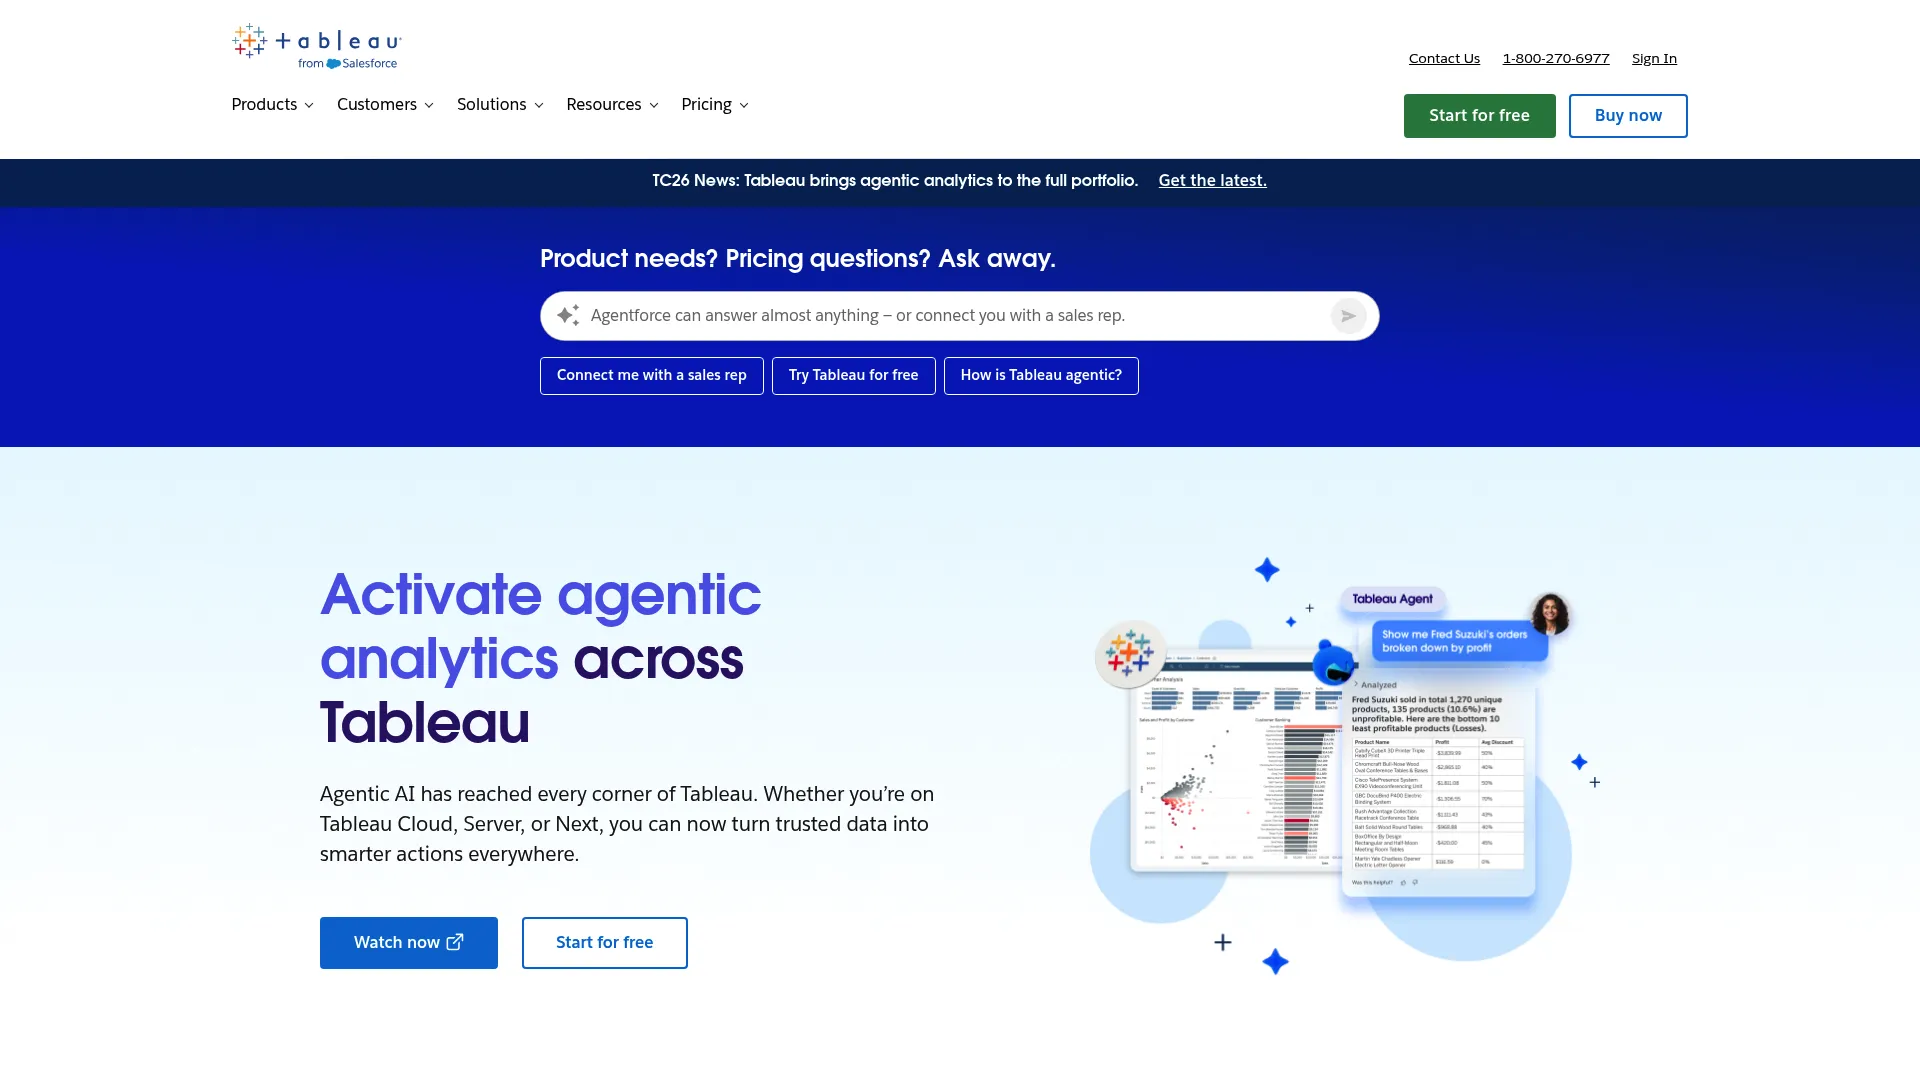
Best for: Teams already invested in the Tableau or Salesforce stack who need governed embedded analytics with strong visualization.
Key strengths
- Drag-and-drop visual analytics: Build rich dashboards without heavy engineering involvement.
- Cloud, server, and AI options: Deploy on Tableau Cloud, self-host on Tableau Server, or add agentic analytics.
- Connected Apps and user attributes: Secure embedding with trusted authentication and attribute-based access control.
Why choose Tableau: If your organization already lives in Tableau or Salesforce, the embedded path is shorter because your data models, governance, and skills transfer directly. It is the strongest fit when visualization quality and ecosystem continuity outweigh the cost of per-user licensing.
Tableau pricing: Tableau Cloud starts at $15 USD per user per month for Tableau Standard, billed annually, with Tableau Enterprise at $35 USD per user per month. Tableau Cloud+ and the Tableau+ bundle are quote-based through sales. A Creator license is required for each deployment, and additional users need Creator, Explorer, or Viewer licenses.
2. Microsoft Power BI
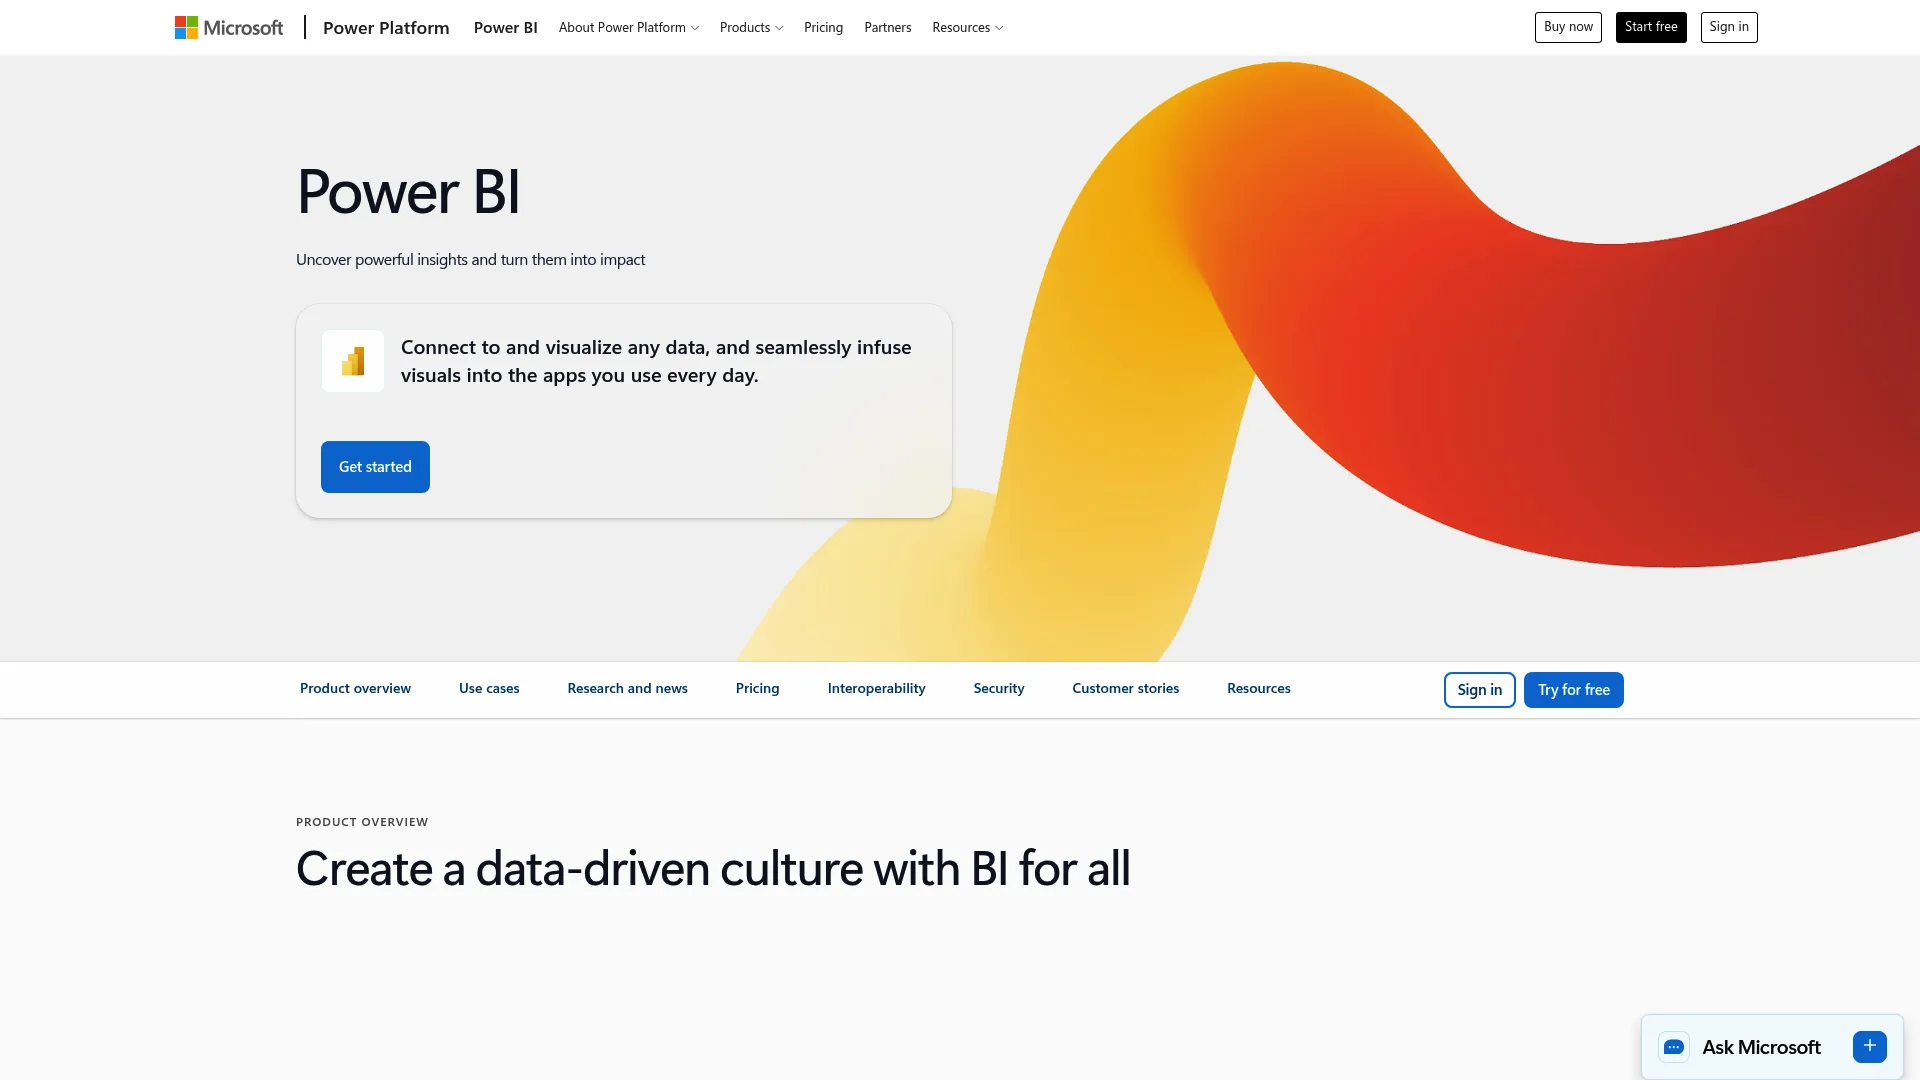
Best for: Teams in the Microsoft ecosystem who want widely adopted BI with flexible deployment and capacity-based embedding.
Key strengths
- Interactive dashboards and reports: Familiar, broadly adopted reporting that many of your customers already recognize.
- Data visualization and modeling: Strong modeling backed by the wider Microsoft data stack.
- Copilot AI: Natural language and AI-assisted analysis built into the platform.
Why choose Power BI: Power BI's reach is its advantage. Many customers already know the interface, which lowers the education burden on a customer-facing rollout. It fits best when your stack is Microsoft-native and capacity-based pricing suits your usage pattern.
Power BI pricing: As of April 1, 2025, Microsoft lists Power BI Pro at $14 USD per user per month and Power BI Premium Per User at $24 USD per user per month. Microsoft also references a free Power BI option. Power BI Embedded uses capacity-based pricing for embedding into applications.
3. GoodData
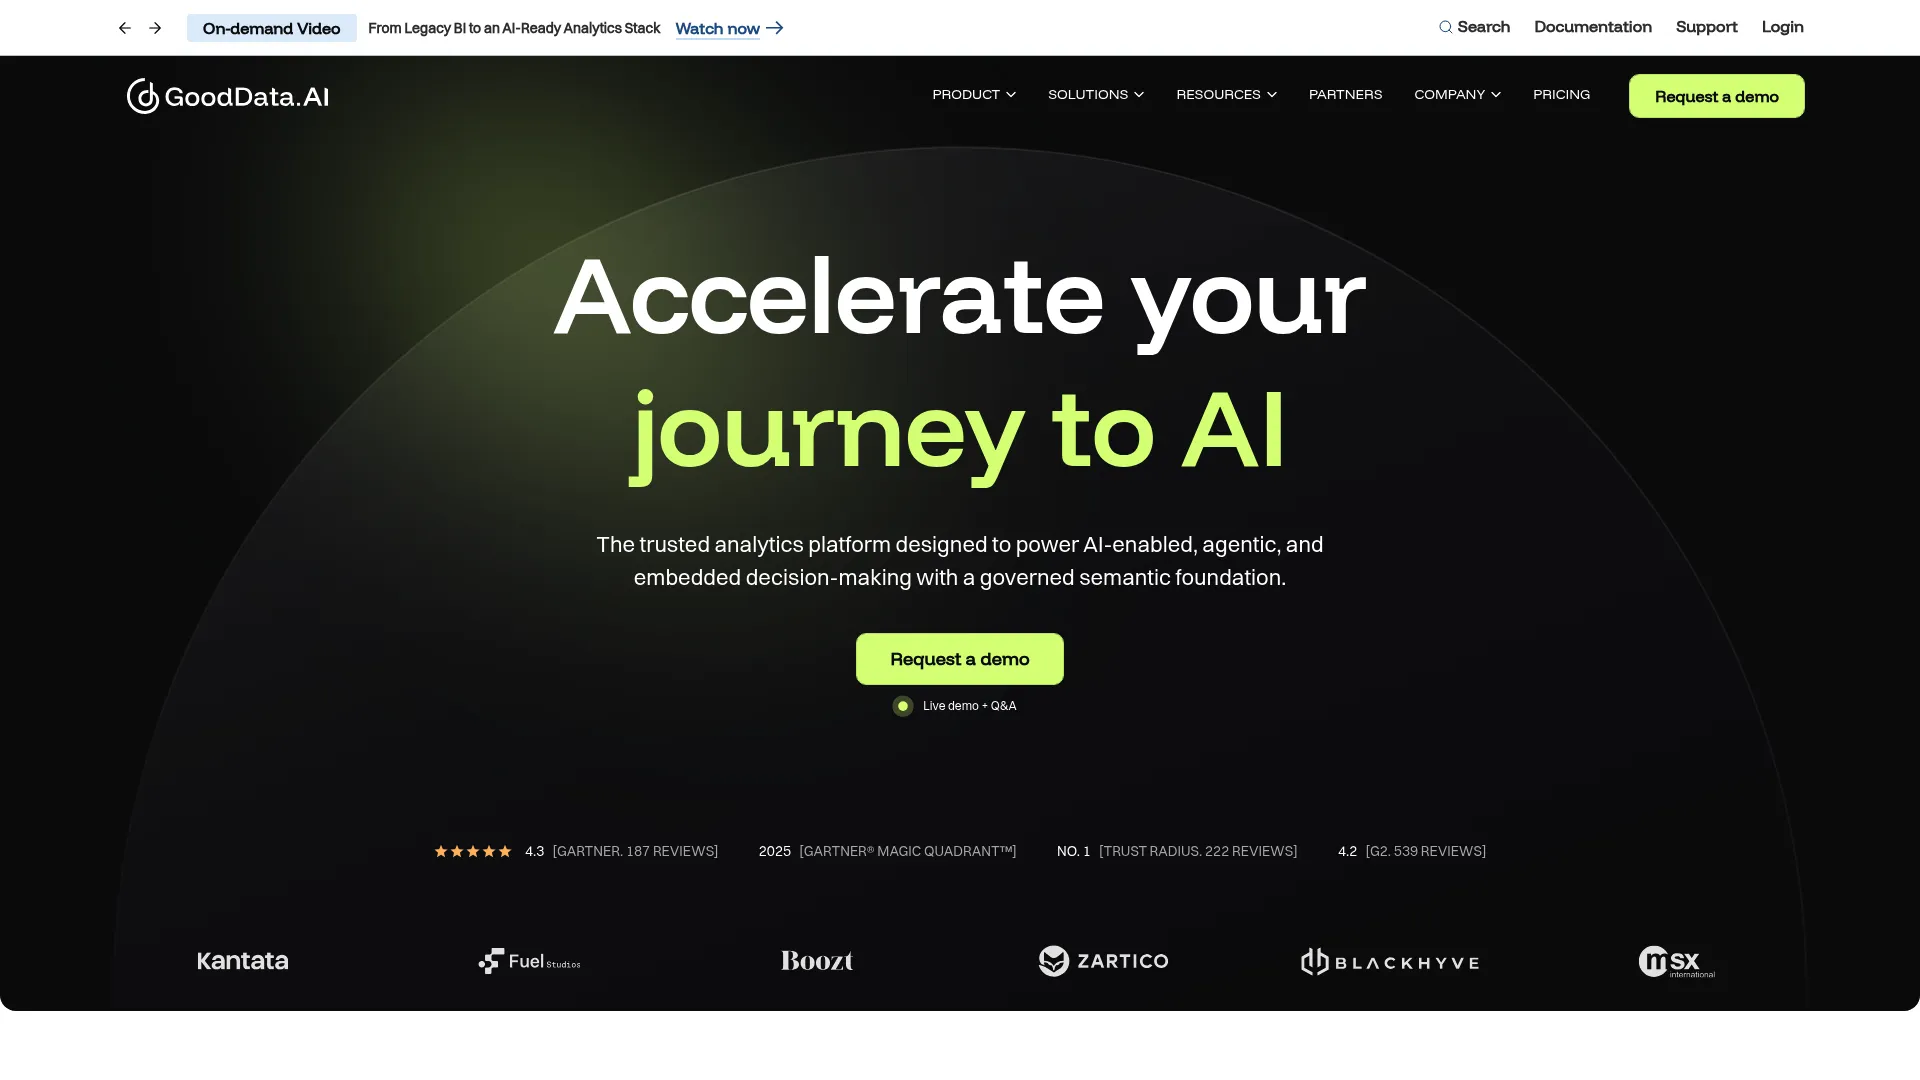
Best for: SaaS teams building scalable, governed embedded analytics across many tenants who want a developer-friendly workflow.
Key strengths
- Semantic layer: A governed model so metrics stay consistent across every embedded dashboard.
- Multi-tenant workspaces: Architecture designed for serving many customer accounts from one deployment.
- AI Assistant and agentic analytics: AI-native exploration built into the platform.
Why choose GoodData: GoodData fits teams that treat analytics as a product, not a report. The semantic layer and analytics-as-code approach reward engineering investment with consistency and scale across tenants. Pricing is quote-based, which suits considered evaluations more than quick trials.
GoodData pricing: GoodData's pricing page lists Professional and Enterprise offerings without public numeric prices. Pricing is quote-based, so you contact GoodData for figures tied to your deployment and tenant count.
4. Yellowfin

Best for: SaaS teams whose end users need help understanding data, where guided and automated insights add real value.
Key strengths
- Guided insights: Automated narratives that explain what changed and why.
- Collaborative analytics: Features that let users annotate, discuss, and share findings.
- Embedded reporting: Reports built to live inside your product, under your brand.
Why choose Yellowfin: Yellowfin earns its place when your customers are business users rather than data professionals. The augmented analytics layer does interpretive work that would otherwise fall to your support or success team. It fits teams that value education built into the analytics itself.
Yellowfin pricing: Yellowfin does not list public numeric pricing. Product pages direct you to request pricing or contact the team, so figures are tied to your specific embedded deployment.
5. Luzmo
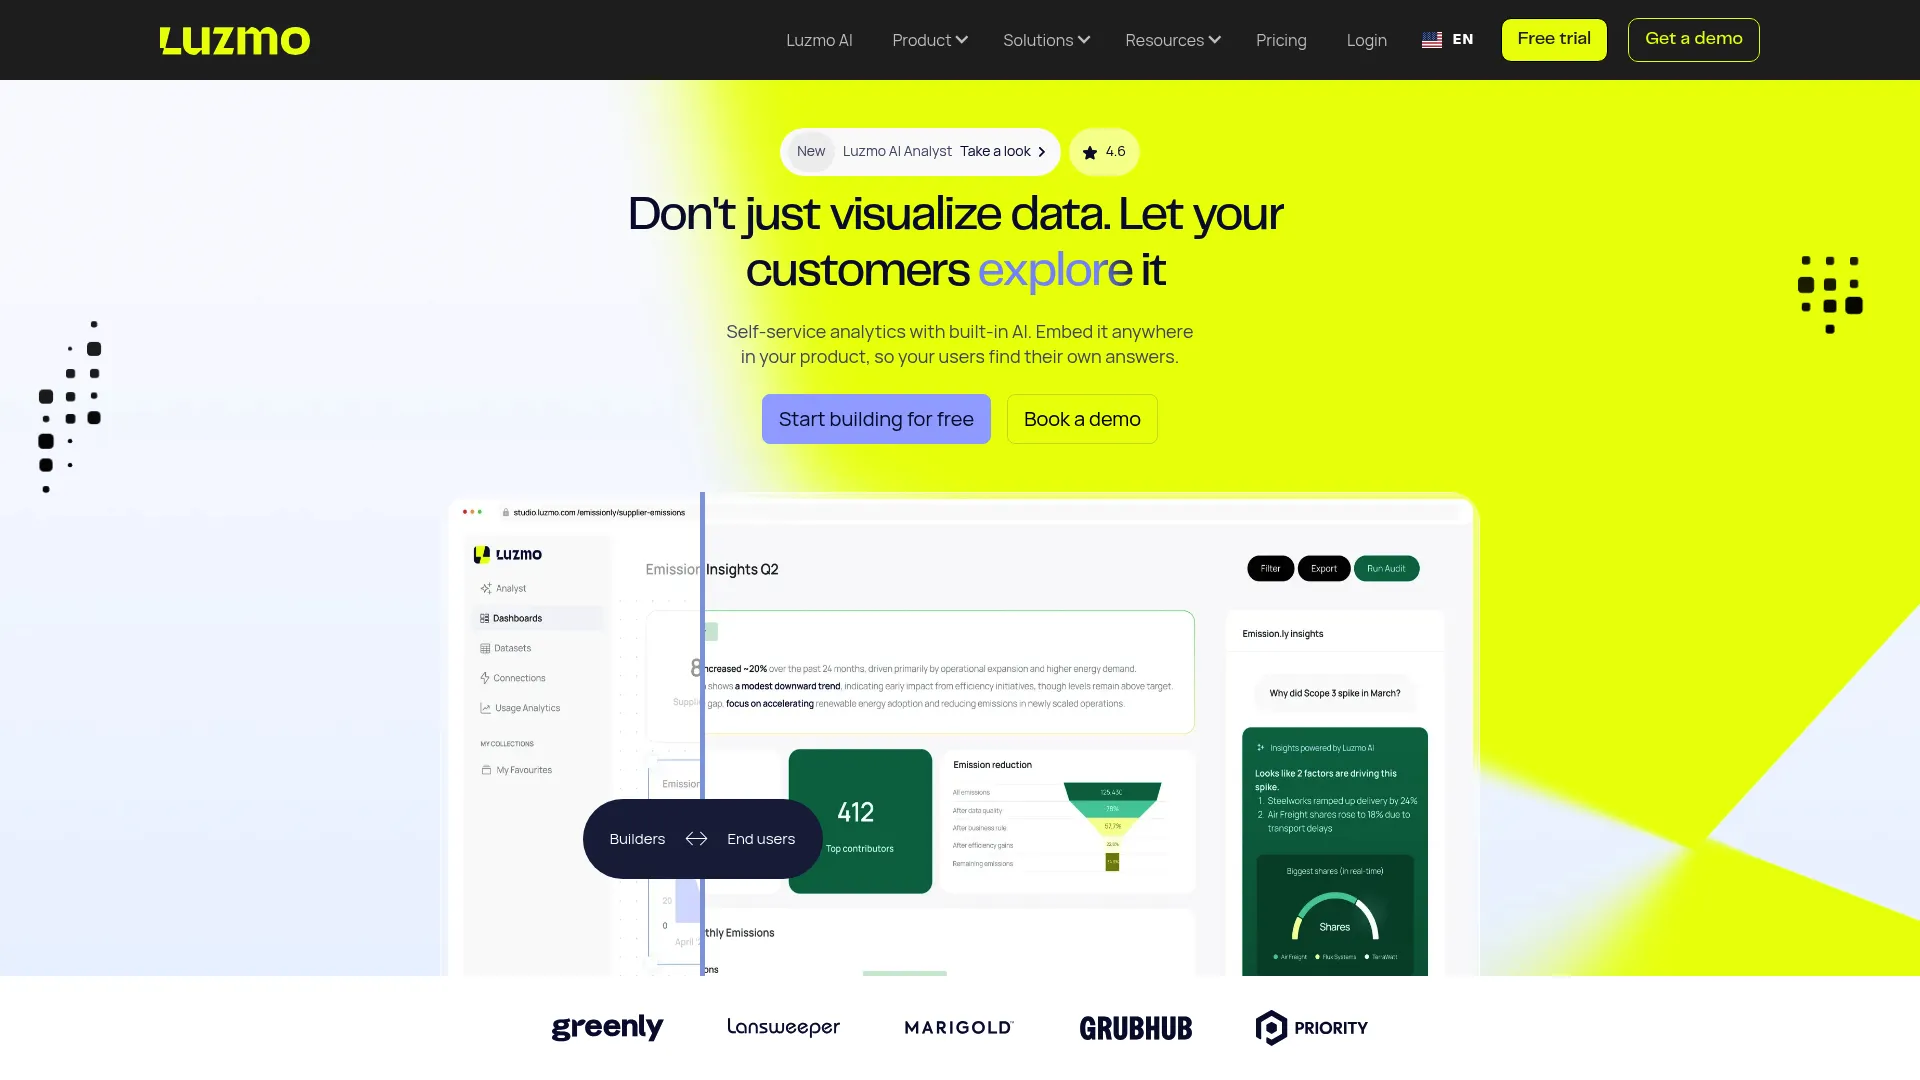
Best for: Product teams that want to ship branded, customer-facing analytics quickly without a heavy BI implementation.
Key strengths
- Drag-and-drop editor: Build dashboards fast without deep engineering cycles.
- White-label embedded analytics: Full brand control so dashboards feel native to your product.
- Multi-tenant access control and row-level security: Tenant separation handled at the platform level.
Why choose Luzmo: Luzmo is built around the embedded use case rather than adapted to it. For SaaS teams whose priority is shipping branded customer-facing analytics on a short timeline, the embedding-first design removes friction that general-purpose BI tools add. It fits teams that value speed to a polished, white-label result.
Luzmo pricing: Luzmo's Starter plan starts at €495 per month and Premium at €1,995 per month, both billed annually. Enterprise is custom pricing through sales. A free trial is available. Note that listed prices are in EUR.
6. Looker
Best for: Teams that need governed, consistent metrics across embedded analytics and operate on or near Google Cloud.
Key strengths
- LookML semantic modeling: Define metrics once and keep them consistent everywhere they appear.
- Rich embedding and API features: Flexible embedding options for product-native experiences.
- Google Cloud integration: SSO through IAM, private networking, and native BigQuery connectivity.
Why choose Looker: Looker excels when metric consistency is non-negotiable. If different teams keep calculating "active users" three different ways, LookML solves that at the source. It fits teams that want governed metrics and already build on Google Cloud.
Looker pricing: Looker offers Standard, Enterprise, and Embed editions, all shown as "Call sales" with annual commitments on the pricing page. User licensing is separate. No public numeric platform price is listed, so pricing comes through a sales conversation.
7. Sisense
Best for: Developer-oriented teams that want deep customization and control over embedded analytics experiences.
Key strengths
- Compose SDK: Code-first embedding for product-native, deeply customized analytics.
- Data modeling and blending: Combine and model data from multiple sources.
- AI throughout: Sisense Intelligence brings AI into the analytics workflow.
Why choose Sisense: Sisense rewards teams with engineering capacity who want to build rather than configure. The Compose SDK and extension model give developers control over how analytics behave inside the product. It fits teams that prioritize customization depth over out-of-the-box speed.
Sisense pricing: Sisense lists a Launch plan starting at $399 per month and a Grow plan at $1,299 per month, with a Scale plan above that. A 7-day free trial is offered. Confirm current tier details against the live pricing page before you commit.
8. Domo
Best for: Teams that want business-user-friendly embedded dashboards backed by broad data integration.
Key strengths
- 1000+ connectors: Pull data from a wide range of sources without custom integration work.
- Magic ETL and SQL dataflows: Prepare and transform data inside the platform.
- Embedded analytics and governance: Domo Everywhere with built-in security and governance tools.
Why choose Domo: Domo fits when your end users are business people, not data specialists, and you value breadth of connectors. Cards and Stories make analytics digestible for non-technical audiences. It works best for teams that want accessibility and integration over deep developer customization.
Domo pricing: Domo uses a consumption-based credit model. The pricing page does not list a public numeric starting price and directs visitors to contact sales for a quote. A free trial is available through the platform.
9. ThoughtSpot
Best for: Teams that want AI-native, search-first analytics that non-technical end users can explore freely.
Key strengths
- Natural-language search and Spotter: Users ask questions in plain language and get instant answers.
- Interactive dashboards and automated insights: Visual analytics paired with AI-surfaced findings.
- Embedded SDK and APIs: Visual Embed SDK and REST APIs for product-native embedding.
Why choose ThoughtSpot: ThoughtSpot fits when you want end users exploring data without learning a query language. The search-first model lowers the barrier to self-service analytics, which helps adoption among non-technical customers. It is a strong choice when AI-assisted discovery is central to your value proposition.
ThoughtSpot pricing: ThoughtSpot Essentials starts at $25 per user per month and Pro at $50 per user per month, both billed annually. Enterprise and Enterprise Embedded are custom-priced. A Developer plan is free for one year, which helps teams prototype an embedded build.
10. Qlik
Best for: Enterprise teams that need governed cloud analytics with strong data integration and assisted insight features.
Key strengths
- Interactive analytics and dashboards: The associative engine supports flexible, exploratory analysis.
- Gen AI insights and natural-language Q&A: Insight Advisor surfaces findings and answers questions.
- Predictive analytics and data prep: AutoML, reporting, automation, and data preparation in one platform.
Why choose Qlik: Qlik fits teams that want analytics and data integration from the same vendor, with enterprise governance built in. The associative engine enables exploration patterns that rigid query models cannot match. It works best when analytic depth and data workflows both matter.
Qlik pricing: Qlik Cloud Analytics offers four capacity-based plans: Starter at $300 per month, Standard at $825 per month, and Premium at $2,750 per month, all billed annually. Enterprise is quote-based. A free trial is available through the pricing page.
11. Amazon QuickSight
Best for: Teams already on AWS that want native BI with embedded analytics and pay-per-session economics.
Key strengths
- Interactive dashboards and reports: Visual analytics built for embedding into applications.
- SPICE engine: In-memory performance for fast queries at scale.
- Role-based access and SSO: Governed access control for secure multi-tenant embedding.
Why choose Amazon QuickSight: QuickSight fits AWS-native teams who want BI without leaving their cloud, plus the low per-reader pricing that suits large customer-facing audiences. It works best when your data already lives in AWS and pricing predictability for many readers is a priority.
QuickSight pricing: QuickSight lists Reader at $3 per user per month, Author at $24 per user per month, Reader Pro at $20, and Author Pro at $40, with Standard Edition at $12 monthly or $9 annually per user. Capacity pricing is also available. The low Reader price helps embedded use cases with many viewers.
12. Sigma
Best for: Teams on a modern cloud data warehouse who want live, spreadsheet-style analytics embedded in their product.
Key strengths
- Spreadsheet-style live analysis: Familiar interface that queries warehouse data directly.
- AI-assisted analysis and building: AI support for exploring and constructing analytics.
- Data apps, write-back, and embedding: Build interactive data experiences inside your product.
Why choose Sigma: Sigma fits teams whose data already lives in a cloud warehouse and who want analytics on live data without extraction. The spreadsheet interface meets business users where they are comfortable. It works best for modern data stack teams that value warehouse-native architecture.
Sigma pricing: Sigma does not publish numeric pricing on its site. Its documentation indicates license pricing is available through an account executive or customer success manager, so figures come through a sales conversation tied to your deployment.
13. Oracle Analytics
Best for: Enterprises needing governed self-service analytics, high-volume reporting, and AI-assisted insights at scale.
Key strengths
- 40 native connectors: Connect to a broad range of enterprise data sources out of the box.
- Embedded AI and machine learning: AI, generative AI, and ML built into analytics workflows.
- Oracle Analytics Publisher: High-volume, pixel-perfect reporting for governed environments.
Why choose Oracle Analytics: Oracle Analytics fits large organizations, especially those already on Oracle infrastructure, that need governed reporting at scale. The pixel-perfect reporting and enterprise governance suit regulated and high-volume environments. It works best when enterprise depth outweighs the need for lightweight, fast deployment.
Oracle Analytics pricing: Oracle lists Oracle Analytics Cloud pricing in both per-user and per-OCPU models, with Enterprise at 74,40 € per user per month and Professional at 14,88 € per user per month, plus bring-your-own-license options. Listed prices are in EUR; confirm regional pricing for your currency.
How to choose the right tool for your SaaS team
The list narrows fast once you map tools to your actual situation. Use these scenarios to shortlist two or three before running a proof of concept.
If you are an early-stage SaaS team shipping customer-facing analytics fast, prioritize embedding-first platforms with public pricing and quick setup. Luzmo is built around this exact job, and ThoughtSpot's free Developer year lets you prototype an embedded build without budget approval. Speed to a branded, white-label dashboard matters more than maximum configurability at this stage.
If you live in a specific cloud or software ecosystem, let that drive the choice. Microsoft shops get the lowest education burden from Power BI. Google Cloud teams gain native BigQuery integration and governed metrics with Looker. AWS-native teams get pay-per-reader economics and SPICE performance with Amazon QuickSight. Salesforce or Tableau organizations extend what they already run with Tableau Embedded Analytics.
If multi-tenant governance and metric consistency are your hard requirements, weigh GoodData's semantic layer and multi-tenant architecture against Looker's LookML modeling. Both define metrics once and serve many tenants consistently, which is what enterprise security reviews and large customer bases demand.
If your data already sits in a cloud warehouse, Sigma's warehouse-native, spreadsheet-style approach lets you analyze live data without extraction, and it fits the modern data stack cleanly.
If your end users are business people who need help interpreting data, Yellowfin's guided insights and ThoughtSpot's natural-language search both lower the barrier between a chart and a decision. Pairing these dashboards with user onboarding software helps non-technical users reach those insights faster.
The decision rarely comes down to one feature. Score your top candidates on the framework above, run a proof of concept with your real data and a real tenant, and weight pricing predictability heavily. The tool that wins the demo is not always the one that wins at scale. The same is true when you evaluate any platform via an interactive demo before committing budget.
Conclusion
Embedded analytics has become a baseline expectation for SaaS products, and the build-versus-buy math keeps tilting toward buy. Buying brings a first dashboard to market in four to eight weeks instead of the six to twelve months a custom build typically takes.
The right embedded analytics platform depends on your stack, your governance needs, and your pricing model more than on any single feature. Luzmo and ThoughtSpot suit teams optimizing for speed and self-service. Tableau, Power BI, Looker, and Amazon QuickSight reward ecosystem alignment. GoodData and Looker lead on multi-tenant governance and semantic consistency. Sigma fits the modern warehouse-native stack, and Oracle Analytics covers enterprise reporting at scale.
The criteria that should drive your decision are consistent: white-labeling depth, embedded analytics security, self-service experience, and pricing predictability across embedded dashboards at scale. Shortlist two or three tools that match your scenario, then run a proof of concept with your real data and a real multi-tenant setup before you commit. The proof of concept, not the sales demo, is where pricing predictability and governance reveal themselves. If product-led growth is part of your plan, our guide to digital adoption platforms pairs well with an embedded analytics strategy.
FAQs
Embedded analytics places dashboards, reports, and data exploration directly inside another software product, so users analyze data where they already work. It works by integrating an analytics platform into your application through iFrames, SDKs, web components, or APIs. The analytics vendor handles rendering and security, while your product controls where and how the analytics appear, often under your own brand.
Traditional business intelligence lives as a separate destination: users log into a standalone tool to view data disconnected from their workflow. Embedded analytics appears inside the product where users already are, in the context of the task at hand. The result is less context switching, higher adoption, and analytics that feel like part of your product rather than a separate system.
Embedded analytics increases product stickiness because customers return to view their own data, supports adoption by making value visible, and opens monetization through analytics tiers and add-ons. It also strengthens customer education by showing real results inside the product. Together, these reduce churn risk and make your value proposition concrete rather than claimed.
Evaluate white-labeling and brand control, embedded analytics security including SSO and row-level security, the self-service experience for end users, AI and augmented analytics capabilities, and the pricing and licensing model. For customer-facing rollouts, weight multi-tenant governance and pricing predictability heavily, since both determine whether the tool scales without surprises.
Yes, when the platform supports the right controls. Enterprise-grade embedded analytics uses single sign-on for authentication, role-based access control for permissions, row-level security so users see only their own records, and tenant isolation to separate customer accounts. Auditability rounds out the picture, giving security reviews the access logs they require. Confirm these capabilities and their availability per pricing tier during evaluation.
The best method depends on your priorities. iFrames offer the fastest path to live dashboards with minimal code. SDKs and web components give you deeper UI control and a product-native, branded experience. APIs and URL-based approaches handle provisioning, lifecycle automation, and dynamic behavior. Many teams combine methods, using iFrames to launch quickly and SDKs for the experiences that need full brand control.
Embedded analytics pricing varies widely by licensing model. Per-user pricing starts around $14 to $25 per user per month for tools like Power BI and ThoughtSpot, while capacity-based plans like Qlik start around $300 per month. Several embedded platforms, including GoodData, Looker, Sigma, and Domo, use quote-based or consumption pricing for embedded use cases. For wide customer-facing rollouts, capacity and per-reader models often scale more predictably than per-seat pricing.
There is no single best tool; the right choice depends on your scenario. Choose based on ecosystem fit (Power BI for Microsoft, Looker for Google Cloud, QuickSight for AWS, Tableau for Salesforce), governance needs (GoodData and Looker for multi-tenant and semantic consistency), white-label and speed requirements (Luzmo and ThoughtSpot), or warehouse-native architecture (Sigma). Shortlist two or three and validate them in a proof of concept with your real data.