

Most product teams track pageviews and signups, then wonder why users churn after the third session. The gap between "people visited" and "people got value" is where product analytics software lives.
What's inside
This guide covers 10 product analytics tools evaluated for real-world use by product teams, PMMs, and growth operators. You'll find a comparison table with pricing and G2 ratings, detailed breakdowns of each platform's strengths, and a framework for choosing the right tool based on your team's technical capabilities and goals.
We selected tools based on event tracking depth, segmentation flexibility, integration ecosystem, and how well they serve teams without dedicated data engineering resources.
TL;DR
- Amplitude leads for behavioral cohort analysis and enterprise-scale user journey mapping
- Mixpanel excels at funnel tracking and retention analysis for product-led growth teams
- PostHog offers open-source flexibility with self-hosting for data privacy requirements
- Heap reduces setup time with automatic event capture and retroactive analysis
- Product analytics differs from web analytics by focusing on in-product behavior rather than traffic sources
- The right tool depends on your technical resources, privacy requirements, and whether you prioritize speed of setup or depth of customization
What is product analytics software
Product analytics software tracks and analyzes user interactions within digital products like apps and websites - a market projected to reach $22.74 billion by 2030.
The goal is to improve user experience, increase engagement, and reduce churn by understanding what users actually do inside your product.
The distinction from traditional web analytics matters here. Google Analytics tells you how users found your site. Product analytics tools like Amplitude and Mixpanel tell you what users do after they arrive and whether they're getting value from your product.
Core capabilities of product analytics platforms
- Event tracking: Recording specific user actions like clicks, page views, feature usage, and logins
- Conversion funnels: Mapping user paths to identify where drop-offs occur in workflows
- Cohort analysis: Segmenting users by behavior or characteristics to track retention over time
- Session replay and heatmaps: Visualizing exactly how users interact with interface elements
- A/B testing and feature flags: Testing new features to measure impact on user behavior
How product analytics differs from web analytics
Web analytics platforms track traffic sources, pageviews, and basic conversion events. Product analytics tools track granular in-app behavior: which features users adopt, how long they spend in specific workflows, and what actions predict long-term retention.
If you're asking "where did our traffic come from?" web analytics answers that question. If you're asking "why do users churn after the third session?" you'll want product analytics.
When to use product analytics software
Tracking feature adoption and user engagement
Product teams launching new features often discover that "shipped" doesn't mean "adopted" - average core feature adoption is just 24.5%. Product analytics shows which features users actually engage with versus which ones sit unused. You can track adoption curves, compare engagement across user segments, and identify which features correlate with retention.
Measuring onboarding and activation
The gap between signup and activation is where most products lose users. Users who don't engage within the first three days face a 90% chance of churning. Product analytics helps identify exactly where new users drop off during onboarding flows. You can measure time-to-value, track completion rates for key activation milestones, and spot friction points that prevent users from reaching their first success moment.
Reducing churn with behavior insights
Customer success teams use cohort analysis and engagement scoring to identify at-risk users before they churn. By tracking which behaviors predict long-term retention, you can build early warning systems and intervene with targeted outreach or in-app guidance.
Product analytics tools comparison
1. Amplitude
Amplitude is the analytics platform of choice for teams that want deep behavioral analysis and user journey mapping at scale. The platform excels at cohort analysis, letting you segment users by any combination of behaviors and track how segments perform over time.
What sets Amplitude apart is its flexibility in defining custom events and properties without requiring engineering involvement for every change. You can build complex queries through a visual interface, compare user segments side by side, and identify which behaviors predict conversion or retention.
The platform also includes built-in experimentation tools, so you can run A/B tests and measure their impact on user behavior within the same system.
Best for: Enterprise product teams and growth operators who want sophisticated behavioral analysis and have the volume to justify the investment.
Key strengths
- Behavioral cohort analysis with flexible segmentation
- Custom event tracking with no-code chart building
- Experimentation and A/B testing built-in
- Strong integrations with data warehouses and CDPs
Amplitude pricing
Free Starter plan available with limited features. Growth and Enterprise tiers use custom pricing based on tracked users and event volume.
2. Mixpanel

Mixpanel focuses on funnel analysis and retention tracking, making it a strong fit for product-led growth teams that want to understand conversion paths. The platform's strength lies in its intuitive report builder, which lets you create funnels, retention curves, and flow analyses without SQL knowledge.
The real-time data processing means you can see how users respond to changes within minutes rather than waiting for batch processing. Mixpanel also offers strong mobile app analytics support, which makes it popular with teams building cross-platform products.
Best for: Growth teams at SaaS and mobile-first companies who prioritize funnel optimization and retention analysis.
Key strengths
- Intuitive funnel and retention reports
- Real-time data with flexible queries
- Strong mobile app analytics support
- Integration with major CDPs and data tools
Pricing
Free tier available with core features. Growth tier starts at usage-based pricing. Enterprise tier for larger deployments with advanced features.
3. PostHog
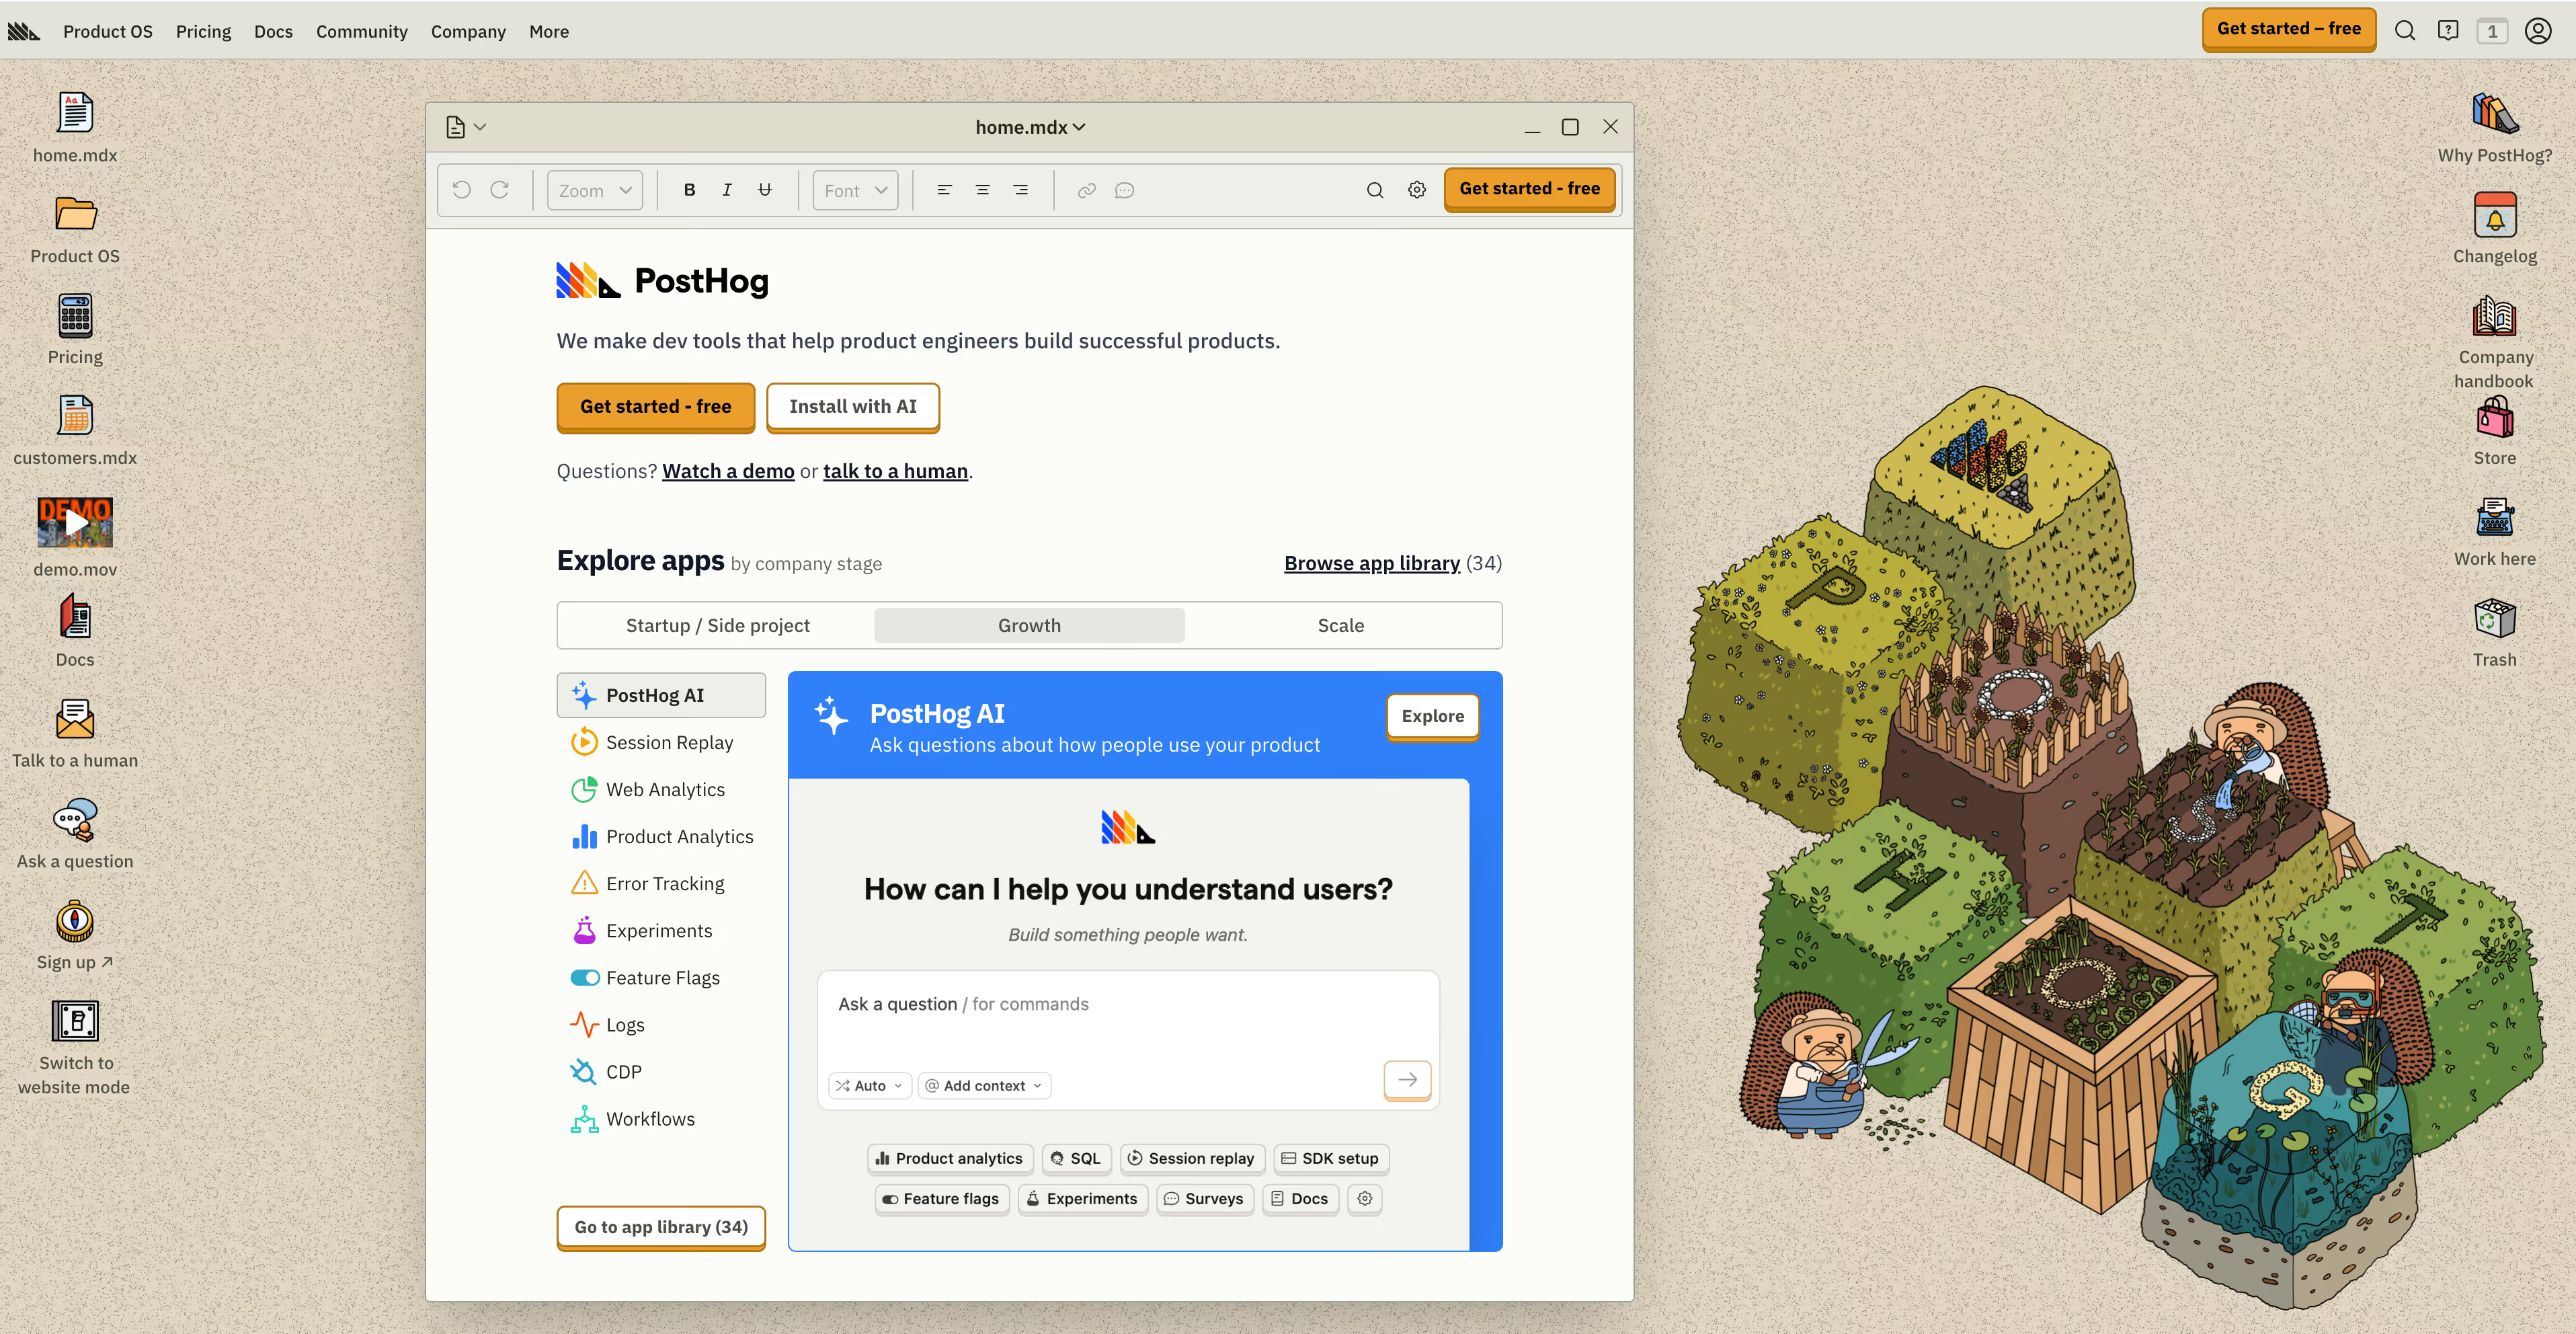
PostHog is an open-source product analytics platform that gives teams full control over their data. The self-hosting option appeals to organizations with strict data privacy requirements or those who want to avoid vendor lock-in.
Beyond analytics, PostHog bundles feature flags, session replay, and A/B testing into a single platform. The open-source model also means you can inspect the code, contribute improvements, and customize the platform for your specific use case.
Best for: Technical teams with data privacy requirements who want an all-in-one platform they can self-host and customize.
Key strengths
- Open-source with self-hosting option for full data control
- Feature flags and A/B testing included
- Session replay and heatmaps built-in
- No vendor lock-in with data portability
Pricing
Generous free tier for cloud-hosted version. Usage-based pricing for higher volumes. Self-hosted option available for teams with infrastructure resources.
4. Pendo

Pendo combines product analytics with in-app guidance, letting you both measure user behavior and act on insights within the same platform. The analytics side tracks feature adoption, user paths, and engagement patterns. The guidance side lets you create tooltips, walkthroughs, and announcements without engineering involvement.
This combination is particularly useful for product marketing teams who want to drive feature adoption. You can identify which users haven't discovered a key feature, then target them with in-app messages that guide them to it.
Best for: Product and PMM teams who want to combine analytics with in-app communication and don't want to manage separate tools for each.
Key strengths
- Product usage analytics with feature tagging
- In-app guides and walkthroughs for user education
- NPS and feedback collection built-in
- Roadmap prioritization based on usage data
Pricing
Custom pricing based on monthly active users. Free tier available for startups through the Pendo Free program.
5. Heap
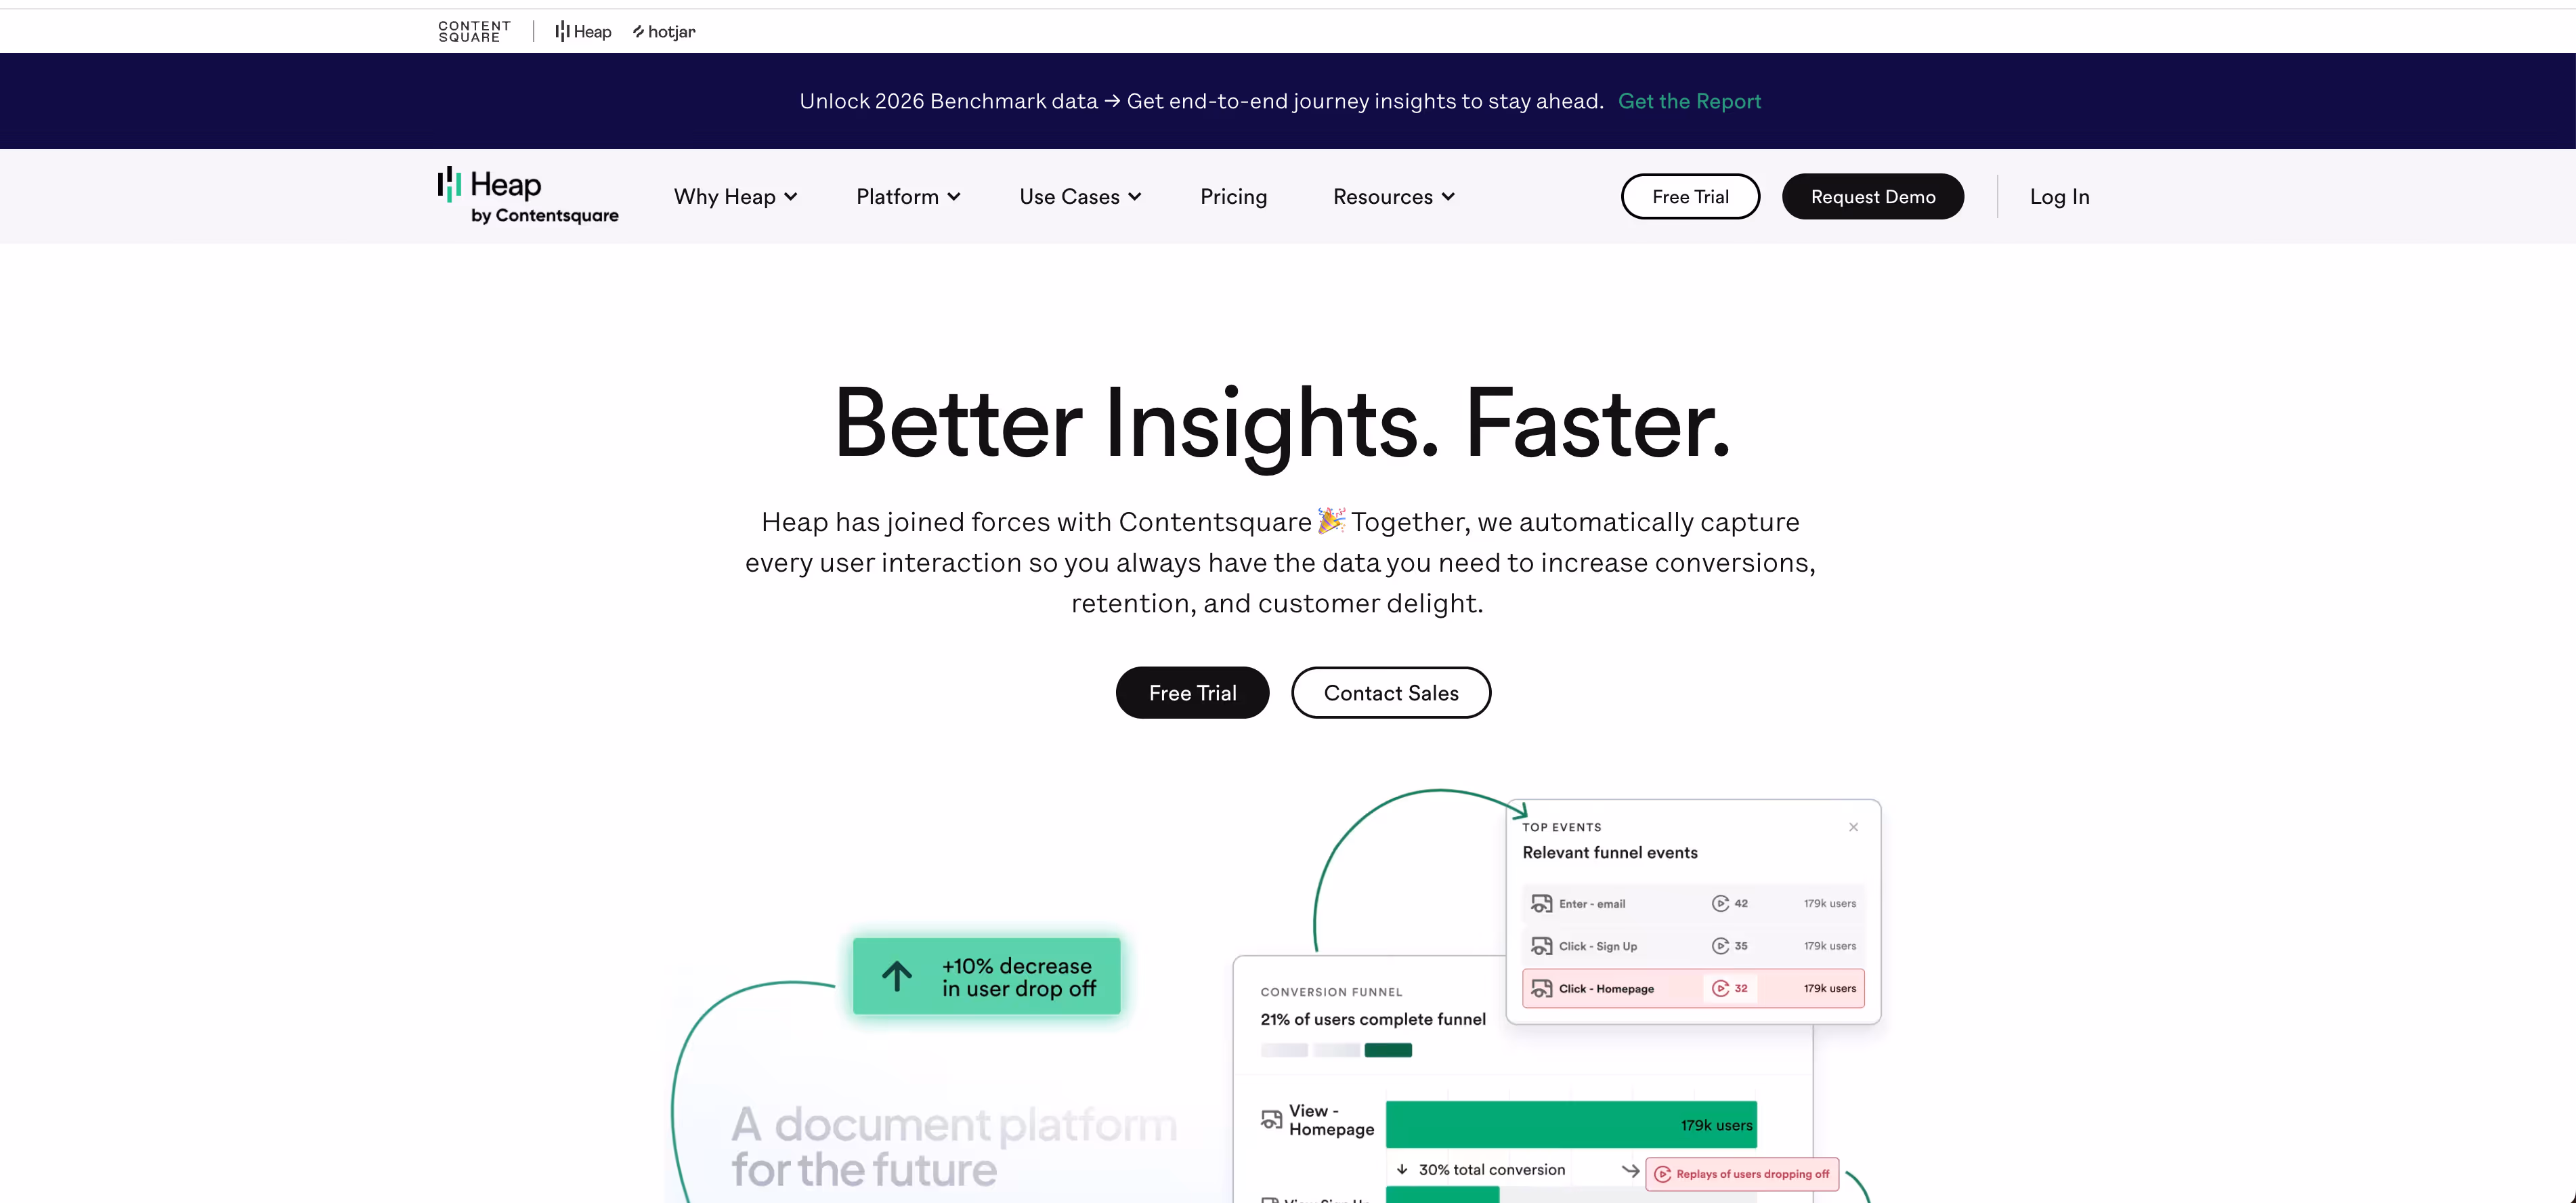
Heap takes a different approach to event tracking: it captures everything automatically. Instead of defining events upfront and waiting for engineering to implement them, Heap records all user interactions from the moment you install it.
This auto-capture model means you can analyze historical data retroactively. If you realize three months later that you want to track a specific button click, Heap already has that data. You define the event after the fact and see the full history.
The tradeoff is that auto-capture can create noisier data than carefully instrumented tracking. However, for teams with limited engineering resources or those who want to move fast without waiting for implementation, Heap removes a significant bottleneck.
Best for: Teams with limited engineering resources who want to start analyzing user behavior immediately without upfront instrumentation work.
Key strengths
- Auto-capture of all user interactions without code
- Retroactive analysis of historical data
- Session replay included
- Virtual events for no-code event definition
Pricing
Free tier available with limited features. Growth and Pro tiers with custom pricing based on session volume.
6. FullStory

FullStory focuses on session replay and digital experience analytics. While other tools tell you what users did through aggregated metrics, FullStory shows you exactly how they did it through video-like playback of individual sessions.
The platform automatically detects frustration signals like rage clicks, dead clicks, and error clicks. This helps you identify UX issues that might not show up in funnel metrics but still hurt the user experience.
Best for: UX teams and product managers who want to understand qualitative user experience issues and debug specific interaction problems.
Key strengths
- High-fidelity session replay with privacy controls
- Frustration signals detection (rage clicks, dead clicks)
- Heatmaps and click maps
- Integration with product analytics and support tools
Pricing
Custom pricing based on sessions captured. Enterprise plans available for larger deployments.
7. LogRocket

LogRocket combines session replay with error tracking and performance monitoring. This makes it particularly useful for teams who want to connect user experience issues with technical problems.
When a user reports a bug, LogRocket shows you exactly what they experienced, including console logs, network requests, and Redux state changes. This context dramatically reduces the time spent reproducing and debugging issues.
Best for: Engineering and product teams who want to debug user-reported issues and understand how technical performance affects user experience.
Key strengths
- Session replay with console and network logs
- Error tracking and performance monitoring
- Redux and state management integrations
- Issue prioritization based on user impact
Pricing
Free tier available with limited sessions. Team and Professional plans with usage-based pricing.
8. Hotjar

Hotjar combines heatmaps with user feedback collection, making it accessible for teams without deep analytics expertise. The visual nature of heatmaps makes it easy to communicate findings to stakeholders who might not engage with funnel charts or cohort tables.
The platform also includes on-site surveys and feedback widgets, so you can ask users directly about their experience. Setup is straightforward and doesn't require engineering involvement beyond adding a single script.
Best for: Marketing teams and smaller organizations who want visual analytics and user feedback without technical complexity.
Key strengths
- Heatmaps showing clicks, moves, and scroll depth
- On-site surveys and feedback widgets
- Session recordings with filtering
- Easy setup without developer involvement
Pricing
Free Basic plan available. Plus, Business, and Scale tiers with increasing features and session limits.
9. Userpilot

Userpilot ties product analytics directly to in-app engagement tools. You can track feature adoption, then immediately create targeted onboarding flows or announcements for users who haven't discovered key features.
The platform includes segmentation capabilities that let you target specific user groups with personalized experiences. You can create different onboarding paths for different personas or trigger contextual help based on user behavior.
Best for: Product marketing and growth teams focused on activation and adoption who want analytics tied directly to in-app intervention capabilities.
Key strengths
- Product analytics tied to in-app engagement tools
- Segmentation for targeted onboarding flows
- Feature adoption tracking and announcements
- NPS and micro-surveys built-in
Pricing
Starter, Growth, and Enterprise tiers based on monthly active users.
10. Google Analytics

Google Analytics remains the default starting point for many teams, especially with GA4's improved event-based tracking model. The platform is free for most use cases and integrates seamlessly with Google Ads and Search Console.
However, GA4 is primarily a web analytics tool rather than a product analytics platform. It excels at tracking traffic sources, marketing attribution, and basic conversion events. For deep in-product behavior analysis, feature adoption tracking, and cohort-based retention analysis, dedicated product analytics tools offer significantly more capability.
Best for: Teams that want free web analytics and basic event tracking, or those already invested in the Google ecosystem who want marketing attribution alongside basic product metrics.
Key strengths
- Free for most use cases with extensive documentation
- Event-based tracking in GA4
- Integration with Google Ads and Search Console
- Familiar interface for marketing teams
Pricing
Free for standard use. Analytics 360 for enterprise needs with custom pricing.
Why product analytics alone doesn’t provide full context
Modern product analytics tools give teams a superpower - the ability to measure user behavior, track feature adoption, and analyze funnels - but even with all the right metrics, teams often still can't quite piece together the full picture of what's going on.
The thing is, quantitative analytics tools are really good at telling you what's happening inside your product - but understanding why people behave a certain way is a whole different story, and usually requires some extra context to get right.
We see this with a lot of teams, who struggle with:
• Events that just don't give us enough insight into user behavior
• Instrumentation that's always lagging behind the product changes
• Trying to figure out whether the events we are seeing actually reflect what's really going on
• Friction points that we just can't seem to get a handle on with metrics alone
Which is why a lot of product teams end up using other tools that give us a view inside the product experience alongside the analytics data.
Tools like Guideflow take your analytics workflows and make them way more powerful by automatically capturing how users interact with your product. You don't have to rely on just tagging events or passive recordings anymore, and can actually see structured workflows, and figure out how users are using your product in a much more clear way.
By taking this layered approach, teams can connect the dots between what's happening with metrics and what's actually going on in the product. This means less ambiguity, and a lot faster insights.
How to evaluate product analytics tools
Data collection and event tracking flexibility
The choice between auto-capture (Heap) and manual instrumentation (Amplitude, Mixpanel) involves real tradeoffs:
- Auto-capture: Faster setup and retroactive analysis, but potentially noisier data
- Manual instrumentation: More upfront work but cleaner, more intentional tracking
Consider your team's engineering resources and how quickly you want to start analyzing data.
Segmentation and cohort analysis depth
Look for platforms that let you define segments based on any combination of user properties and behaviors. The ability to compare cohorts over time and track how different user groups progress through your product is essential for understanding retention drivers.
Integrations with CRM and data warehouse systems
Your analytics data becomes more valuable when it connects to your broader stack. Look for native integrations with tools like Salesforce, HubSpot, Snowflake, and BigQuery. Reverse ETL capabilities let you activate insights by pushing segments back to marketing and sales tools.
Privacy compliance and data governance
GDPR, CCPA, and data residency requirements affect which tools you can use and how. Self-hosting options (PostHog) give maximum control for privacy-sensitive organizations. Cloud-hosted platforms vary in their compliance certifications and data processing locations.
Scalability and pricing model
Pricing models vary significantly: some charge by tracked users, others by events, others by sessions. Estimate your likely usage growth and understand what triggers pricing increases. A tool that seems affordable at current scale might become expensive as you grow.
How product analytics connects to product education
Understanding where users struggle is only half the equation. The other half is helping users get past friction points.
Product analytics shows you that 40% of users drop off during onboarding step three. But what do you do with that insight? This is where interactive demos and guided experiences complement analytics data. Instead of hoping users figure things out on their own, you can create clickable walkthroughs that show them exactly how to complete key workflows.
Teams using Guideflow often pair their product analytics insights with interactive demos that address specific drop-off points. The demo engagement analytics then provide another layer of behavioral insight, showing which features users explore and where they spend time before converting.
Build data-informed product experiences
The right product analytics tool depends on your specific situation. If you have strong engineering resources and want deep customization, Amplitude or PostHog give you that flexibility. If you want to move fast without upfront instrumentation work, Heap's auto-capture removes that bottleneck. If you want analytics tied directly to in-app guidance, Pendo or Userpilot combine both capabilities.
Start by clarifying what questions you want to answer. Then match tool capabilities to those questions, considering your team's technical resources and privacy requirements.
Start your journey with Guideflow today!