
Your team collects more data than ever, but decisions still happen in spreadsheets and gut-feel meetings. The gap between having data and actually using it costs companies millions in missed opportunities and slow reactions.
Business intelligence software closes that gap by turning raw data into dashboards, reports, and insights that teams can act on without waiting for IT. This guide covers 15 BI tools worth evaluating in 2026, with honest breakdowns of what each does well, where they fall short, and how to pick the right one for your stack.
What's inside
This guide covers 15 business intelligence software tools worth evaluating in 2026. You'll find a clear definition of what BI software actually does, the key features that separate good tools from great ones, and a comparison table with pricing and ratings. Each tool gets an honest breakdown of strengths, ideal use cases, and what you'll pay.
TL;DR
- Business intelligence software collects, analyzes, and visualizes data to help teams make faster decisions
- Microsoft Power BI leads adoption for Microsoft ecosystem users, while Tableau remains the choice for advanced visualization
- Self-service BI fits smaller teams with limited IT resources; enterprise BI suits organizations with complex governance requirements
- Hidden costs like implementation, training, and infrastructure often exceed the sticker price
- AI capabilities are now standard across major platforms, including natural language queries and automated insights
- Data source compatibility matters more than feature count when choosing a tool
What is business intelligence software
Business intelligence software comprises tools and platforms in a $52.89 billion market that collect, analyze, and visualize data to aid organizational decision-making. BI applications transform raw data into actionable insights through dashboards, reports, and interactive data exploration interfaces.
Think of business intelligence software as the layer between your raw data and the decisions your team makes. Without it, you're stuck exporting spreadsheets, building manual reports, and hoping someone notices the trend before it's too late.
Core functions of BI software:
- Data integration: Connects to databases, spreadsheets, APIs, and cloud applications to pull information into one place
- Data visualization: Creates interactive dashboards, charts, graphs, and heatmaps that make patterns visible at a glance
- Reporting: Generates scheduled and ad-hoc reports for performance monitoring and stakeholder updates
- Self-service analytics: Enables non-technical users to query data without writing SQL or waiting on IT
Modern BI platforms also include AI-powered features like natural language processing, automated anomaly detection, and predictive analytics.
Why BI software matters for data-driven teams
The difference between teams with business intelligence software and teams without it shows up in speed and confidence. Similarly, sales teams with demo centers see 3.2x higher closure rates through better prospect engagement. Without BI, decisions rely on gut instinct, siloed spreadsheets, and delayed reports that arrive after the moment has passed.
With BI and product marketing software tools, marketing teams can see which campaigns drive revenue in real time. Sales leaders using presales software tools can spot pipeline problems before they become quarter-ending surprises. Operations can identify bottlenecks while there's still time to fix them.
Common applications across departments:
- Performance management: Track KPIs like revenue goals, sales quotas, and customer retention rates
- Marketing analysis: Monitor campaign performance, ROI, and customer engagement across channels using demand generation tools
- Financial reporting: Support budgeting, forecasting, and historical trend analysis
- Operational optimization: Identify process inefficiencies and resource allocation issues
What to look for when choosing BI software
Picking the right business intelligence software depends on your data environment, team capabilities, and how you plan to use insights. Here's what actually matters when evaluating options.
Data source compatibility and integrations
Your BI tool is only as useful as the data it can access. Check whether the platform connects natively to your databases, cloud applications, and data warehouses.
Some tools work better within specific ecosystems. Power BI integrates deeply with Microsoft products. Looker connects seamlessly with Google Cloud.
If your data lives in Snowflake or Databricks, verify the connector quality before committing.
Visualization and dashboard capabilities
The range of visualization options varies significantly between tools. Some offer basic charts and tables. Others provide complex interactive dashboards with drill-down capabilities, geographic mapping, and custom visualizations.
Look for drag-and-drop interfaces if your team includes non-technical users. Test how the tool handles large datasets, since performance often degrades with millions of rows.
Self-service features for non-technical users
Self-service BI lets business users create their own reports without waiting on IT or data teams. Key features to evaluate include natural language query support, guided report builders, and template libraries.
The goal is enabling a marketing manager to answer their own questions without filing a ticket.
AI and machine learning capabilities
AI features have become standard across major BI platforms:
- Natural language queries: Ask questions in plain English instead of writing SQL
- Automated insights: The system surfaces anomalies and trends without manual analysis
- Predictive analytics: Forecast future values based on historical patterns
- Smart recommendations: Suggested visualizations and next steps based on your data
The quality of AI features varies widely. Test them with your actual data before assuming they'll work as advertised.
Security, compliance, and governance
Enterprise buyers care deeply about security posture. Look for encryption at rest and in transit, role-based access controls, audit trails, and compliance certifications like SOC 2 and GDPR.
Data governance features matter too. Can you control who sees which data? Can you track data lineage? Can you enforce consistent metric definitions across the organization?
Collaboration and report sharing
BI insights are worthless if they stay locked in one person's dashboard. Evaluate how teams distribute findings: scheduled email reports, embedded dashboards, export options, commenting features, and mobile access. For teams focused on analytics ROI, see our guide to sales analytics software tools.
Some platforms support real-time collaboration on reports. Others treat sharing as an afterthought.
Pricing models and total cost of ownership
BI pricing models vary significantly:
- Per-user licensing: Pay for each person who accesses the platform
- Capacity-based: Pay based on data volume or compute resources
- Freemium: Free tier with paid upgrades for advanced features
The sticker price rarely tells the full story. Factor in implementation costs, training time, infrastructure requirements (for on-premise deployments), and ongoing administration.
Business intelligence tools comparison table
# | Tool | Best for | Key strength | Pricing | G2 rating |
|---|---|---|---|---|---|
1 | Microsoft Power BI | Microsoft ecosystem users | Deep Office 365 integration | Free to $20/user/month | 4.5/5 |
2 | Tableau | Advanced visualization needs | Industry-leading visual analytics | $15-75/user/month | 4.4/5 |
3 | Looker | Google Cloud organizations | Semantic layer for consistent metrics | Custom pricing | 4.4/5 |
4 | Qlik Sense | Ad-hoc data exploration | Associative data engine | Custom pricing | 4.5/5 |
5 | Sisense | Embedded analytics in products | Strong SDK for developers | Custom pricing | 4.3/5 |
6 | Domo | Fast multi-department deployment | Pre-built connectors (500+) | Custom pricing | 4.4/5 |
7 | Zoho Analytics | SMBs using Zoho products | Affordable with AI assistant | $24-455/month | 4.3/5 |
8 | Metabase | Developer-friendly simplicity | Open source with quick setup | Free to $85/user/month | 4.5/5 |
9 | Mode Analytics | Data teams that write code | SQL + Python + R in one place | Custom pricing | 4.2/5 |
10 | ThoughtSpot | Natural language search | Google-like search for data | Custom pricing | 4.4/5 |
11 | SAP BusinessObjects | SAP ERP environments | Deep SAP integration | Custom pricing | 4.0/5 |
12 | IBM Cognos Analytics | Enterprise governance needs | AI-powered data preparation | Custom pricing | 4.0/5 |
13 | Spotfire | Advanced statistical analysis | Predictive analytics built-in | Custom pricing | 4.2/5 |
14 | Yellowfin BI | Automated insight discovery | Proactive business monitoring | Custom pricing | 4.3/5 |
15 | Clear Analytics | Excel power users | Works within Excel interface | Custom pricing | 4.4/5 |
15 best business intelligence software tools
Each business intelligence software tool below gets an honest evaluation based on real-world use cases, not marketing claims. We've focused on what each platform does well and where it falls short.
1. Microsoft Power BI

Power BI is Microsoft's cloud-based BI platform focused on data visualization and real-time reporting. It integrates natively with Excel, Azure, Dynamics 365, and the broader Microsoft ecosystem.
Best for: Teams already using Microsoft 365, Azure, or Dynamics who want BI without adding another vendor.
Key strengths
- Native Microsoft integration: Pull data from Excel, SharePoint, and Azure with minimal configuration
- AI-driven analytics with Copilot: Natural language queries and automated insights powered by Microsoft's AI stack
- Strong mobile experience: Full-featured mobile apps for iOS and Android
- Large template ecosystem: Thousands of pre-built dashboards and community resources
Why choose Power BI
Power BI makes sense when your data already lives in Microsoft products. The integration depth means less time connecting sources and more time analyzing. The learning curve is gentler for Excel users since the interface feels familiar.
The downside: if you're not in the Microsoft ecosystem, you lose the main advantage.
Pricing: Free tier available. Pro costs $10/user/month. Premium starts at $20/user/month or $4,995/month for capacity-based licensing.
2. Tableau

Tableau built its reputation on visualization depth and flexibility. Now owned by Salesforce, it offers cloud-based (Tableau Cloud) and self-hosted (Tableau Server) deployment options.
Best for: Data analysts and teams that prioritize visual storytelling and complex exploratory analysis.
Key strengths
- Industry-leading visualization: More chart types and customization options than most competitors
- Strong community: Extensive learning resources, user groups, and public dashboards for inspiration
- Flexible deployment: Choose between cloud, on-premise, or hybrid based on your requirements in a market already seeing 65.87% of BI revenue from cloud deployments
- Handles large datasets: Performance remains solid with millions of rows
Why choose Tableau
Tableau excels when you want to explore data visually and tell stories with it. The drag-and-drop interface lets analysts iterate quickly. The visualization library handles everything from basic bar charts to complex geographic and statistical displays.
The tradeoff is cost and complexity. Tableau's pricing runs higher than Power BI, and the learning curve is steeper for casual users.
Pricing: Creator licenses run $75/user/month. Explorer costs $42/user/month. Viewer is $15/user/month. Annual billing required.
3. Looker
Looker, now part of Google Cloud, provides a semantic layer that ensures consistent metric definitions across your organization. It integrates AI capabilities via Google's Gemini.
Best for: Organizations on Google Cloud that want governed, consistent metrics across teams.
Key strengths
- LookML modeling language: Define metrics once and use them everywhere, eliminating conflicting numbers
- Deep Google Cloud integration: Native connections to BigQuery, Google Sheets, and other Google services
- Strong embedded analytics: Build analytics into your own products with robust APIs
- Git-based version control: Manage data models like code with branching and pull requests
Why choose Looker
Looker solves the "whose numbers are right" problem. When marketing says revenue is $10M and finance says it's $9.5M, LookML ensures everyone uses the same calculation.
The downside is complexity. LookML requires learning a new modeling language. Implementation takes longer than simpler tools.
Pricing: Custom enterprise pricing. Contact Google Cloud sales for quotes.
4. Qlik Sense

Qlik Sense differentiates through its associative engine, which lets users explore data relationships without predefined queries or hierarchies.
Best for: Teams that want to discover unexpected patterns and explore data without knowing what questions to ask first.
Key strengths
- Associative data engine: Click any data point and instantly see related information across all connected sources
- Augmented analytics: AI suggests insights and highlights anomalies automatically
- Strong data preparation: Built-in tools for cleaning and transforming data before analysis
- Hybrid deployment: Cloud, on-premise, or both
Why choose Qlik Sense
Qlik's associative model works differently than traditional BI. Instead of following predefined drill paths, you can click anywhere and see connections. This approach surfaces insights that structured dashboards might miss.
The learning curve is real, though. Users accustomed to traditional BI tools take time to adjust.
Pricing: SaaS and on-premise options available. Contact Qlik for pricing based on your deployment model.
5. Sisense

Sisense focuses on embedded analytics, helping SaaS companies build BI capabilities directly into their products.
Best for: Product teams building analytics features into their own software applications.
Key strengths
- Strong embedded analytics SDK: Comprehensive tools for developers building analytics into products
- Handles complex data models: Performs well with large, multi-source datasets
- AI-powered analytics assistant: Natural language queries and automated insights
- White-labeling: Fully customize the look and feel for your brand
Why choose Sisense
Sisense makes sense when you're building analytics into a product rather than just using it internally. The embedded SDK is more mature than most competitors.
For internal BI use cases, Sisense works but isn't the obvious choice.
Pricing: Custom pricing based on deployment and usage. Contact sales for quotes.
6. Domo

Domo is a cloud-native platform built for rapid deployment across multiple departments. It emphasizes speed to value over deep customization.
Best for: Organizations wanting fast time-to-value across multiple departments without lengthy implementation.
Key strengths
- Pre-built connectors: Over 500 native integrations with common business applications
- Mobile-first design: Full functionality on mobile devices, not just a scaled-down version
- Real-time data updates: Live connections to data sources without manual refreshes
- Collaboration features: Built-in chat, alerts, and sharing within the platform
Why choose Domo
Domo prioritizes getting started quickly. The connector library means you can pull data from most SaaS tools without custom development. The mobile experience is genuinely useful, not an afterthought.
The tradeoff is depth. Power users may find Domo limiting compared to Tableau or Power BI.
Pricing: Per-user pricing across multiple tiers. Contact Domo for specific quotes.
7. Zoho Analytics

Zoho Analytics is a self-service BI tool that integrates tightly with Zoho's broader business suite. It offers AI-powered analysis through its Zia assistant.
Best for: Small to mid-size businesses already using Zoho products who want affordable BI.
Key strengths
- Affordable pricing: Significantly cheaper than enterprise alternatives
- Zia AI assistant: Natural language queries and automated insights
- Zoho ecosystem integration: Seamless connection to Zoho CRM, Projects, and other Zoho apps
- White-labeling: Agencies can rebrand for client use
Why choose Zoho Analytics
Zoho Analytics delivers solid BI capabilities at a fraction of enterprise pricing. If you're already in the Zoho ecosystem, the integration is seamless.
The limitations show up at scale. Performance degrades with very large datasets.
Pricing: Basic plan starts at $24/month for 2 users. Standard is $48/month. Premium is $115/month. Enterprise is $455/month.
8. Metabase

Metabase is an open-source BI tool known for simplicity and quick setup. It's popular with startups and technical teams who want control without enterprise complexity.
Best for: Technical teams wanting a lightweight, developer-friendly option they can self-host.
Key strengths
- Open source: Free self-hosted option with full source code access
- Simple, clean interface: Minimal learning curve for basic use cases
- Quick deployment: Get running in minutes, not weeks
- SQL and no-code options: Write queries directly or use the visual query builder
Why choose Metabase
Metabase removes the barriers to getting started with BI. The open-source version is genuinely free and capable. The interface is clean enough that non-technical users can create basic reports.
Enterprise features like SSO and permissions require the paid version. And you'll want technical resources to self-host.
Pricing: Open source is free. Pro (cloud-hosted) is $85/user/month. Enterprise pricing is custom.
9. Mode Analytics

Mode combines SQL, Python, and R in one platform for technical analysts who write code but want to share results with business stakeholders.
Best for: Data teams that write code and want collaboration features for sharing with non-technical users.
Key strengths
- SQL + Python + R: Write analysis in your preferred language within one environment
- Collaboration for data teams: Share queries, notebooks, and reports with version history
- Version control: Track changes to analyses over time
- Business-friendly reports: Transform code-based analysis into polished reports for stakeholders
Why choose Mode
Mode connects data teams who write code with business users who want insights. Analysts can work in SQL or Python, then publish results in a format executives can understand.
Mode assumes users are comfortable with SQL at minimum. It's not a self-service tool for business users.
Pricing: Free tier available for individuals. Team and Enterprise pricing is custom.
10. ThoughtSpot

ThoughtSpot built its platform around search-driven analytics. Users ask questions in natural language and get instant answers, similar to using a search engine.
Best for: Organizations wanting non-technical users to self-serve without learning dashboard tools.
Key strengths
- Natural language search: Type questions in plain English and get visualized answers
- AI-powered automated insights: SpotIQ surfaces anomalies and trends automatically
- Strong embedded analytics: Build search-driven analytics into your own products
- Anomaly detection: Automatic alerts when data deviates from expected patterns
Why choose ThoughtSpot
ThoughtSpot removes the dashboard paradigm entirely. Instead of navigating pre-built reports, users just ask questions. This approach dramatically lowers the barrier for non-technical users.
Power users may find the search interface limiting for complex analysis.
Pricing: Enterprise pricing. Contact ThoughtSpot for quotes.
11. SAP BusinessObjects

SAP BusinessObjects is an enterprise BI suite with deep integration into SAP's ERP and data management products.
Best for: Large enterprises running SAP ERP systems who want integrated analytics.
Key strengths
- Deep SAP integration: Native connections to SAP S/4HANA, BW, and other SAP products
- Comprehensive enterprise reporting: Full suite of reporting, analysis, and dashboard tools
- Strong security and governance: Enterprise-grade access controls and audit capabilities
- Mature, stable platform: Decades of enterprise deployment experience
Why choose SAP BusinessObjects
BusinessObjects makes sense when SAP is your core business system. The integration depth means less custom development and more reliable data connections.
Outside the SAP ecosystem, BusinessObjects loses its advantage. The interface feels dated compared to modern tools.
Pricing: Enterprise licensing. Contact SAP for quotes.
12. IBM Cognos Analytics

IBM Cognos Analytics is an enterprise BI platform with AI-assisted data preparation and exploration capabilities.
Best for: Large organizations prioritizing governance, auditability, and enterprise-grade security.
Key strengths
- AI-powered data preparation: Automated suggestions for data cleaning and transformation
- Strong governance and security: Comprehensive access controls, audit trails, and compliance features
- Comprehensive reporting suite: Full range of reporting options from ad-hoc to scheduled distribution
- Natural language queries: Ask questions in plain English
Why choose IBM Cognos
Cognos fits organizations where governance and auditability are non-negotiable. The platform handles complex enterprise requirements that simpler tools can't address.
Implementation takes months, not days. The interface isn't as intuitive as modern alternatives.
Pricing: Enterprise pricing. Contact IBM for quotes.
13. Spotfire

Spotfire, from TIBCO, focuses on advanced analytics with strong statistical and predictive capabilities.
Best for: Technical users doing advanced statistical analysis or predictive modeling.
Key strengths
- Advanced statistical functions: Built-in statistical analysis beyond basic BI
- Predictive analytics: Machine learning models integrated into the platform
- Data science integration: Connect to R and Python for custom analysis
- Streaming data support: Handle real-time data feeds
Why choose Spotfire
Spotfire serves users who want more than visualization. If your analysis involves statistical modeling, predictive algorithms, or streaming data, Spotfire handles it natively.
For standard reporting and dashboards, Spotfire is overkill.
Pricing: Per-user enterprise pricing. Contact TIBCO for quotes.
14. Yellowfin BI
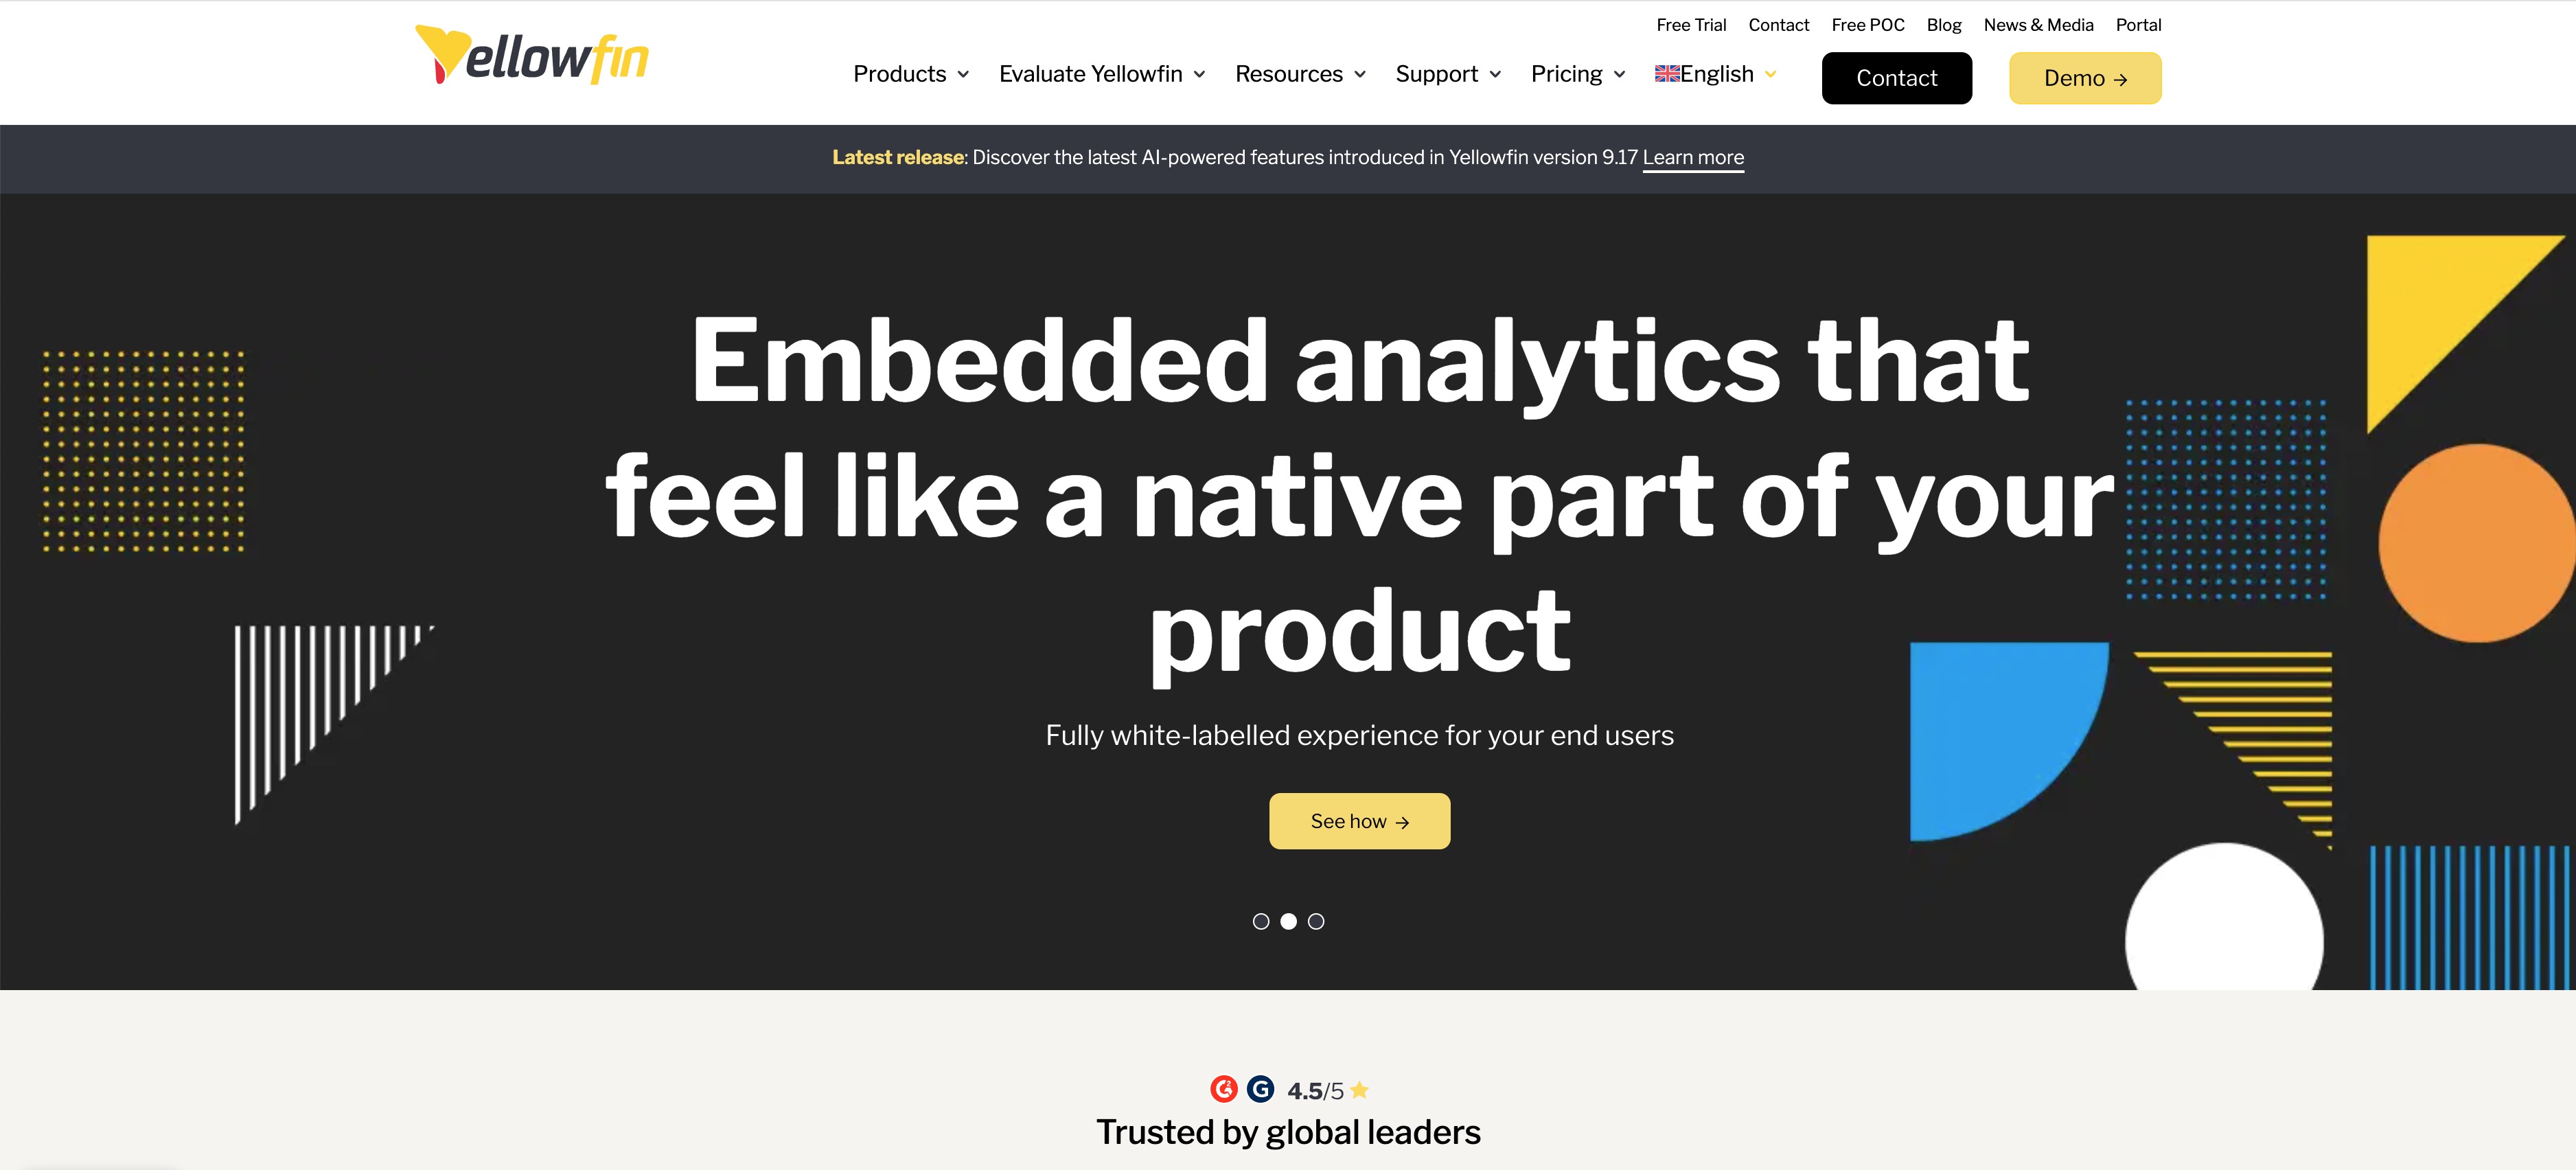
Yellowfin emphasizes automated insights and collaborative analytics, proactively surfacing information rather than waiting for users to ask.
Best for: Teams wanting the platform to proactively surface insights rather than just display dashboards.
Key strengths
- Automated business monitoring: Signals feature alerts users to important changes automatically
- Collaboration and storytelling: Build narrative reports that combine data with context
- Embedded analytics: White-label analytics for your own products
- Broadcast reporting: Scheduled distribution of reports and dashboards
Why choose Yellowfin
Yellowfin's automated monitoring sets it apart. Instead of checking dashboards manually, users receive alerts when something important changes.
The platform is less well-known than major competitors, which means smaller community and fewer third-party resources.
Pricing: Per-user pricing. Contact Yellowfin for specific quotes.
15. Clear Analytics
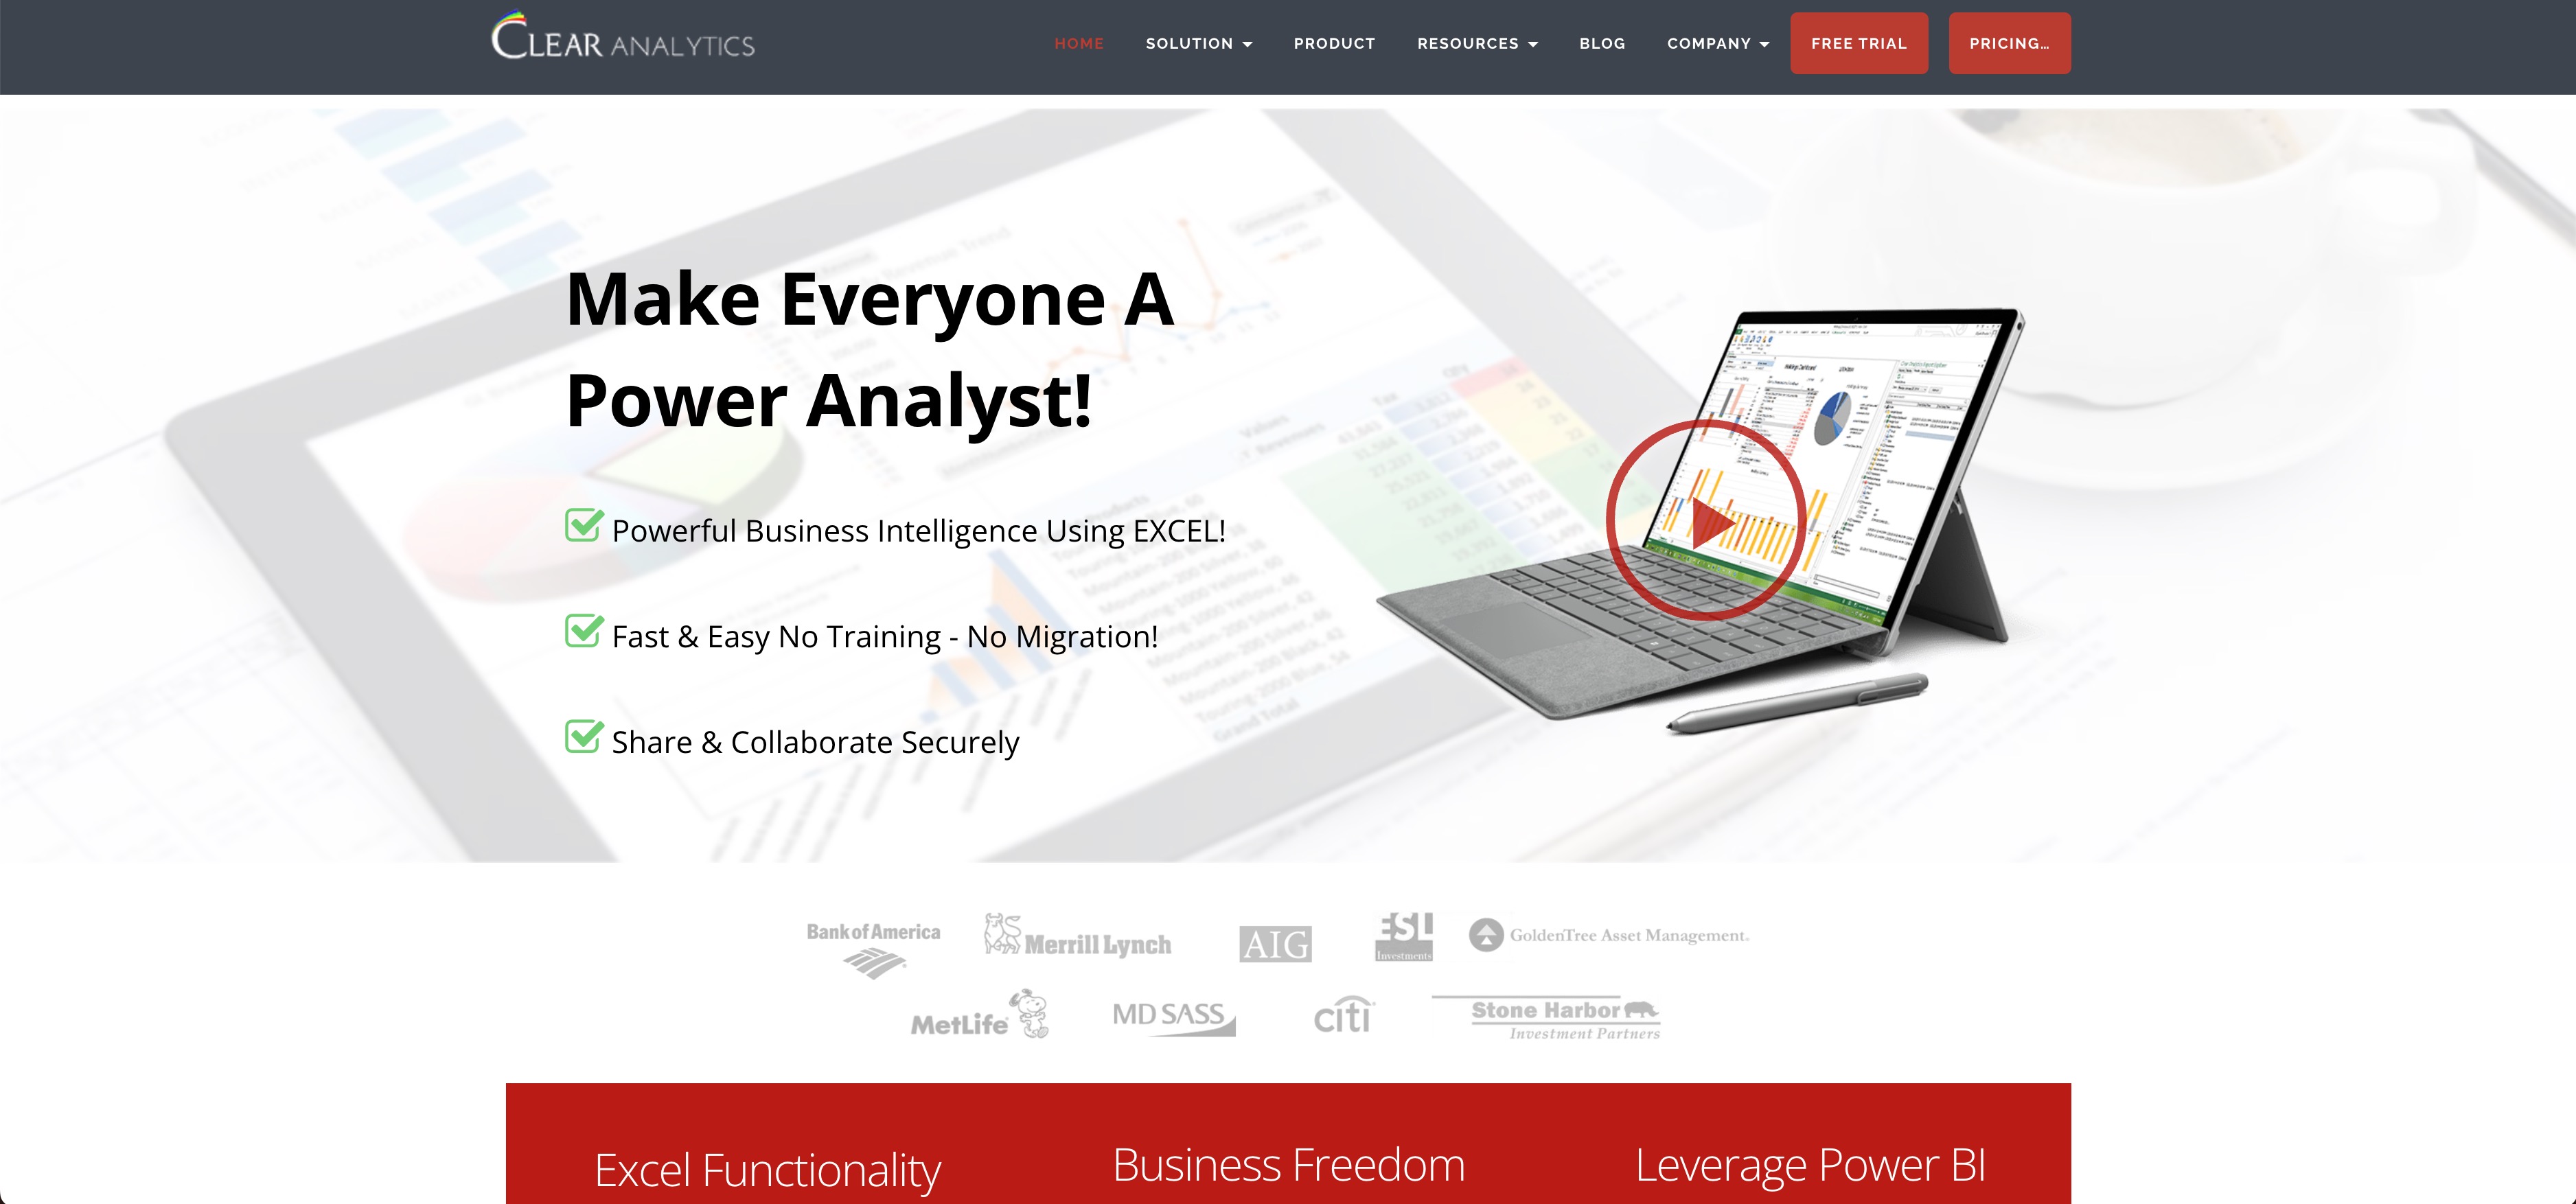
Clear Analytics takes a different approach by working within Excel rather than replacing it. Users build dashboards without leaving their familiar spreadsheet environment.
Best for: Excel power users who resist adopting new interfaces but want better data access.
Key strengths
- Works within Excel: No new interface to learn for spreadsheet users
- Low learning curve: Familiar environment reduces training time
- Connects to enterprise data: Pull from databases and data warehouses into Excel
- Self-service for Excel users: Business users can build reports without IT help
Why choose Clear Analytics
Clear Analytics solves the adoption problem. If your team lives in Excel and resists new tools, this approach meets them where they are.
The limitation is obvious: you're still in Excel. Advanced visualization, collaboration, and governance features are limited compared to purpose-built BI platforms.
Pricing: Per-user licensing. Contact Clear Analytics for quotes.
Self-service BI vs enterprise BI platforms
The business intelligence software market splits into two broad categories, and choosing the wrong one wastes money and time.
Self-service BI platforms are designed for business users to create their own reports in a $7.99 billion market without IT involvement. They prioritize ease of use, quick setup, and low technical barriers. Examples include Power BI, Metabase, and Zoho Analytics.
Enterprise BI platforms are designed for IT-managed, governed deployments at scale. They prioritize security, compliance, consistent metrics, and integration with complex data environments. Examples include SAP BusinessObjects, IBM Cognos, and Looker.
When self-service BI fits your team
Self-service BI works well in specific situations:
- Small to mid-size teams with limited IT resources and no dedicated BI staff
- Business users comfortable exploring data and creating their own visualizations
- Fast-moving environments where waiting for IT to build reports creates bottlenecks
- Budget constraints that favor lower per-user costs over enterprise features
The risk with self-service BI is inconsistency. When everyone builds their own reports, you end up with conflicting numbers and no single source of truth.
When enterprise BI is the better investment
Enterprise BI makes sense when:
- Large organizations have complex data governance requirements and multiple departments
- Regulated industries require audit trails, compliance certifications, and strict access controls
- Multiple teams require consistent metric definitions across the organization
- Heavy integration with existing enterprise systems like SAP or Oracle is required
The tradeoff is speed and cost. Enterprise BI implementations take months and require dedicated resources.
How to evaluate BI software before you buy
The demo always looks great. The real test comes when you use the tool with your actual data and workflows.
Run a proof of concept with real data
Demo datasets are designed to make the tool look good. Your data is messy, incomplete, and structured differently. Test with actual company data to see how the tool handles data connection complexity, performance with your data volumes, data preparation requirements, and visualization of your specific metrics.
A two-week proof of concept with real data reveals more than months of vendor presentations.
Test with multiple user types across departments
The analyst who evaluates the tool is rarely the only user. Include power users who will build complex reports, business users who will consume dashboards, executives who want high-level summaries, and occasional users who check reports monthly.
Each group has different tolerance for complexity.
Assess vendor support and documentation quality
Support quality varies dramatically between vendors. Check community forums to see if questions get answered quickly. Review documentation for comprehensiveness.
Test support response by submitting a pre-sales question. Ask about SLAs for your pricing tier.
Calculate the true total cost of ownership
The license fee is just the beginning. Factor in implementation and configuration, training and onboarding, infrastructure costs, additional connectors, ongoing administration, and opportunity cost during the transition period.
How to choose the right BI tool for your team
After evaluating options, the decision often comes down to matching your situation to the right tool category:
- If you're in the Microsoft ecosystem: Start with Power BI
- If visualization depth matters most: Evaluate Tableau
- If metric consistency across teams is critical: Consider Looker
- If you want open source flexibility: Try Metabase
- If non-technical users want to self-serve: Look at ThoughtSpot or Domo
- If you're building analytics into a product: Evaluate Sisense
One final consideration: BI insights only create value when teams act on them. The best dashboard in the world is worthless if stakeholders don't understand what it means for their work.
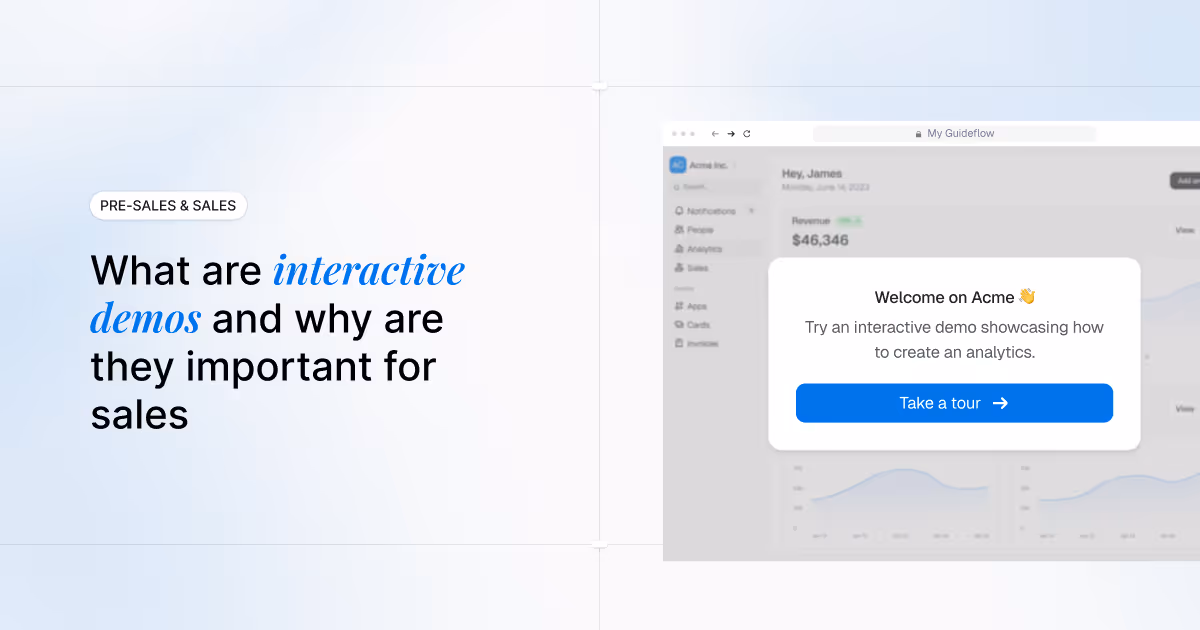
Live demos can bridge this gap by showing exactly how data translates into action. Tools like Guideflow help teams turn data insights into action by creating interactive demos that show stakeholders exactly what the data means for their workflows.
Start your journey with Guideflow today!
FAQs about business intelligence software
What is the most popular business intelligence software?
Microsoft Power BI leads in market adoption at 23.07% share, primarily due to its integration with Microsoft products and accessible pricing. Tableau remains the preferred choice for organizations prioritizing advanced visualization capabilities. The "most popular" depends on your segment: Power BI dominates mid-market, while Tableau and Looker are more common in enterprise data teams.
How much does business intelligence software typically cost?
Pricing ranges from free (Metabase open source, Power BI free tier) to hundreds of dollars per user monthly for enterprise platforms. Most mid-market tools charge $10-75 per user per month. However, license costs often represent only a portion of total cost of ownership when you factor in implementation, training, and infrastructure.
Can non-technical users work with BI tools without knowing SQL?
Yes, most modern BI tools offer drag-and-drop interfaces and natural language query features designed for business users. Power BI, Tableau, and Domo all provide visual query builders that require no SQL knowledge. ThoughtSpot takes this further with search-driven analytics where users type questions in plain English.
What is the difference between BI software and data analytics platforms?
BI software focuses on reporting and visualization of historical and current data, answering "what happened" and "what is happening now." Data analytics platforms often include more advanced statistical modeling, machine learning, and predictive capabilities, answering "what will happen" and "why did it happen." Tools like Spotfire blur this line by including both.
How long does business intelligence software implementation take?
Implementation timelines vary dramatically. Cloud-based self-service tools like Metabase or Zoho Analytics can be running in days. Mid-market platforms like Power BI or Tableau typically take 4-8 weeks for a proper deployment.
Enterprise platforms like SAP BusinessObjects or IBM Cognos often require 3-6 months for full implementation with data warehouse integration.
Do organizations need a data warehouse before using BI software?
Not necessarily. Many modern BI tools connect directly to operational databases, spreadsheets, and cloud applications.
However, a data warehouse improves performance and consistency for larger deployments. If you're querying millions of rows or combining data from many sources, a warehouse becomes practically necessary.
What size company benefits from business intelligence software?
Organizations of any size can benefit, though the right tool varies significantly. Startups often start with free or open-source options like Metabase.
Mid-size companies typically use Power BI, Tableau, or Domo. Enterprises with complex governance requirements invest in platforms like Looker, SAP BusinessObjects, or IBM Cognos.
Can business intelligence software replace spreadsheets entirely?
BI software complements rather than replaces spreadsheets. Spreadsheets remain useful for ad-hoc calculations, small datasets, and quick analysis.
BI tools handle larger datasets, automated reporting, cross-functional visibility, and consistent metrics. Most organizations use both: spreadsheets for individual work, BI for shared reporting.