Your signup flow broke at 2 a.m. on a Tuesday. Support heard about it first, from three separate tickets by 9 a.m. Engineering traced it to a dependency update pushed the evening before. The homepage returned 200 the whole time.
That gap, between "the page loads" and "the customer can actually complete the task," is exactly what most uptime checkers miss. A 200 response code does not prove a user can sign up, authenticate, pay, or reach the first meaningful moment in your product. The website monitoring software market reflects how seriously teams are taking this distinction: It was valued at $2.68 billion in 2025 and is projected to reach $6.09 billion by 2034, according to The Insight Partners (2026). The financial stakes are real too. Uptime Institute's 2025 outage survey found that 54% of respondents said their most recent significant outage cost more than $100,000.
The right monitoring platform catches availability failures and product-journey failures before they turn into churn, support volume, or lost activation.
What's inside
This guide is for product managers and SaaS operators who need to protect customer-facing workflows tied to activation, retention, and revenue. Ten tools are reviewed across uptime monitoring, synthetic journey testing, performance analytics, and full-stack observability.
- Who it's for: PMs, SRE teams, and startup operators choosing monitoring coverage
- Selection criteria: Monitoring depth, alert routing, diagnostic evidence, integration fit, and pricing model
- PM lens: Protect the workflows your activation and conversion metrics depend on
- Key question answered: When does lightweight uptime monitoring stop being enough?
TL;DR
- Best for focused uptime monitoring: UptimeRobot covers HTTP, SSL, DNS, and port checks with a free tier and broad alerting, starting at $0/month
- Best broad monitoring on a predictable budget: Site24x7 connects website uptime to synthetic transactions, real user monitoring, and infrastructure from $9/month billed annually
- Best for full-stack observability: Datadog correlates browser signals with logs, traces, and infrastructure metrics for engineering-mature teams
- Best for synthetic browser journey testing: Uptrends runs real-browser user-journey checks with screenshots and waterfall diagnostics from $42/month
- Best for enterprise digital experience monitoring: Dynatrace combines AI-assisted anomaly detection with deep application and infrastructure topology
What is website monitoring software?
Website monitoring software continuously checks whether a website, web application, API, or critical user journey is available, fast, and functioning as expected.
The category spans several monitoring types, each catching a different failure mode:
Core monitoring types
- Uptime monitoring: Confirms whether a URL, server, or endpoint responds at all. The starting point, not the finish line.
- Website performance monitoring: Tracks response time, page load speed, and regression against baseline. A page can be "up" while loading in eight seconds.
- Synthetic monitoring: Runs scripted tests that mimic customer actions, covering login, signup, checkout, form submission, and other multi-step flows. This is how you catch the 2 a.m. Tuesday problem before users do.
- Real user monitoring (RUM): Measures performance as actual visitors experience it, segmented by device, region, browser, and connection.
- API monitoring: Tests endpoint availability, authentication, response payloads, and latency on a schedule.
- SSL and DNS monitoring: Alerts on certificate expiry and domain-resolution failures before they knock services offline.
- Status pages and incident communication: Keeps customers and internal teams informed during active incidents with a shared, authoritative source of truth.
Key features to evaluate
- Multi-region checks to eliminate false positives from single-location failures
- Browser-based tests for high-value user flows, not just HTTP pings
- Alert routing to PagerDuty, Slack, OpsGenie, or your incident channel of choice
- Dashboards that separate the symptom (page slow) from the cause (database latency spike)
- Historical data for post-release reviews and reliability planning
- Role-based access so product, engineering, and support teams each see what matters to them
| Monitoring type | What it catches |
|---|---|
| Uptime | Complete unavailability |
| Performance | Speed regressions, degraded experience |
| Synthetic | Broken user workflows, form failures, broken flows |
| Real user monitoring | Actual visitor experience by segment |
| API | Endpoint failures, auth errors, payload issues |
| SSL / DNS | Certificate expiry, domain resolution failures |
When to use website monitoring software
Protect activation and conversion flows
Start monitoring the workflows your activation metrics depend on: Signup, authentication, invitation acceptance, payment, workspace creation, and the first action that delivers value. A PM who tracks 30-day retention but not the login flow is flying with instruments missing. Each monitored journey maps directly to a metric your roadmap is supposed to move.
Detect release regressions before support does
Teams shipping daily need automated synthetic checks before release, immediately after deployment, and at regular intervals afterward. Screenshots, waterfall data, and step-level error context shorten the distance between "something broke" and "here is exactly where it broke." That shortcut matters when engineering triage competes with the next sprint's planned work.
Coordinate incidents across product, support, and engineering
Alert routing, escalation policies, and public status pages give product, support, and engineering a shared picture during incidents. A PM needs to know whether an issue is confirmed, still active, and contained before deciding whether to post to customers. A monitoring dashboard that siloes data inside one team slows that decision down.
| Customer journey | Recommended check frequency |
|---|---|
| Authentication / login | Every 1 to 5 minutes |
| Payment / billing | Every 1 to 5 minutes |
| Signup / account creation | Every 5 minutes |
| Core activation workflow | Every 5 to 15 minutes |
| Lower-traffic content pages | Every 30 to 60 minutes |
Website monitoring software comparison
A focused uptime tool can be the right purchase when the main risk is public-site downtime and the team's operational overhead is low. A broader platform becomes necessary when you need browser journeys, traces, logs, or infrastructure context to understand what actually broke and who was affected.
| # | Product | Best for | Key differentiator | Pricing | G2 rating |
|---|---|---|---|---|---|
| 1 | UptimeRobot | Affordable uptime and endpoint monitoring | HTTP, SSL, DNS, and port checks with a free tier | Free; paid from $13/month | 4.7/5 |
| 2 | Site24x7 | All-in-one website and infrastructure monitoring | Synthetic, RUM, and infrastructure in one platform | From $9/month (annual) | 4.6/5 |
| 3 | Datadog | Full-stack observability | Correlates website signals with logs, traces, infrastructure | Usage-based; from $0.10/GB | 4.4/5 |
| 4 | New Relic | Browser-to-backend visibility | Browser monitoring plus application observability | Free tier; paid from $10/user/month | 4.4/5 |
| 5 | Uptrends | Synthetic browser journey testing | Real-browser checks with screenshots and waterfall data | From $42/month (annual) | 4.1/5 |
| 6 | Dotcom-Monitor | Multi-location transaction testing | Browser scripting with detailed waterfall diagnostics | Free; paid from $19.99/month | 4.5/5 |
| 7 | LogicMonitor | Hybrid infrastructure and operations teams | AI-assisted observability across cloud and on-premises | From $16/Hybrid Unit/month | 4.5/5 |
| 8 | Dynatrace | Enterprise digital experience monitoring | AI-powered full-stack observability with topology mapping | Consumption-based; from $0.001/invocation | 4.5/5 |
| 9 | Sentry | Engineering teams focused on application errors | Error monitoring connected to traces and release health | Free tier available; contact for team plan pricing | 4.5/5 |
| 10 | Sematext | Modular observability on a flexible budget | Mix-and-match logs, metrics, experience, and synthetics | From $1.68/host/month | 4.7/5 |
Best 10 website monitoring software tools for 2026
1. UptimeRobot
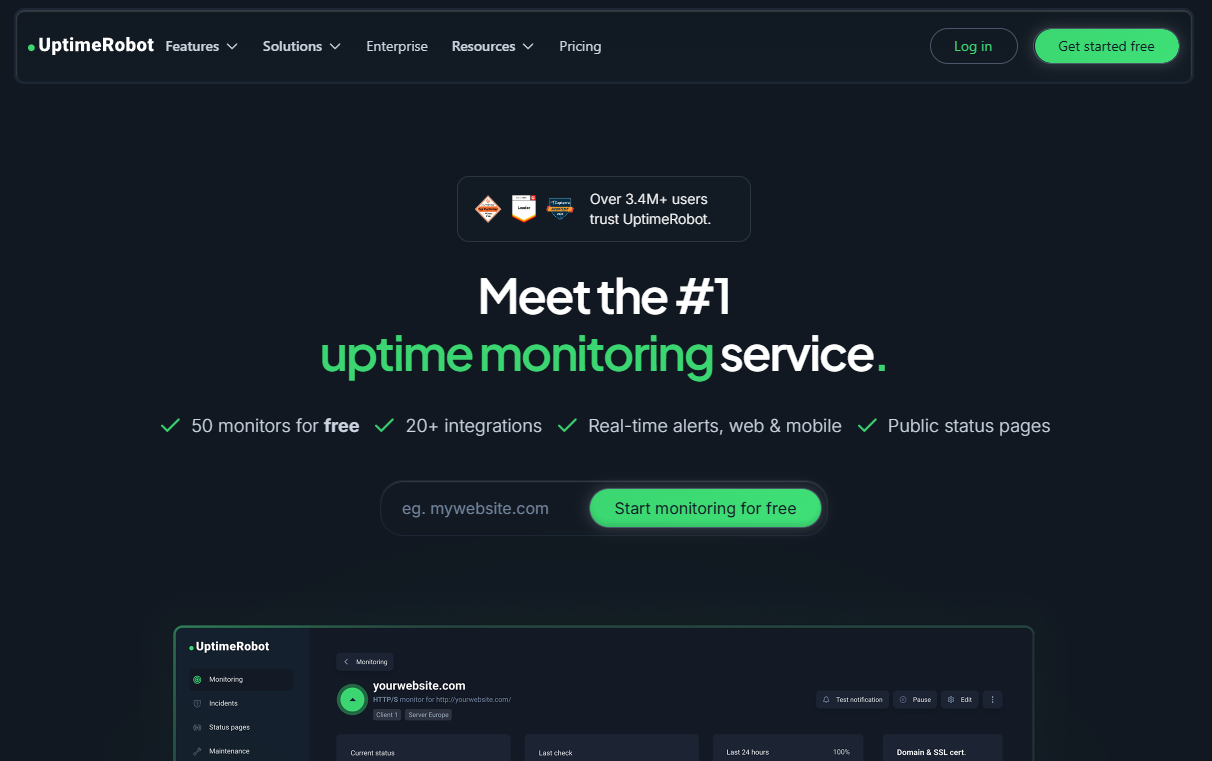
UptimeRobot is a hosted monitoring platform that covers websites, APIs, servers, ports, keywords, SSL certificates, DNS, domains, and cron jobs. It focuses on availability coverage and broad alert delivery without requiring an observability budget. The free tier gives teams 50 monitors with 5-minute check intervals, which is enough to get meaningful uptime coverage on a production site and its critical endpoints right away.
Best for: Startups, solo PMs, and small SaaS teams who need uptime and SSL coverage on a public site or API without committing to a full observability stack.
Key features
- HTTP, ping, port, keyword, API, UDP, DNS, and SSL monitoring
- SSL certificate expiry and domain expiration alerts
- Public and private status pages with incident updates
- Multi-channel alerts: Email, SMS, voice, Slack, PagerDuty, and webhooks
- API access and multi-location checks
Why choose UptimeRobot: It fits teams whose primary risk is "is the site down?" rather than "which step in the checkout flow failed and why?" If the team later needs traces, browser journeys, or RUM, UptimeRobot pairs cleanly with a complementary observability tool.
UptimeRobot pricing: Free plan covers 50 monitors at 5-minute intervals. Solo runs $13/month, Team $46/month, and Scale $98/month, with faster monitoring intervals and white-label status pages on paid tiers. Enterprise pricing is available on request.
G2 rating: 4.7/5
2. Site24x7
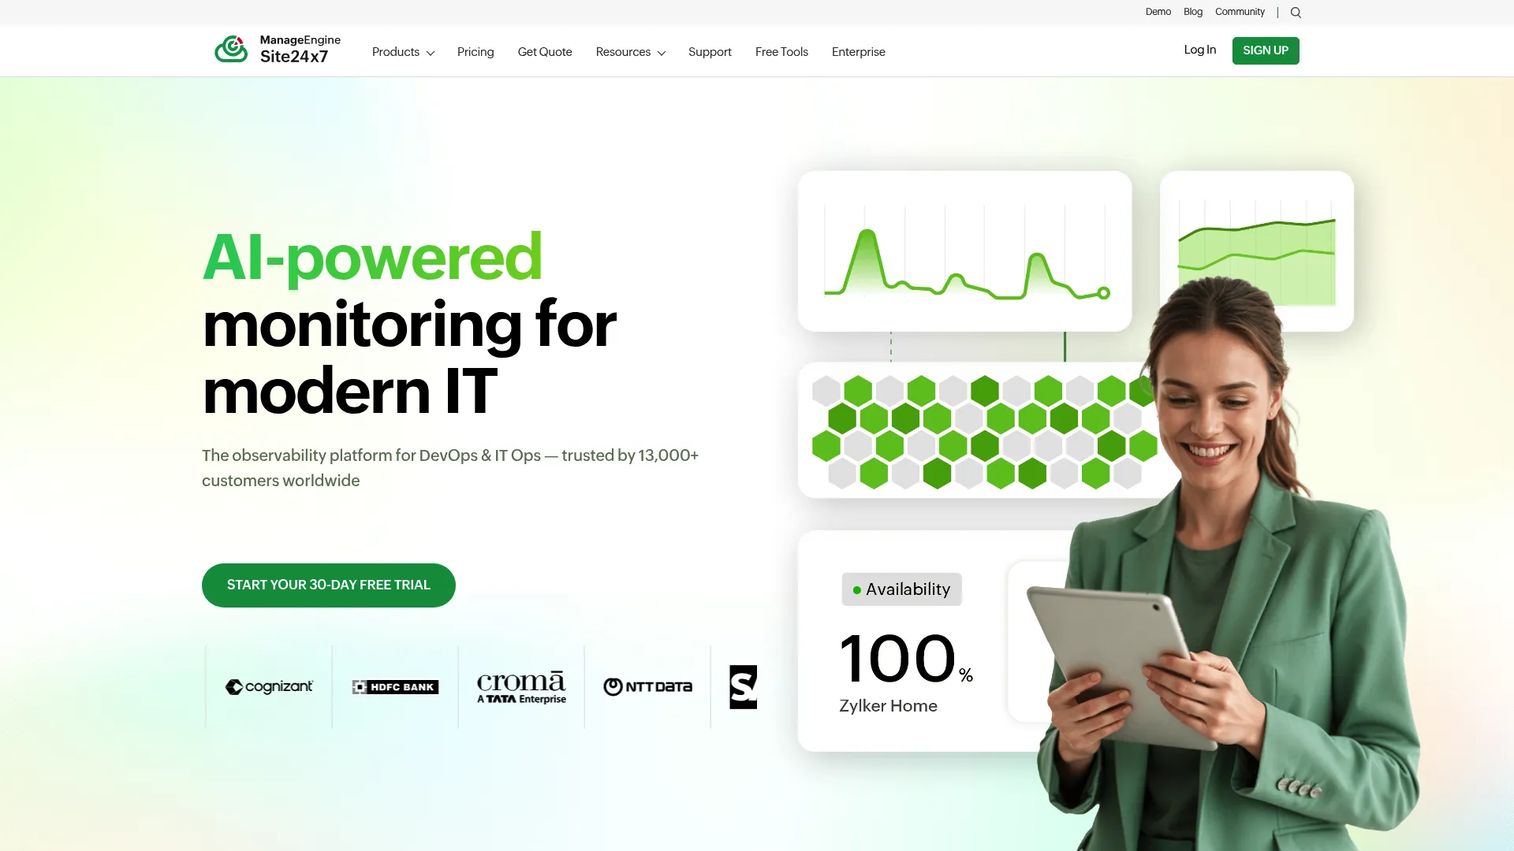
Site24x7 is an AI-powered monitoring platform that connects website uptime to synthetic transactions, real user monitoring, infrastructure, network, and application signals. For product teams whose customer experience depends on more than a single page loading, it offers a meaningful step up from pure uptime tools without the complexity of a full enterprise observability platform.
Best for: Product and IT teams that need one platform covering external customer experience and internal service health, with enough coverage to link symptoms to causes.
Key features
- Website and API uptime checks
- Synthetic transaction monitoring for multi-step user flows
- Real user monitoring with performance segmentation
- Infrastructure, cloud, and network monitoring
- AIOps anomaly detection and alerting dashboards
Why choose Site24x7: A PM who needs to monitor signup, authentication, and payment journeys alongside server health can do that from one pane. It suits teams outgrowing standalone uptime tools who want broader visibility without a full enterprise procurement cycle.
Site24x7 pricing: A free-forever plan supports up to 50 resources for uptime monitoring. The Web Uptime plan starts at $9/month billed annually ($10/month billed monthly). A 30-day free trial covers paid plans. The Web Perf plan, which adds performance monitoring, starts at $36/month billed annually. Infrastructure plans begin at $9/month billed annually.
G2 rating: 4.6/5
3. Datadog
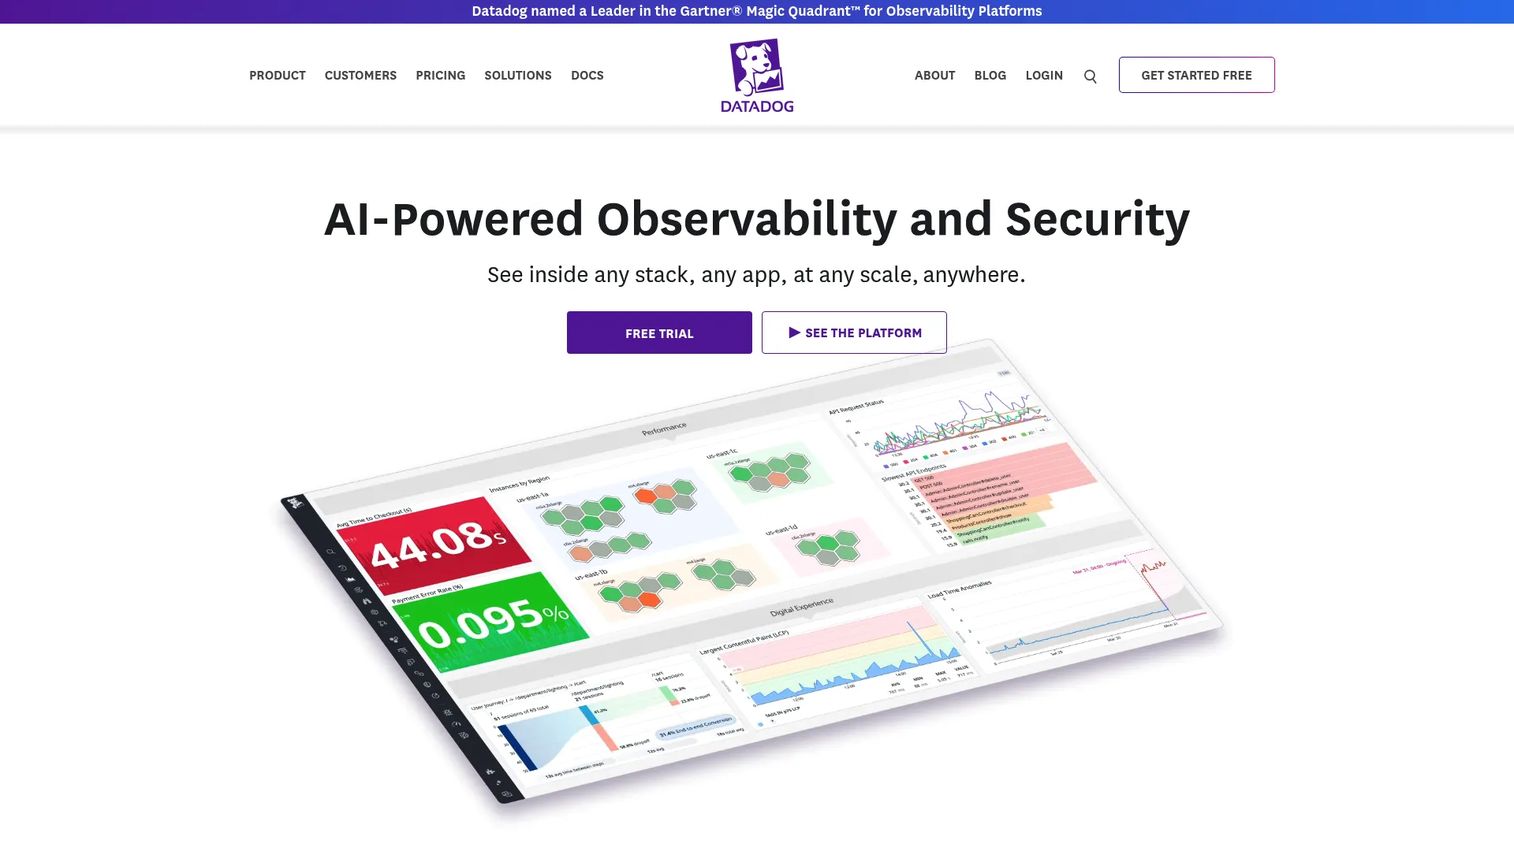
Datadog is an observability and security platform for cloud applications. It correlates browser performance data with application traces, logs, and infrastructure metrics, so when a synthetic check fails at 2 a.m., engineers can trace the failure through dependent services without switching tools. That correlation is its core value for product-led teams shipping frequently.
Best for: Product organizations with SRE or engineering maturity, multiple interdependent services, and a need to connect customer-facing incidents to technical root cause.
Key features
- Synthetic browser and API tests with global locations
- Real user monitoring and digital experience tracking
- Application performance monitoring (APM) with distributed tracing
- Log management and infrastructure metrics
- Incident-response integrations and alert routing
Why choose Datadog: It answers "which service, deployment, dependency, or region caused the failure?" not just "is the page down?" Cost management matters at this depth. Datadog's usage-based model means costs scale with monitor counts, ingested log volume, and RUM sessions. Teams should model their usage before committing.
Datadog pricing: Pricing is product-based and usage-based. Infrastructure Pro runs $15 per host per month billed annually. APM costs $31 per APM host per month billed annually. Log ingestion starts at $0.10 per GB per month. RUM starts at $0.15 per 1,000 sessions. A 14-day free trial is available.
G2 rating: 4.4/5
4. New Relic
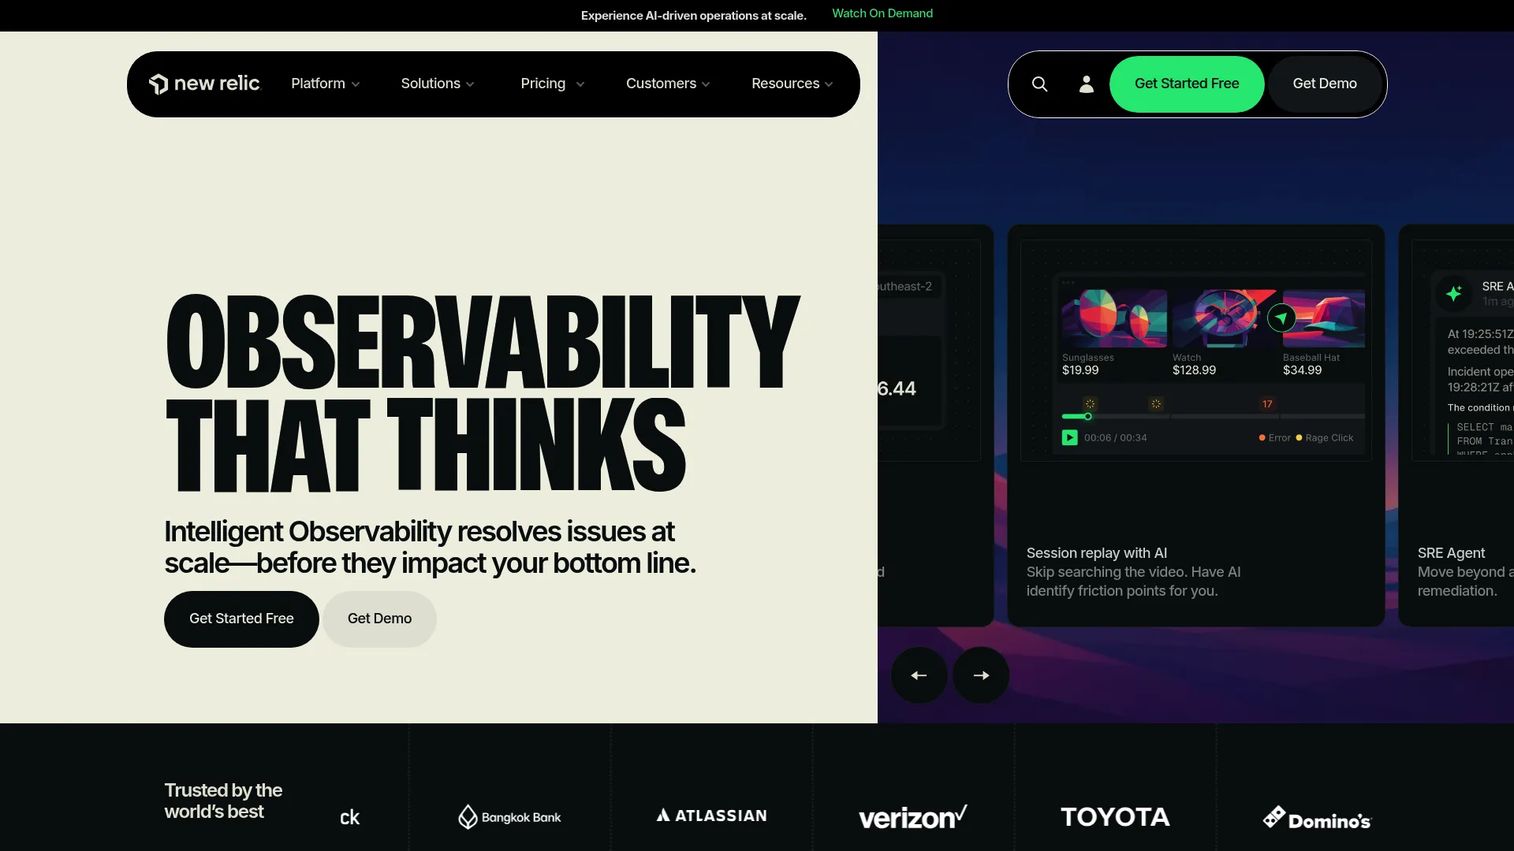
New Relic is an observability platform that connects browser performance data to application traces, error tracking, and distributed transaction context. For a PM who needs to understand how a release affected real users on specific routes, it provides the browser-to-backend path in one place. Its free tier with 100 GB/month data ingest makes it accessible for teams that want meaningful coverage before committing to a paid plan.
Best for: Product managers who need visibility into how real users experience web performance and want to connect client-side issues to application-stack causes without maintaining separate monitoring systems.
Key features
- Browser performance monitoring with Core Web Vitals
- Synthetic monitoring for scripted user journeys
- Application performance monitoring and distributed tracing
- Error tracking connected to release health data
- Custom dashboards and alert policies
Why choose New Relic: When a release degrades client-side performance or introduces front-end errors on a specific route, New Relic gives product teams the evidence to prioritize a fix with engineering. Its usage-based model means smaller teams can start for free and scale costs as they grow.
New Relic pricing: A free tier includes 100 GB of data ingest per month and one full-platform user. Standard plans start at $10 for the first user per month. Pro costs $349 per user per month on an annual commitment. Enterprise pricing is available through sales. Additional data ingest runs $0.40/GB beyond the free allowance.
G2 rating: 4.4/5
5. Uptrends
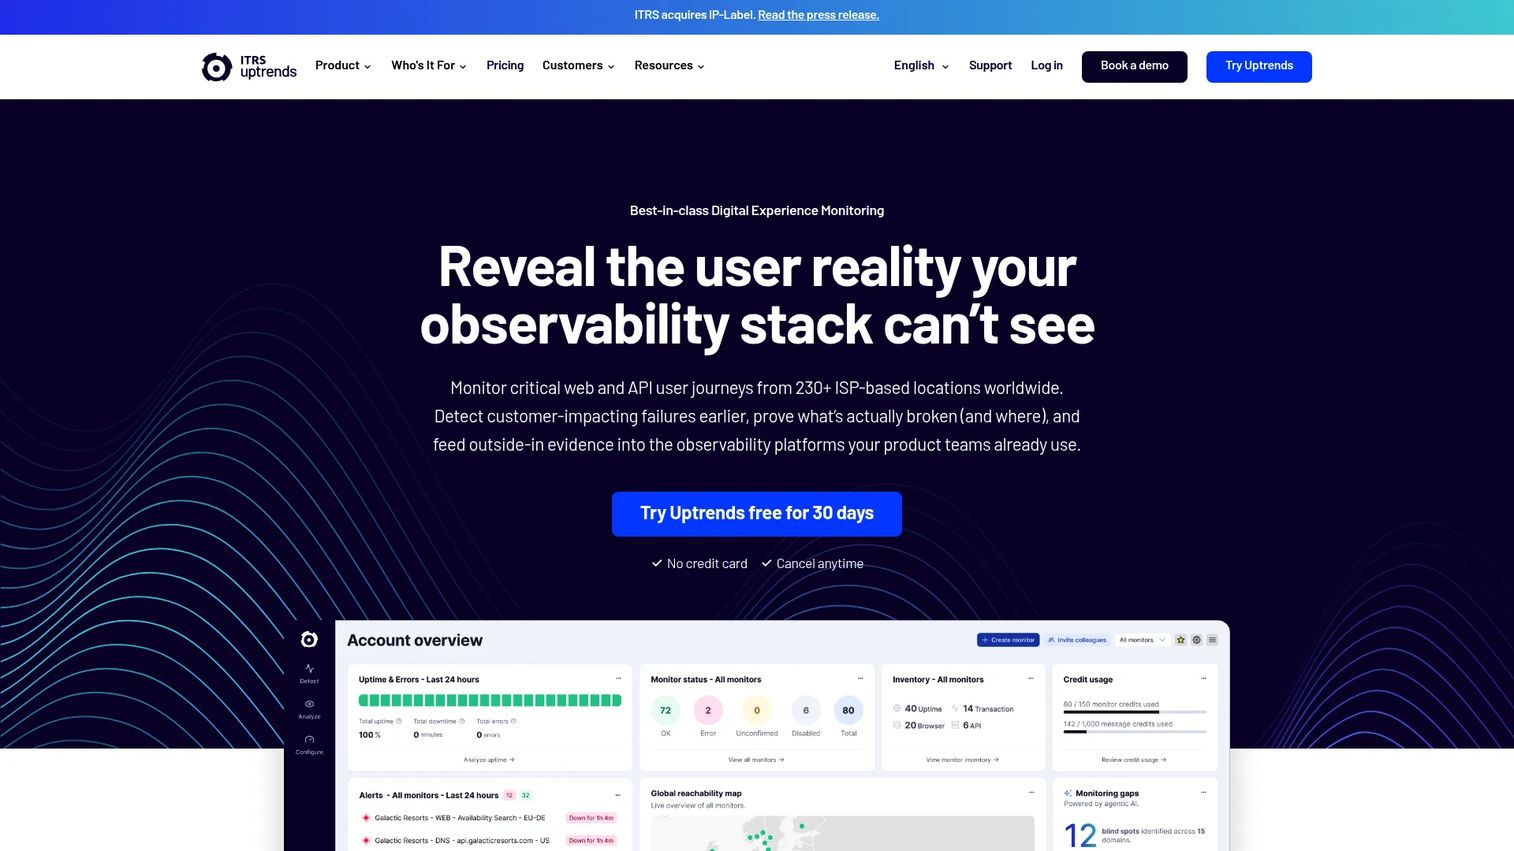
Uptrends specializes in synthetic website monitoring, real-browser user journeys, and web performance diagnostics. While many uptime tools send a ping and check for a 200, Uptrends runs full Chrome and Firefox browsers from global checkpoint locations, takes screenshots at each step, and produces waterfall reports showing exactly which resource slowed or failed. That evidence changes how fast product and engineering can align on a fix.
Best for: Product teams that need to validate signup, login, checkout, or other browser-based customer journeys from multiple geographic locations, with visual proof of failure.
Key features
- Real-browser user-journey checks with Chrome and Firefox
- Global checkpoint network with multi-location confirmation
- Screenshots and waterfall diagnostics at each monitor step
- API monitoring and basic uptime checks
- Core Web Vitals reporting and SLA dashboards
Why choose Uptrends: A 200 response code does not prove a customer completed a high-value action. Uptrends catches the difference by running full browser sessions. Screenshots and waterfall data reduce the back-and-forth between product and engineering during triage. Check our guide to application performance monitoring tools for a broader comparison of performance-focused platforms.
Uptrends pricing: Core starts from $42/month billed annually. Pro, which adds expanded checkpoints and transaction monitoring, starts from $60/month billed annually. Enterprise pricing is custom. A 30-day free trial is available.
G2 rating: 4.1/5
6. Dotcom-Monitor
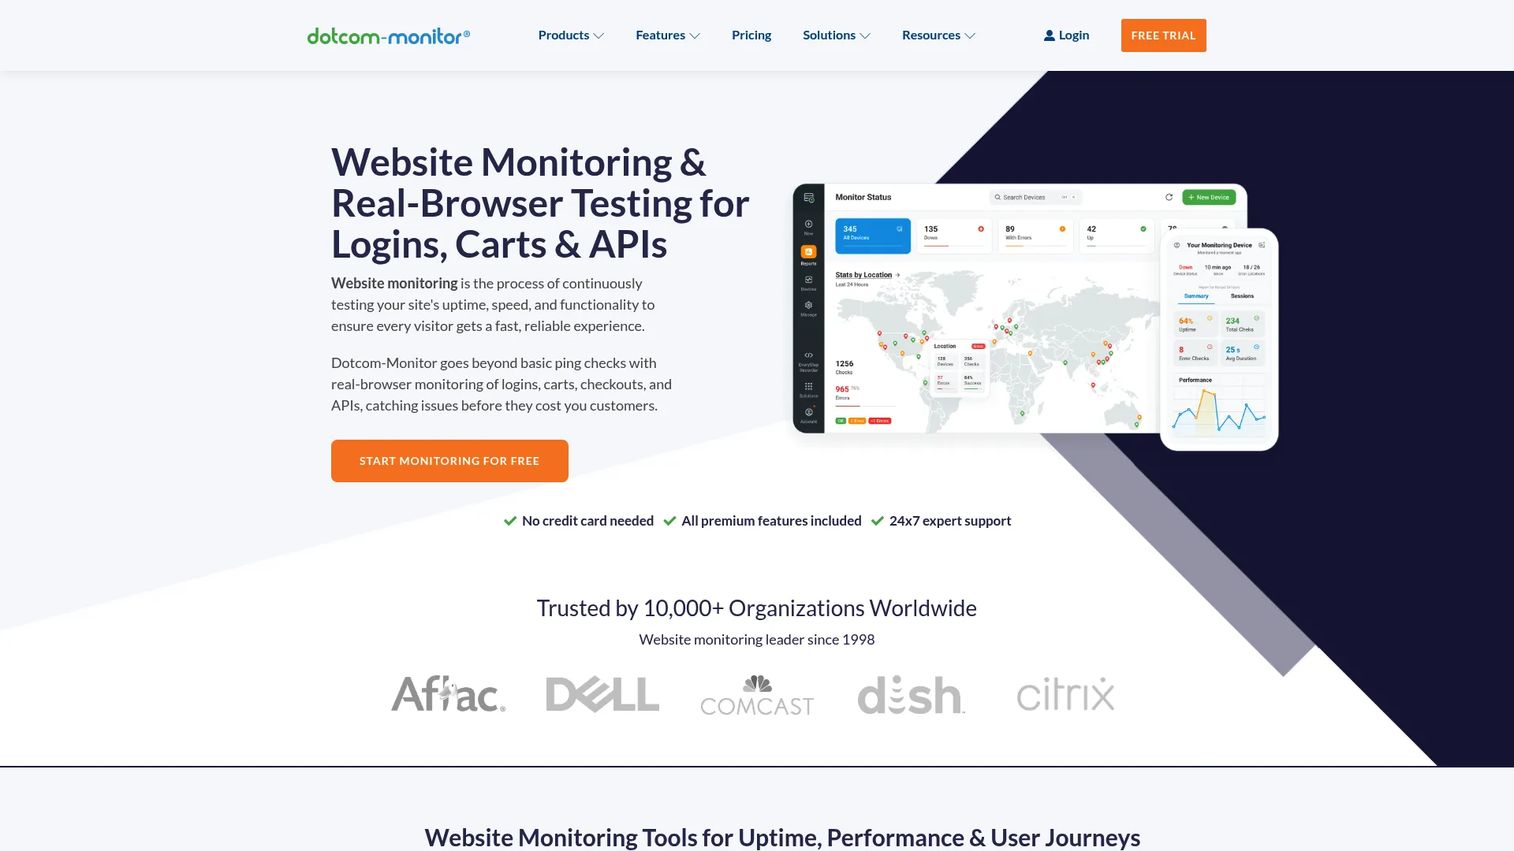
Dotcom-Monitor is a synthetic monitoring platform for websites, web applications, APIs, and infrastructure performance. Its EveryStep browser scripting engine runs real-browser transaction tests from a global agent network, capturing screenshots and waterfall data at each step. It suits teams that need detailed forensic evidence when a customer-facing workflow fails intermittently or only in specific locations.
Best for: Teams investigating intermittent workflow failures who need location-specific, visual evidence to confirm and reproduce the issue for engineering.
Key features
- Browser-based transaction monitoring with EveryStep scripting
- Multi-location uptime testing across a global agent network
- API, DNS, and SSL monitoring
- Screenshots and waterfall reports per monitor step
- Configurable alert escalation with custom thresholds
Why choose Dotcom-Monitor: It is useful when the team needs more than an outage alert. Visual evidence, precise performance timing, and location-specific failure data cut the time spent recreating a problem. If API monitoring is a primary concern alongside transaction testing, Dotcom-Monitor covers both in one platform.
Dotcom-Monitor pricing: A free plan is available. Paid subscriptions start from $19.99/month and adjust based on the platform, number of targets, and check frequency. Enterprise pricing is available by custom quote.
G2 rating: 4.5/5
7. LogicMonitor
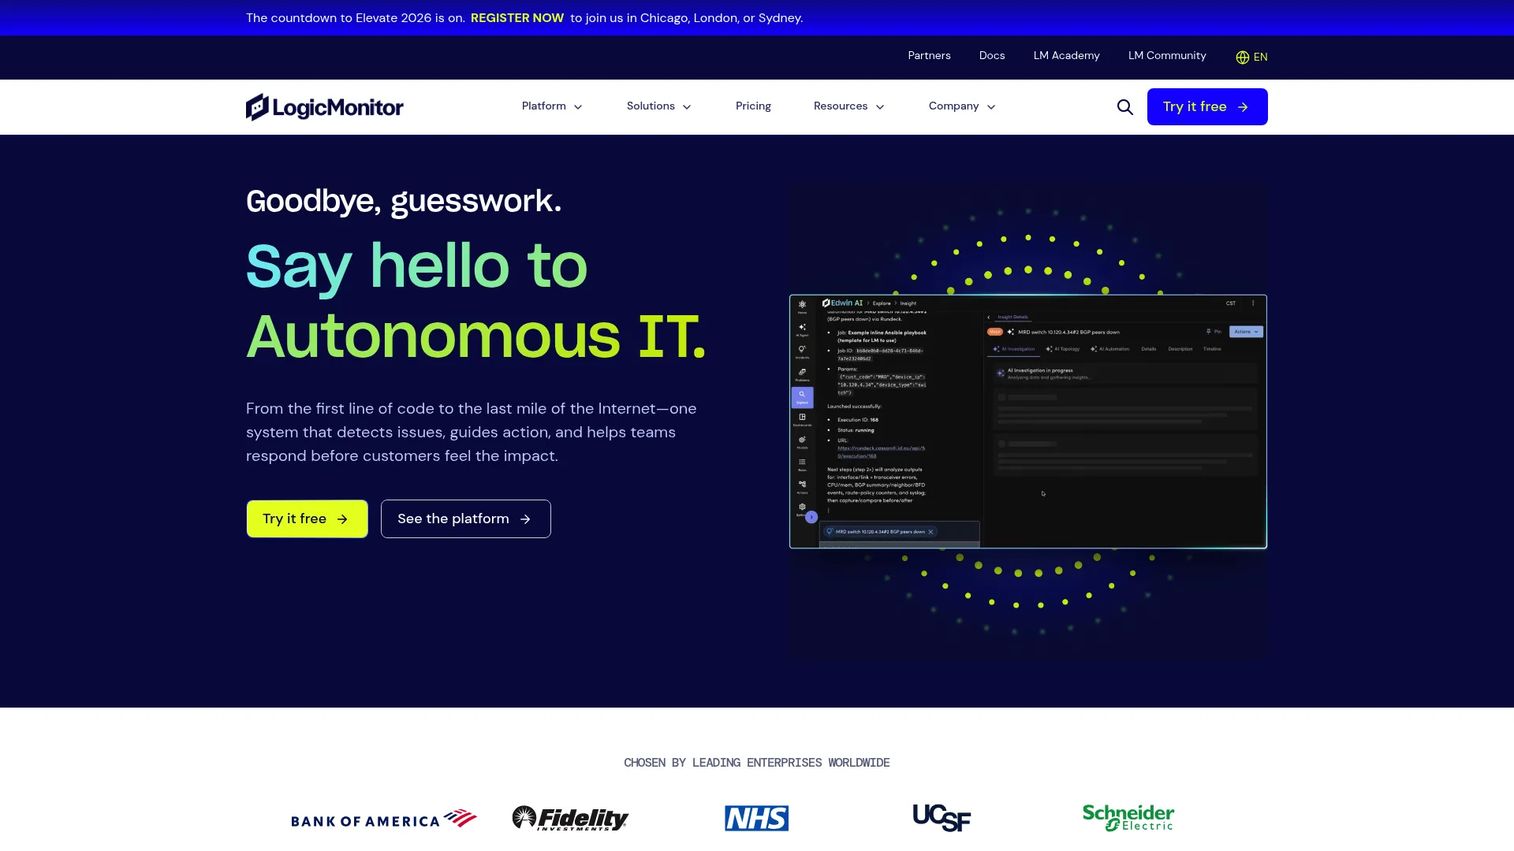
LogicMonitor is an AI-powered observability platform for infrastructure, cloud environments, applications, networks, and digital experiences. Its strength is correlating website-level availability signals with the hybrid infrastructure those sites depend on. For teams managing cloud services alongside on-premises systems, it connects the dots that a pure website monitoring tool cannot.
Best for: Mid-market and enterprise operations teams managing website availability across a mixed estate of cloud services, internal systems, and network components.
Key features
- Infrastructure, cloud, and network monitoring in one platform
- Application dependency visibility and topology mapping
- Agentic AIOps with alert correlation and root-cause analysis
- Alert escalation workflows with 3,000+ integrations
- Operational dashboards with dynamic thresholds and forecasting
Why choose LogicMonitor: It suits organizations where a website going down is often a symptom of something deeper in the infrastructure. Its Edwin AI capability links alert correlation to guided remediation, which shortens mean time to resolution on complex incidents. Teams should model pricing against their Hybrid Unit count before committing.
LogicMonitor pricing: LM Essentials starts at $16 per Hybrid Unit per month. LM Advanced starts at $27 per Hybrid Unit per month. LM Signature with Edwin AI starts at $53 per Hybrid Unit per month. A 15-day free trial is available.
G2 rating: 4.5/5
8. Dynatrace
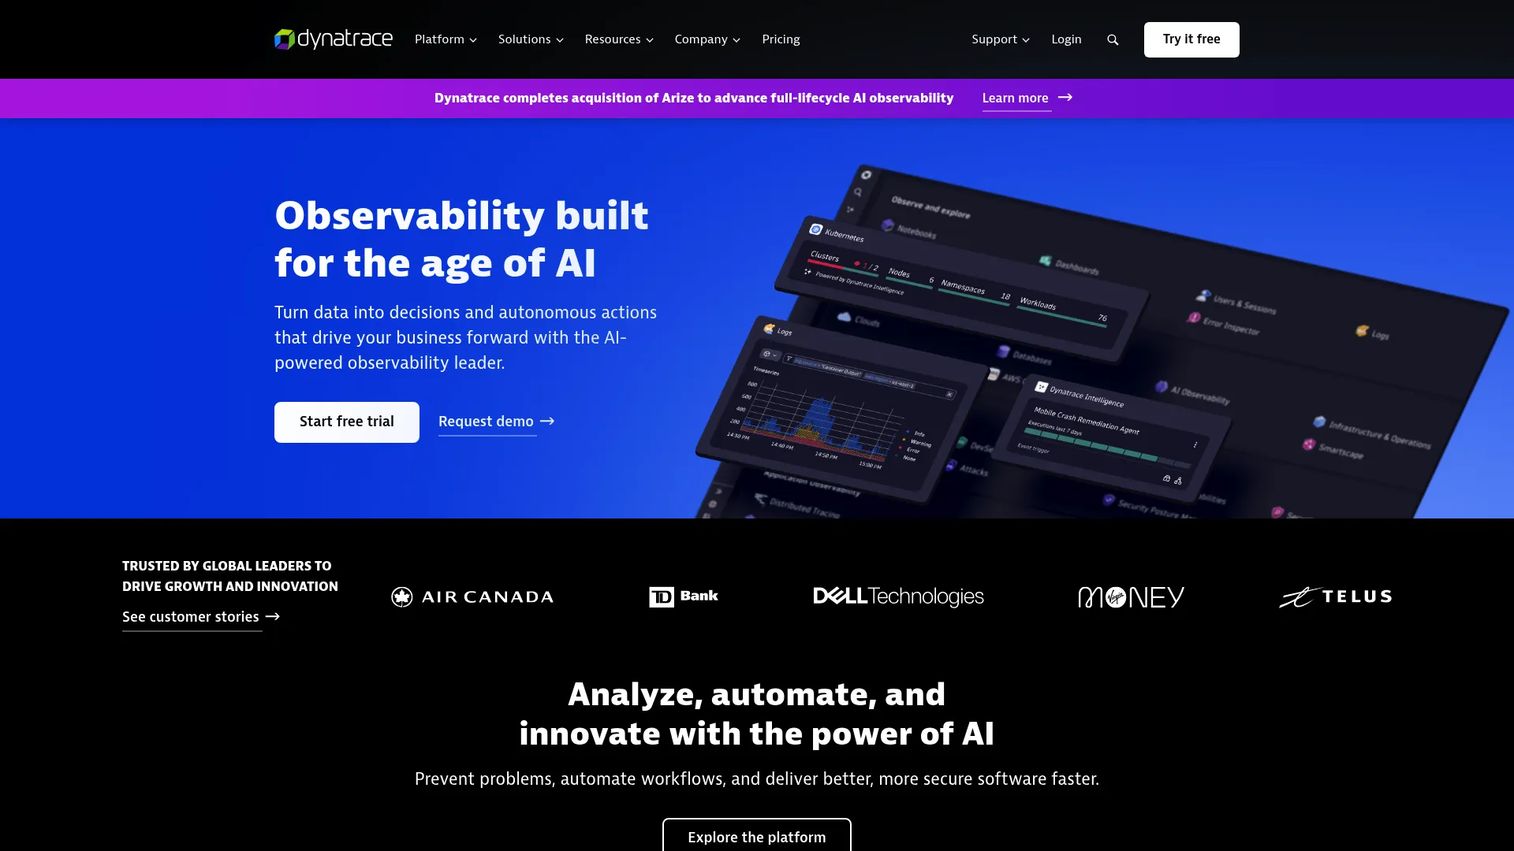
Dynatrace is an agentic AI platform for unified observability, security, and automation across applications, infrastructure, cloud platforms, and AI workloads. For enterprise product organizations with complex distributed systems, it combines real-user monitoring, synthetic checks, session replay, and automatic service topology mapping into a single platform. Its Davis AI engine detects anomalies and traces root cause without requiring teams to build manual correlation rules.
Best for: Enterprise product organizations with large technical footprints and complex root-cause analysis requirements across customer experience and backend dependencies.
Key features
- Real-user monitoring, synthetic monitoring, and session replay
- Application and infrastructure observability with automatic discovery
- Topology and dependency mapping via AI-powered Davis
- Automated anomaly detection and guided remediation
- Enterprise governance controls and compliance support
Why choose Dynatrace: It fits teams whose incidents span multiple services, regions, and infrastructure layers. Davis AI reduces the manual work of correlating browser failures to infrastructure events. Evaluate implementation effort, data model fit, and how insights flow into your existing incident and release workflows before purchasing. For teams evaluating application security testing alongside observability, Dynatrace covers both domains.
Dynatrace pricing: Consumption-based Dynatrace Platform Subscription pricing draws down against an annual commitment. Foundation and Discovery monitoring costs $0.01 per host-hour. Full-Stack Monitoring costs $0.01 per memory-GiB-hour. A free 15-day trial and a free playground environment are available.
G2 rating: 4.5/5
9. Sentry
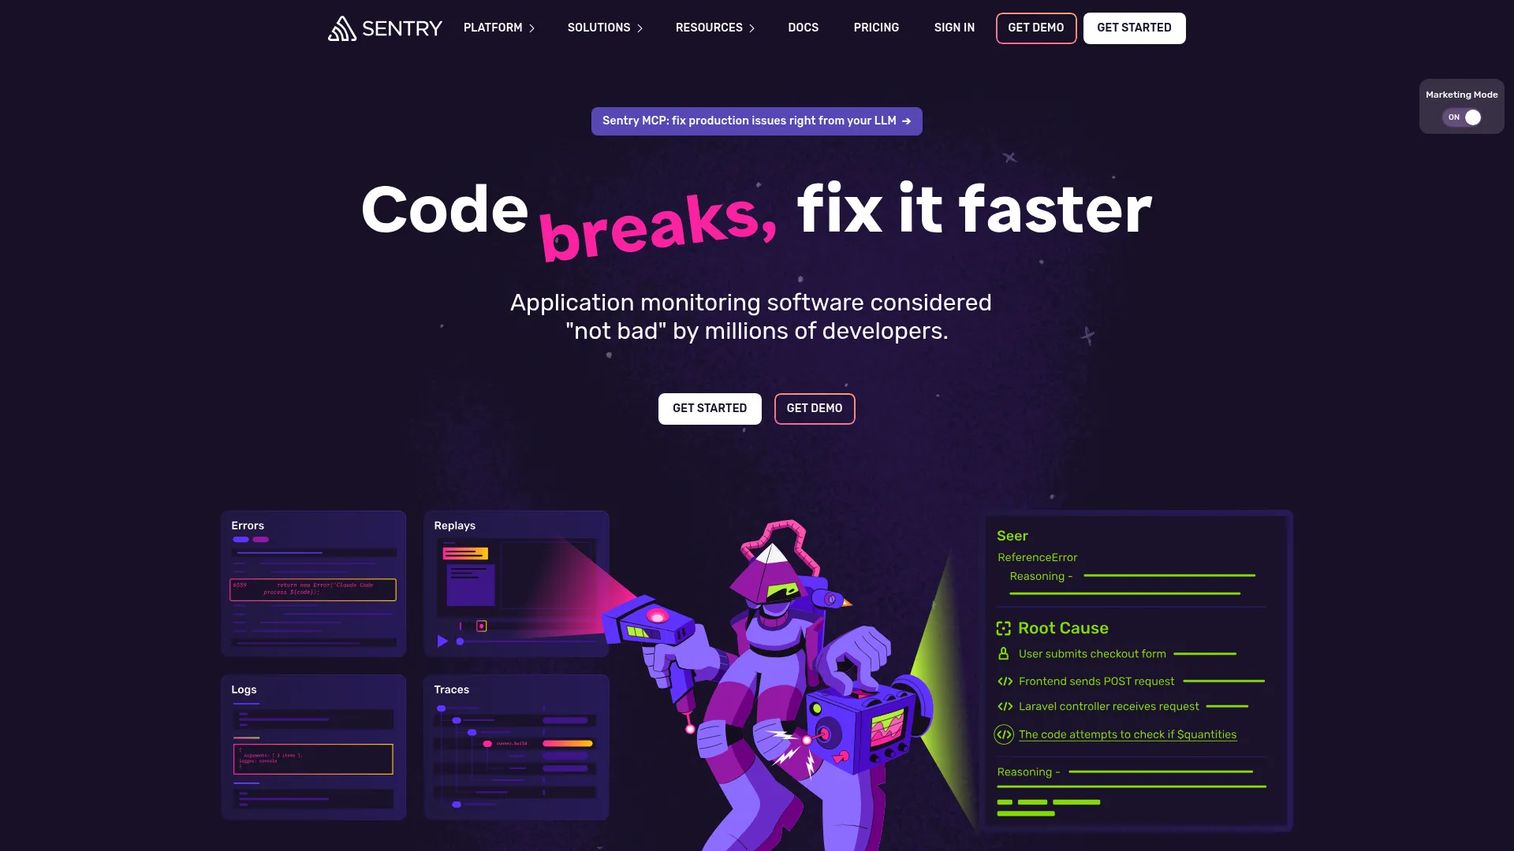
Sentry is a developer-first application monitoring platform for tracking errors, performance, logs, traces, session replays, and release health. Where dedicated uptime tools detect that something is broken, Sentry helps engineers understand exactly where and why it broke. Its Seer AI debugging agent can identify the root cause and suggest fixes directly within the issue context.
Best for: Product teams working closely with software engineers who want a direct path from user-facing errors to stack traces, affected code, and release health data.
Key features
- Error monitoring with stack traces, breadcrumbs, and issue grouping
- Application performance tracing across services, APIs, and databases
- Release health visibility tied to specific deployments
- Session replay for visual context on affected user paths
- Alert rules with ownership workflows for triage assignment
Why choose Sentry: It is strongest when code-level failures are the primary source of customer friction. A PM can quantify how many users a specific error affected on a given release, then hand that data to engineering with full context. Sentry complements rather than replaces a dedicated uptime or synthetic monitoring platform.
Sentry pricing: Sentry offers a free tier with event-based billing. Sentry's official pricing page should be checked directly for current team and business plan rates, as the configuration is event-volume-based and varies by plan.
G2 rating: 4.5/5
10. Sematext
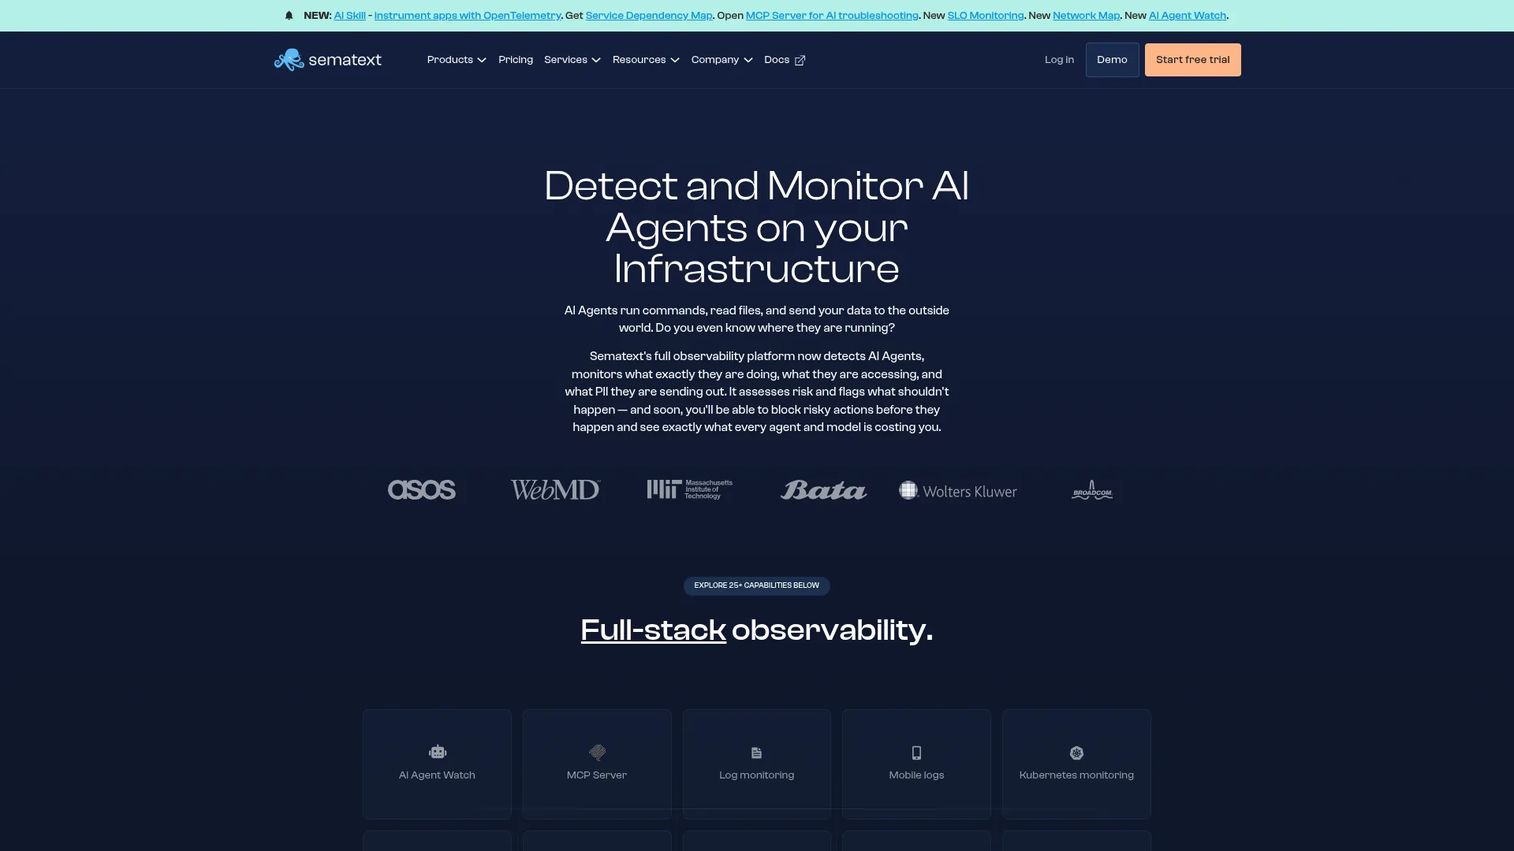
Sematext is a full-stack observability platform for logs, infrastructure monitoring, distributed tracing, network mapping, real user experience monitoring, and synthetic checks. Its modular pricing model lets teams pay for the specific capabilities they need today and add more as monitoring maturity grows. For PMs balancing coverage against budget and engineering capacity, that flexibility is a practical advantage.
Best for: Engineering and operations teams that want to assemble observability coverage incrementally rather than committing to a large all-in-one platform immediately.
Key features
- Synthetic and uptime monitoring with configurable intervals
- Real user monitoring for digital experience tracking
- Centralized log management with search and alerting
- Infrastructure and service monitoring with integrations
- OpenTelemetry-based distributed tracing
Why choose Sematext: Its module-level pricing means a team can start with synthetic monitoring and logs, then add infrastructure or RUM as needs expand. Validate which specific modules cover your website monitoring requirements before purchase. For teams also evaluating API testing tools alongside observability, Sematext's API monitoring capability is worth comparing.
Sematext pricing: Plans are modular and usage-based, with a 14-day free trial and no credit card required. Synthetics Pay-As-You-Go starts at $2 per HTTP monitor/month and $7 per browser monitor/month, with a $5/month minimum. Logs Basic starts at $5/month. Infrastructure monitoring starts at $2.80/month, and the starting per-host price is $1.68/host/month. No permanent free tier.
G2 rating: 4.7/5
Considerations when choosing website monitoring software
Monitor customer journeys, not only URLs
Identify the top three to five workflows tied to your activation and revenue metrics before selecting a tool. Signup, login, payment, account provisioning, and the first value-producing action in your product all deserve dedicated synthetic checks. A monitoring strategy built around what your activation KPIs depend on will surface failures before support tickets do. Check our guide to best user onboarding software tools for context on how onboarding flow and monitoring connect to the same outcome metrics.
Match monitoring depth to your release cadence
Teams shipping daily need automated synthetic checks before release and immediately after deployment. Teams running a simpler marketing site generally need uptime, SSL expiry, and page performance monitoring first. The opportunity cost of choosing too much monitoring too early is engineering attention; the cost of choosing too little is a customer-reported outage.
Plan alert ownership before rollout
A monitoring dashboard does not reduce incident response time by itself. Define who receives each alert type, when an alert escalates, which channel holds incident coordination, and how support receives updates. Unowned alerts create alert fatigue. Alert fatigue degrades response quality across the team.
Evaluate diagnostic evidence, not alert volume
Prioritize tools that answer what broke, who was affected, where it happened, and whether the issue is still active. Screenshots, waterfall data, step-level traces, and release markers reduce the time spent recreating failures. A tool that sends more alerts but provides less context is worse than one that sends fewer, more actionable ones.
Model cost against usage growth
Compare monitor counts, check frequency, retained data volume, browser-run volume, ingestion, and seat pricing across candidate tools. Usage-based platforms can fit mature observability needs, but they require a named owner for cost controls. Run a cost model for your expected 12-month usage before committing, not your current baseline.
Conclusion
The right monitoring tool depends on what failure mode your team is actually exposed to and what evidence you need to fix it fast.
For focused uptime and SSL coverage, UptimeRobot is the lowest-friction starting point. Site24x7 steps up to cover synthetic transactions, RUM, and infrastructure from a single platform at a predictable entry price. If your customer experience depends on multi-step browser journeys, Uptrends or Dotcom-Monitor provide the real-browser evidence that shortens triage.
For teams where incidents span multiple services and layers, Datadog, New Relic, and Dynatrace each bring full-stack context, at different price points and implementation depths. Sentry sits closest to the code, connecting user-facing errors directly to stack traces and release health.
The practical next step: Map the two or three customer journeys most critical to your activation metric, set a baseline on what those flows look like today, and run a monitored synthetic test against them before committing to a platform. That exercise will tell you more about which tool fits your team than any feature matrix.
Start your journey with Guideflow today!
FAQs
Start with a tool that covers HTTP uptime, SSL certificate expiry, and multi-channel alerts on a free or low-cost tier. UptimeRobot's free plan covers 50 monitors, which is enough for a public site, checkout endpoint, and a few APIs. Small teams should prioritize the pages and flows where a failure would directly cost customers or revenue, not every page in the sitemap.
Uptime monitoring confirms availability: Did the server respond? Performance monitoring measures the quality of that response: How long did it take, and did everything on the page load correctly? A site can be technically "up" while loading in seven seconds, rendering broken scripts, or returning degraded third-party content. For product teams, performance monitoring is often more actionable because it catches the slow experience customers abandon before they file a ticket.
Synthetic monitoring runs scripted tests that simulate real customer actions, such as logging in, submitting a form, completing a purchase, or creating an account. Instead of waiting for a user to report a broken flow, synthetic tests catch the failure on a schedule. For product managers protecting activation workflows, synthetic monitoring is the difference between knowing a flow is broken before customers do versus hearing about it from support.
They answer different questions. Synthetic monitoring tests planned paths proactively on a schedule, from specific locations and browser types. Real user monitoring (RUM) shows how actual visitors experienced your product across all the conditions you cannot script in advance: Their device, network, region, and browser version. Teams with high-traffic or high-value customer journeys benefit from both. Synthetic checks catch regressions before users hit them; RUM surfaces issues synthetic tests did not anticipate.
Tie frequency to the business impact of a failure. Authentication, payment, and core application flows warrant checks every one to five minutes. Signup and account creation flows are typically worth checking every five minutes. Lower-priority content pages can use 30 to 60-minute intervals. False positives increase with higher frequency, so pair fast intervals with multi-location confirmation to avoid alert fatigue on transient failures.
Most platforms in this list support API monitoring, SSL expiry alerts, and DNS checks, but the depth varies. Before purchasing, verify the specific monitor types each plan includes, the minimum check interval for each type, whether alerting covers each type separately, and which geographic locations are available for each check. SSL and DNS monitoring are often bundled into entry-tier plans, while transaction-level API checks may require a higher tier.
Configure multi-region confirmation so an alert only fires when two or more locations report the same failure. Add retry rules so a single transient timeout does not trigger a page. Set maintenance windows during planned deployments. Use dependency-aware alerting to suppress downstream alerts when a known upstream service is already in an incident. Assign clear alert ownership so each alert type has a named responder, which prevents alert fatigue from eroding response quality.
Begin with the customer-facing moments that determine whether a new user activates. Signup, login, billing, and the first meaningful product workflow are the highest-priority targets. Add monitoring for account setup, key integrations your product depends on, and any email or webhook delivery that triggers activation. Review your best user research tools data to confirm which flows correlate most strongly with early retention before choosing which journeys to instrument first.