

A checkout service slows to a crawl at 2 a.m. The pager fires. You open three dashboards, grep through five log streams, and start reconstructing what happened across a dozen microservices that all talk to each other. Forty minutes in, you still do not know which service caused it. The system was working. Then it was not. And nothing told you why.
This is the problem observability software exists to solve. Distributed systems fail in ways that are invisible until something breaks, and when they break, the cost of slow diagnosis compounds fast. The category has grown into real money because of it. According to Mordor Intelligence (2026), the global observability market is worth about USD 3.35 billion and is projected to nearly double to USD 6.93 billion by 2031, at a compound annual growth rate of 15.62%.
That growth tracks a simple shift. Teams moved from monolths to microservices, from servers to ephemeral containers, and from a handful of known failure modes to an unbounded set of unknown ones. Monitoring tools that answer "is the server up?" no longer cut it. Engineering, SRE, platform, and IT operations teams now need software that collects logs, metrics, and traces, correlates them, and helps a human ask new questions during an incident without redeploying anything.
This guide compares the 12 observability platforms worth evaluating in 2026. Each entry includes verified pricing, a G2 rating, and an honest read on who it fits. Many of these vendors rely on interactive product demos to show their dashboards in action before a buyer commits to a proof of concept.
What's inside
This guide is for engineers, SREs, platform leads, IT operations teams, and the technical evaluators (including sales engineers in the DevOps tooling space) who research and validate these tools before purchase. If you sit in that presales seat, our roundup of the best presales software tools pairs well with this evaluation. We selected the 12 observability platforms based on four criteria that matter most for a real buying decision:
- Telemetry coverage: support for logs, metrics, and traces, not just one signal.
- Scalability: handles SMB to enterprise telemetry volumes without degrading.
- Integrations and OpenTelemetry support: open standards over vendor lock-in.
- Pricing transparency: published or G2-reported figures, not just "contact sales."
Every tool below earns its slot on at least three of these. We note trade-offs honestly so you can shortlist faster.
TL;DR
Short on time? Here are the decision shortcuts:
- Best for full-stack enterprise observability: Datadog, for teams that want one platform across infrastructure, APM, logs, and security.
- Best for AI-driven enterprise automation: Dynatrace, for large hybrid estates that want automatic root-cause analysis.
- Best open-source stack: Grafana Cloud, built on the LGTM stack with open standards at the core.
- Best for cloud-native and Kubernetes: Prometheus, the CNCF metrics standard for teams running their own stack.
- Best for AWS-native teams: Amazon CloudWatch, the default for workloads already living in AWS.
- Best for cost-conscious cloud-native teams: Middleware, OpenTelemetry-based with usage pricing and an AI SRE agent.
What is observability software?
Observability software is a category of tools that collect, correlate, and analyze telemetry data (logs, metrics, and traces) to help teams understand the internal state of distributed systems and diagnose issues quickly.
The observability definition that matters in practice: monitoring tells you that something is wrong, observability helps you understand why. A monitoring tool watches for known failure conditions you defined in advance. An observability platform lets you explore problems you never anticipated, by querying rich telemetry after the fact.
Most observability platforms share a common set of capabilities:
- Telemetry collection: ingest logs, metrics, and traces from applications, infrastructure, and services.
- Distributed tracing and service mapping: follow a single request across many services and visualize dependencies.
- Real-time dashboards and alerting: surface system observability signals and notify teams before users feel pain.
- Root-cause analysis: correlate signals to pinpoint the source of an incident.
- AIOps and anomaly detection: flag unusual patterns automatically, ahead of a threshold breach.
- OpenTelemetry support and integrations: ingest open-standard telemetry and connect to cloud providers, CI/CD, and alerting tools.
These observability metrics (the logs, metrics, and traces often called the three pillars) form the raw material. The software's job is to turn that raw material into answers fast. IBM's 2026 observability trends report frames the goal plainly: gather telemetry, detect anomalies, perform root-cause analysis, troubleshoot, and forecast problems before they occur.
Observability vs. monitoring
The two terms get used interchangeably, but the distinction is real and worth getting right.
| Dimension | Monitoring | Observability |
|---|---|---|
| Core question | Is something wrong? | Why is it wrong? |
| Failure modes | Known and predefined | Unknown and exploratory |
| Data approach | Predefined metrics and thresholds | Rich, high-cardinality telemetry |
| Best for | Stable, predictable systems | Distributed, dynamic systems |
| Typical output | Alerts on breached thresholds | Ad-hoc queries during investigation |
Monitoring is a subset of what observability delivers. You still need thresholds and alerts. But in a system with hundreds of services, you cannot predefine every failure mode, so you need the ability to ask new questions of your data mid-incident.
When to use observability software
Not every team needs a full observability platform on day one. Here are the situations where it pays off.
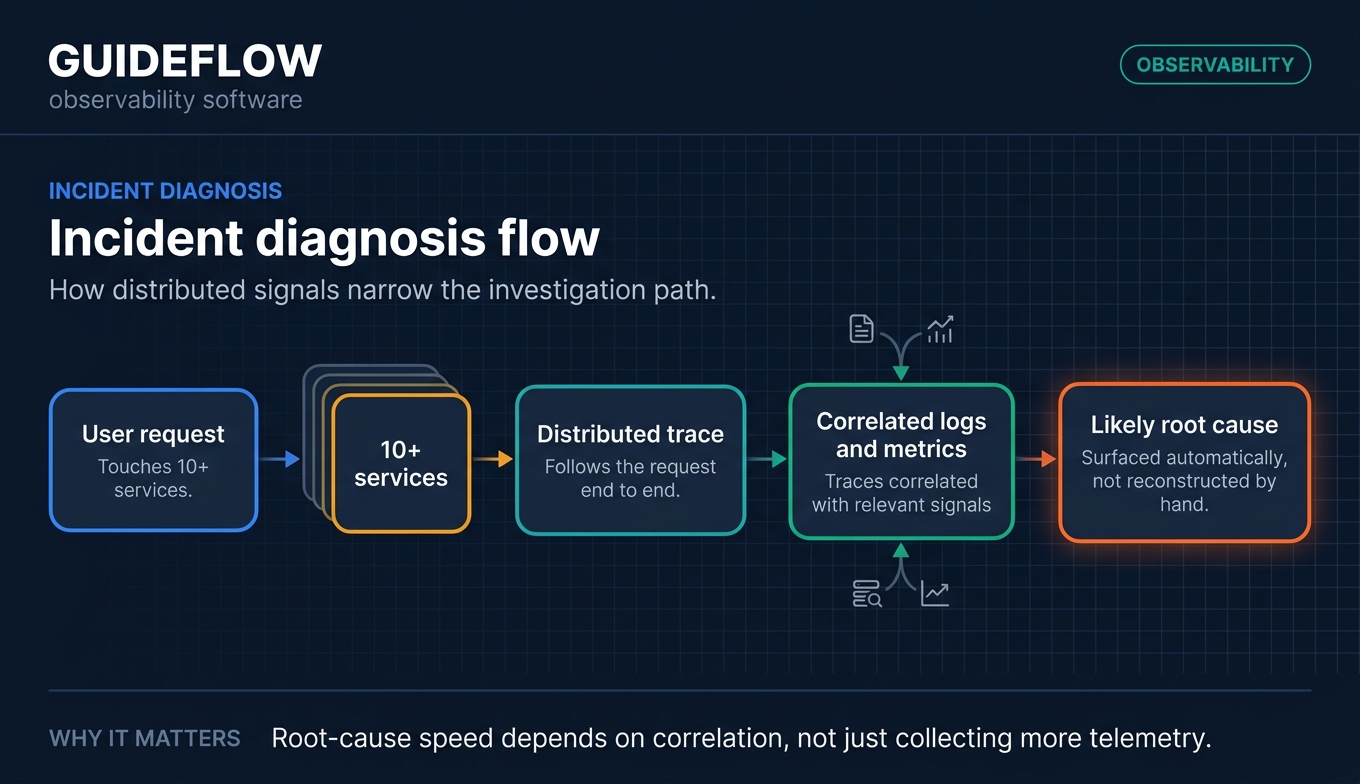
Diagnose outages across microservices
When a single user request touches ten or more services, logs alone cannot tell you where it went wrong. You need distributed tracing to follow that request end to end and see exactly which hop added latency or threw an error. Observability solutions correlate that trace with the relevant logs and metrics, so you stop guessing and start reading the actual path of failure.
Monitor cloud-native and Kubernetes workloads
Containers spin up and disappear in minutes. Pods reschedule across nodes. Static, host-based monitoring breaks down in this environment because the thing you were watching no longer exists. Cloud observability tools built for Kubernetes track ephemeral infrastructure continuously, attaching telemetry to workloads rather than fixed hosts, so you keep visibility even as the underlying compute churns.
Speed up root-cause analysis at scale
During an incident, every minute of diagnosis is a minute of degraded service. A cloud based observability platform reduces mean-time-to-resolution by correlating signals automatically and surfacing the likely cause instead of making an engineer reconstruct it by hand. Observability tools improve anomaly detection and root-cause analysis, which in turn can shorten MTTR materially during high-pressure incidents.
12 best observability software tools for 2026: comparison table
The table below summarizes all 12 observability platforms by intent, primary use case, entry pricing, and G2 rating. Pricing reflects published vendor figures as of mid-2026; ingestion and usage-based models mean your real cost depends on telemetry volume. Use this as a shortlist, then read the full sections for context.
| # | Product | Intent | Key use case | Pricing | G2 rating |
|---|---|---|---|---|---|
| 1 | Datadog | Full-stack SaaS observability | Unified infra, APM, logs, security | From $15/host/mo (annual) | 4.4/5 |
| 2 | Dynatrace | AI-driven enterprise observability | Automated root-cause at scale | From $7/host/mo | 4.5/5 |
| 3 | New Relic | Full-stack, usage-based | Predictable usage pricing | Free tier; usage-based | 4.4/5 |
| 4 | Grafana Cloud | Open-source-rooted stack | Dashboards, metrics, logs, traces | Free tier; Pro from $19/mo | 4.5/5 |
| 5 | Prometheus | Open-source metrics | Kubernetes-native monitoring | Free, open-source | 4.5/5 |
| 6 | Splunk Observability Cloud | Enterprise full-stack | Heavy log and trace analytics | Infra from $15/host/mo | 4.3/5 |
| 7 | Amazon CloudWatch | AWS-native monitoring | AWS metrics, logs, alarms | Free tier; pay-as-you-go | 4.3/5 |
| 8 | Elastic Observability | Search-powered observability | Logs, metrics, APM on Elastic | From $0.07/GB ingested | 4.2/5 |
| 9 | Honeycomb | High-cardinality events | Debugging complex production | Free tier; Pro from $130/mo | 4.7/5 |
| 10 | IBM Instana | Automated APM | Automated discovery, full-stack | From $20/MVS/mo | 4.4/5 |
| 11 | Coralogix | Streaming observability | Cost-controlled telemetry | Metrics from $0.05/GB | 4.6/5 |
| 12 | Middleware | Cloud-native, cost-efficient | OpenTelemetry-based unified obs | Free trial; from $0.30/GB | 4.7/5 |
The 12 best observability software tools for 2026
1. Datadog
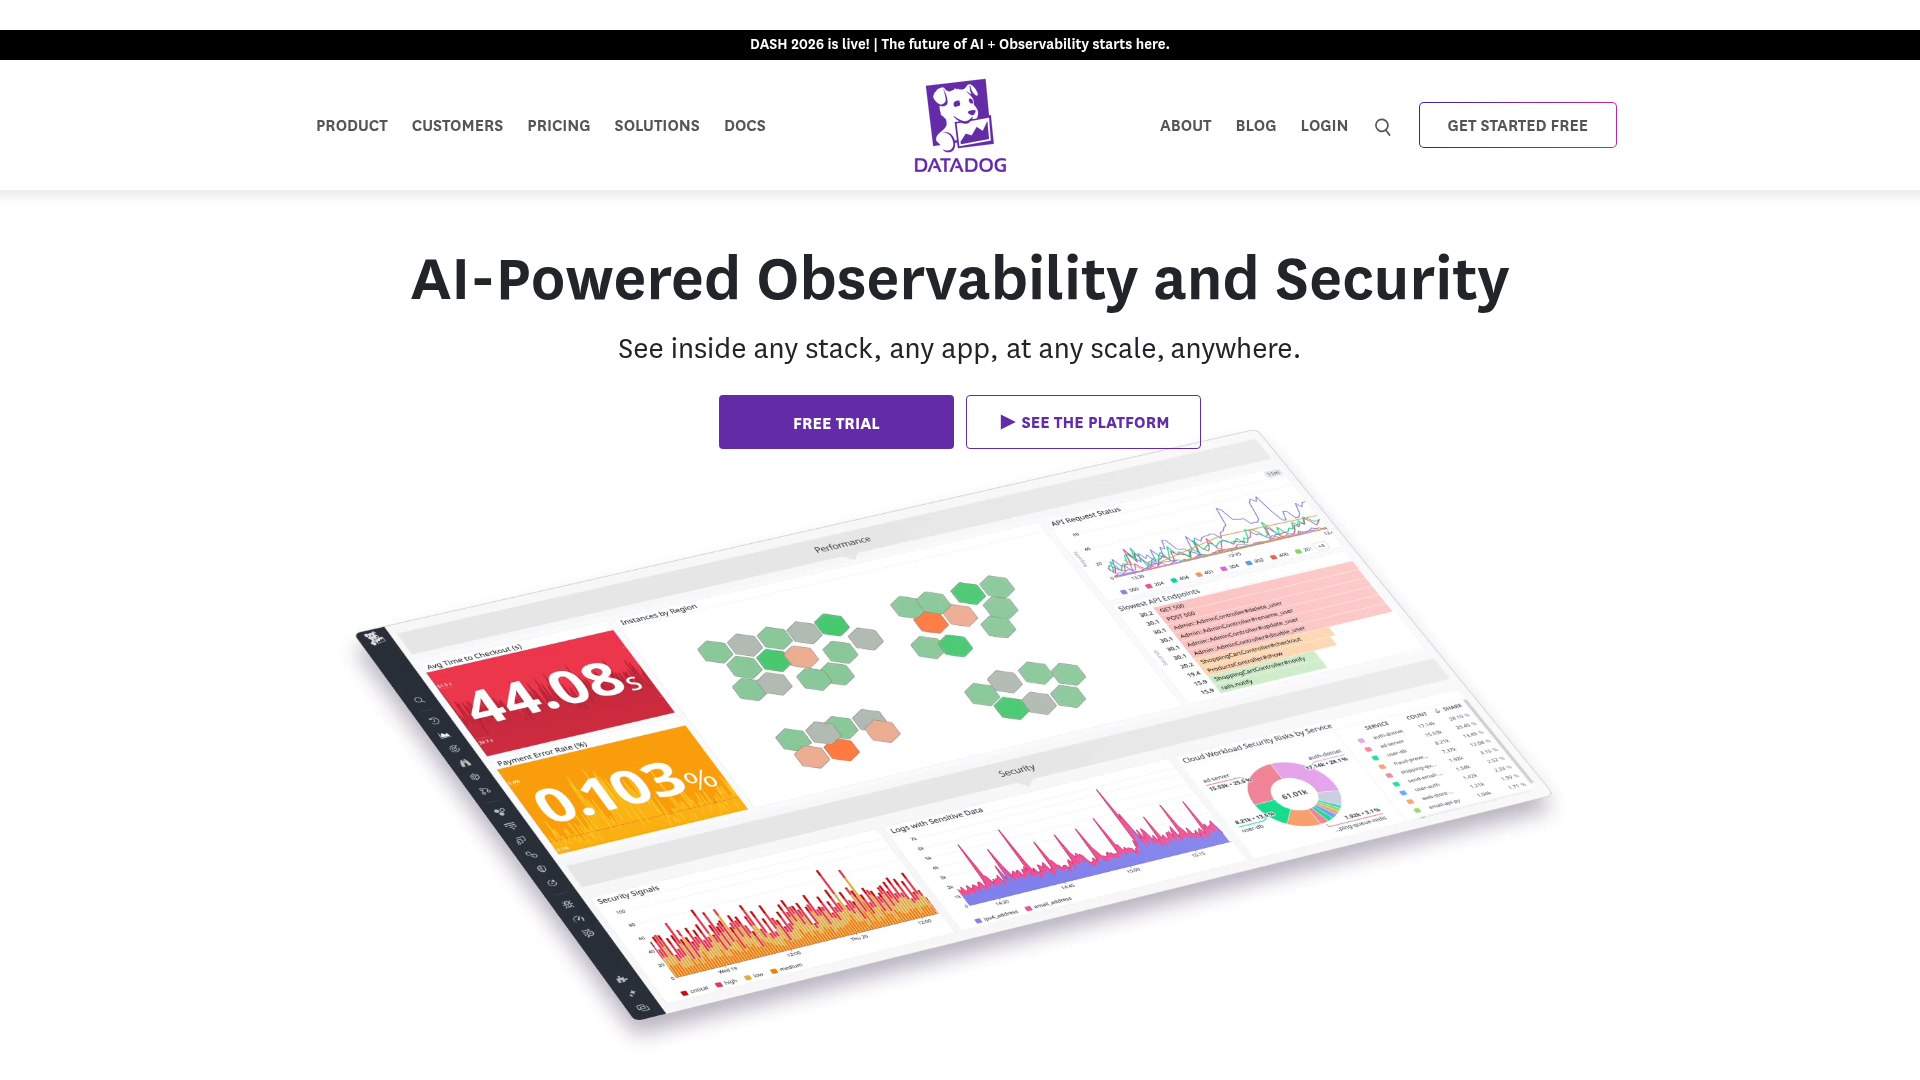
Datadog is an AI-powered observability and security platform for monitoring stacks and applications at scale. It pulls infrastructure metrics, application traces, logs, and security signals into one place, which is why so many teams default to it when they want a single pane of glass. The breadth is the pitch: rather than stitching together separate tools, you instrument once and get full-stack coverage across cloud, containers, and services.
Best for: Engineering, DevOps, and security teams that want unified observability across infrastructure, logs, applications, and security signals in one platform.
Key strengths
- Infrastructure monitoring: real-time visibility into hosts, containers, and cloud resources with auto-discovery.
- Log management: ingest, search, and correlate logs against metrics and traces in context.
- Application performance monitoring: distributed tracing and service maps that follow requests across your stack.
Why choose Datadog: Datadog fits teams that would rather pay for breadth than assemble a stack themselves. The trade-off is that its product surface is wide, and usage-based add-ons across logs, APM, and infrastructure can stack up if you do not model volume first. For teams that value one consolidated platform over piecing together best-of-breed point tools, it remains the reference standard.
Datadog pricing: Datadog uses usage-based pricing across many products. Infrastructure Pro starts at $15 per infrastructure host per month when billed annually, and Infrastructure Enterprise runs $23 per host per month. DevSecOps tiers are priced at $22 (Pro) and $34 (Enterprise) per host per month, billed annually. A free trial is available. Datadog holds a 4.4/5 rating on G2.
2. Dynatrace
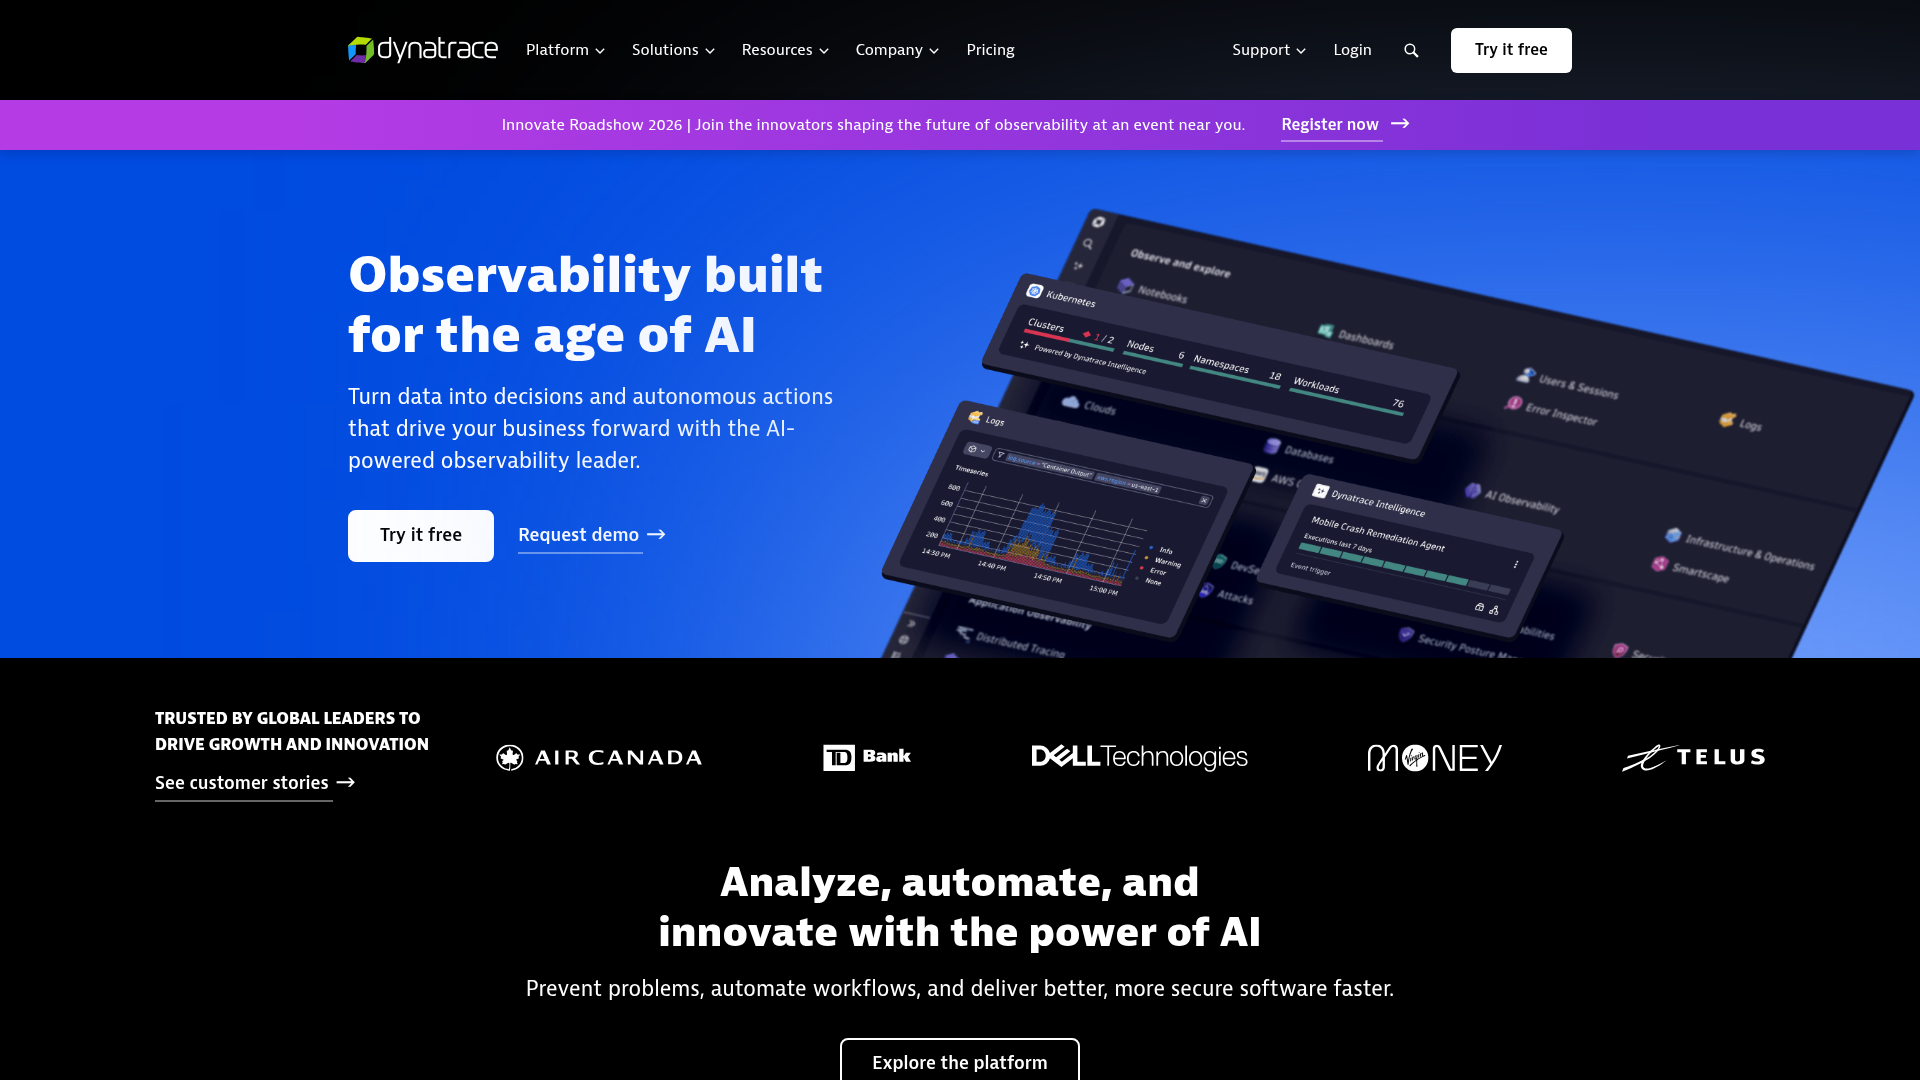
Dynatrace is an AI-powered observability platform for monitoring, analytics, automation, digital experience, and application security across complex cloud and enterprise environments. Its Davis AI engine automates anomaly detection and root-cause analysis, and Smartscape maps your topology automatically so you do not maintain dependency diagrams by hand. For large hybrid estates, the automation is the differentiator.
Best for: Enterprises needing AI-assisted full-stack observability, topology-aware analytics, and application security monitoring across large hybrid or cloud environments.
Key strengths
- AI-powered observability: Dynatrace Intelligence (Davis AI) surfaces probable root cause automatically during incidents.
- Automatic topology mapping: Smartscape discovers services and dependencies without manual configuration.
- Unified data with Grail: logs, metrics, traces, events, security, and business data queried together.
Why choose Dynatrace: Dynatrace fits enterprises that want the platform to do the correlation work rather than relying on an engineer to connect signals manually. That automation suits large, fast-changing environments where manual instrumentation would never keep up. Smaller teams may not need its depth, but at enterprise scale the automated root-cause analysis earns its place.
Dynatrace pricing: Dynatrace publishes usage-based pricing by capability. Foundation and Discovery starts at $7 per host per month, Infrastructure Monitoring at $29 per host per month, and Full-Stack Monitoring at $58 per month per 8 GiB host. Kubernetes Platform Monitoring is $1.40 per pod per month, and Real User Monitoring is $2.25 per 1,000 sessions. Volume discounts are available. Dynatrace holds a 4.5/5 rating on G2.
3. New Relic
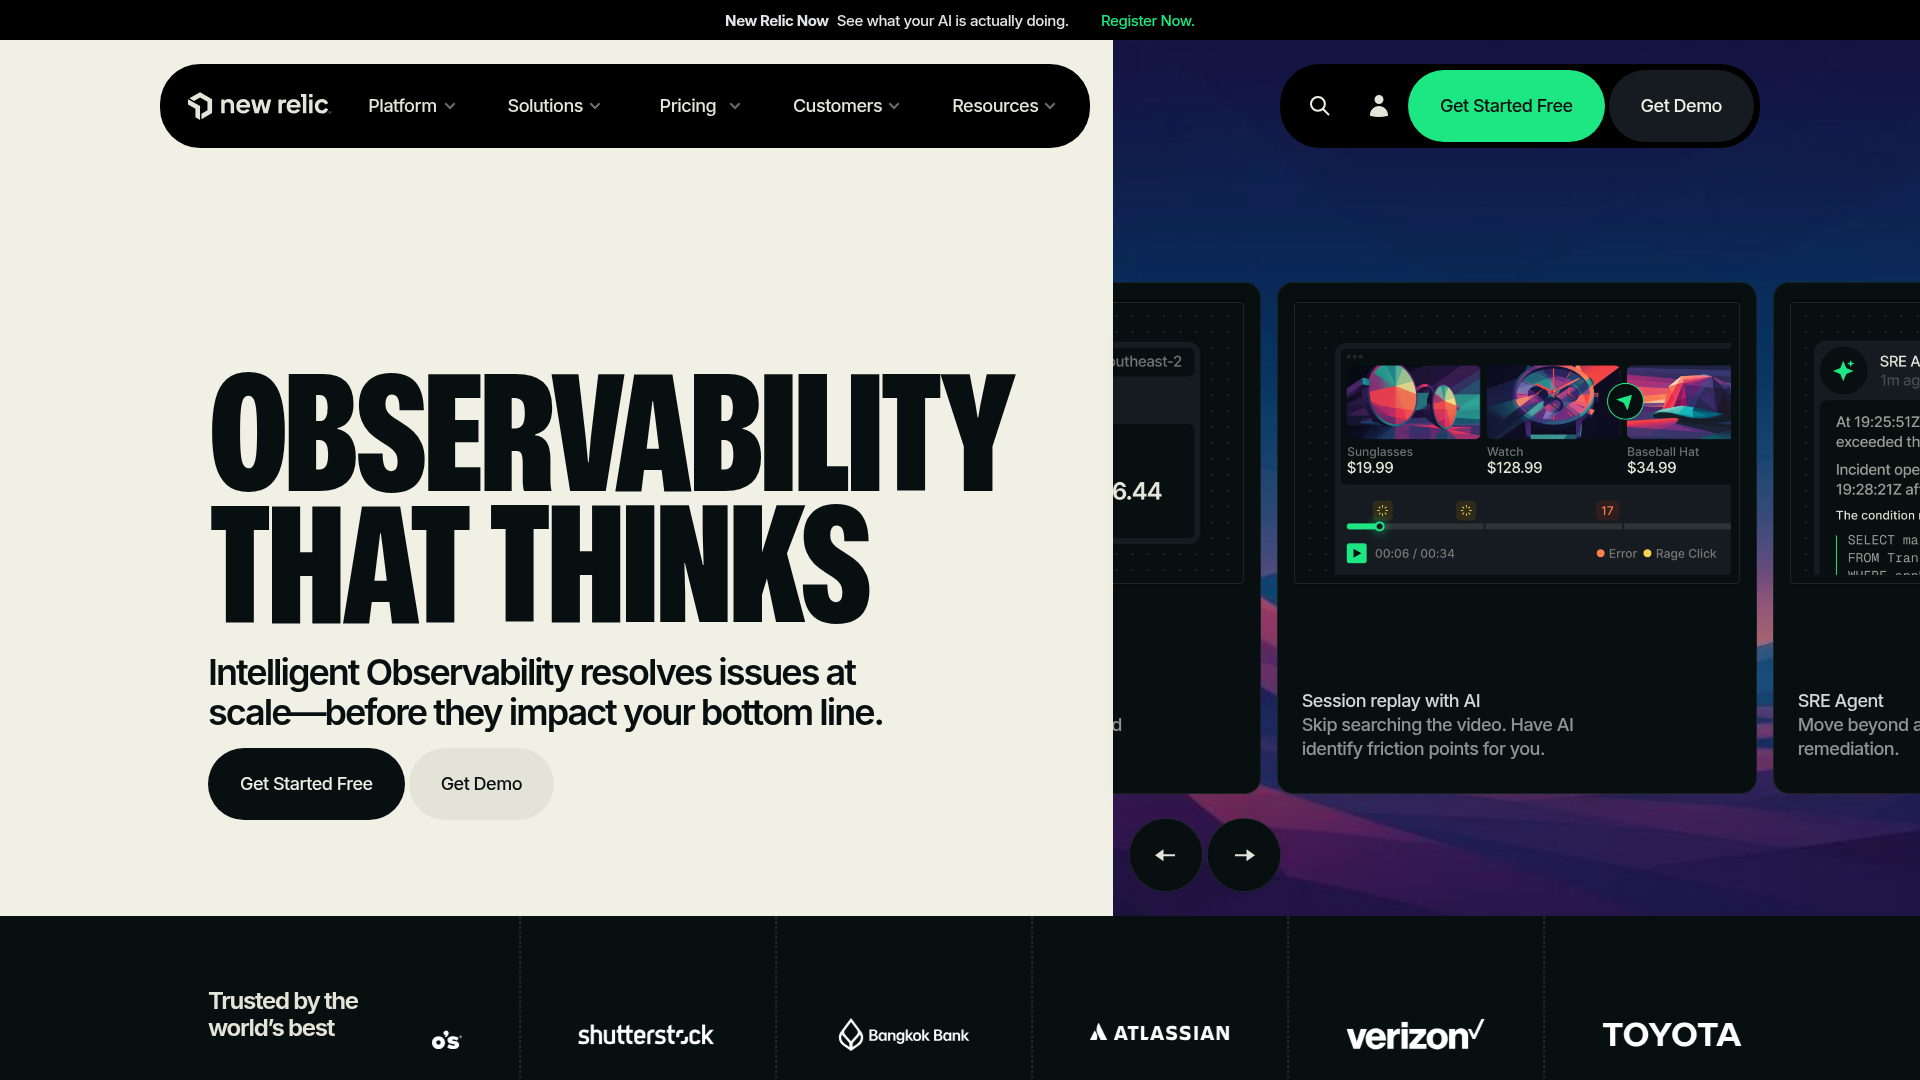
New Relic is an intelligent observability platform for monitoring, troubleshooting, and improving applications, infrastructure, logs, digital experiences, and AI workloads. Its pricing model splits the difference between data ingest and per-user charges, which appeals to teams that want predictability rather than per-host sprawl. With 780+ integrations and a genuine free tier, it lowers the barrier to getting started.
Best for: Engineering, DevOps, and SRE teams that need full-stack observability across applications, infrastructure, logs, user experience, and AI systems.
Key strengths
- APM with distributed tracing: follow transactions across services to isolate slow paths.
- Infrastructure and log management: logs-in-context tie log lines directly to the trace that produced them.
- AIOps and broad integrations: alerts, dashboards, synthetic monitoring, and 780+ integrations out of the box.
Why choose New Relic: New Relic fits teams that want to control cost through a transparent data-plus-user model rather than counting hosts. The free tier is unusually generous, which makes it a low-risk way to validate fit. Teams scaling user seats should model the full-platform user cost, since that is where the bill grows.
New Relic pricing: New Relic offers a free tier with 100 GB of monthly data ingest, one full platform user, and unlimited basic users. Beyond the free 100 GB, data ingest is $0.40 per GB. Core users are $49 each. On Standard, the first full platform user is $10 and additional users are $99; Pro lists full platform users at $349 per user on annual commitments. Enterprise is custom. New Relic holds a 4.4/5 rating on G2.
4. Grafana Cloud
Grafana Cloud is a fully managed observability platform for metrics, logs, traces, dashboards, alerting, testing, and incident response. It is built on the open-source LGTM stack: Loki for logs, Grafana for visualization, Tempo for traces, and Mimir for metrics. For teams that value open standards and dashboard flexibility, it offers a managed path without abandoning the open ecosystem.
Best for: Engineering, DevOps, and SRE teams that want a managed open observability stack for dashboards, metrics, logs, traces, alerts, and incident workflows.
Key strengths
- Managed Grafana dashboards: querying, visualization, alerting, reporting, and usage insights in one place.
- Open-standard telemetry: Prometheus, Loki, and Tempo with PromQL and LogQL plus metric-log-trace correlation.
- Pre-built integrations and collection: synthetic monitoring, Grafana Alloy telemetry collection, machine learning, and OnCall.
Why choose Grafana Cloud: Grafana Cloud fits teams that have standardized on open-source observability and want a managed backend without giving up portability. Because it builds on the same projects you could self-host, migration risk is low. Heavy users should track usage-based rates across metrics series, logs, and traces to keep spend predictable.
Grafana Cloud pricing: The Free plan includes limited usage of all Grafana Cloud services with 14 days of retention. Pro starts from $19 per month plus usage, with pay-as-you-go above the free tier, 8x5 email support, and longer retention. Enterprise starts at a $25,000 per year spend commit with premium support and custom retention. Grafana Labs holds a 4.5/5 rating on G2.
5. Prometheus
Prometheus is an open-source metrics monitoring and alerting toolkit for applications, systems, and services. It is a graduated CNCF project and the de facto standard for metrics in Kubernetes environments. Its multi-dimensional data model and PromQL query language give cloud-native teams precise control over how they collect and interrogate metrics, with no license fee attached.
Best for: Cloud-native teams that need open-source metrics collection, querying, and alerting and are comfortable running their own stack.
Key strengths
- Multi-dimensional data model: time series identified by metric name and key-value labels for flexible slicing.
- PromQL query language: query, correlate, and transform metrics with a purpose-built language.
- Alerting with Alertmanager: rule-based alerts with routing, grouping, and silencing.
Why choose Prometheus: Prometheus fits teams that want full control and zero licensing cost, and that have the engineering capacity to run and scale it themselves. It is metrics-focused, so most teams pair it with Loki, Tempo, or a managed backend for logs and traces. The payoff is an open, portable foundation that the rest of the cloud-native ecosystem assumes you are running.
Prometheus pricing: Prometheus is 100% open source and Apache 2 licensed, so there is no software license cost. Budget instead for the infrastructure and engineering time to host, scale, and maintain it. Many teams run it self-managed or pair it with a managed backend for long-term storage. Prometheus holds a 4.5/5 rating on G2.
6. Splunk Observability Cloud
Splunk Observability Cloud is a full-stack, OpenTelemetry-native observability platform for unified visibility and AI-assisted troubleshooting across applications, infrastructure, digital experiences, logs, and databases. Splunk's heritage is in log analytics at enterprise scale, and Observability Cloud extends that depth into APM, infrastructure, and real user monitoring with full-fidelity trace ingest.
Best for: Engineering and operations teams that need full-stack observability across hybrid or cloud-native environments at enterprise scale.
Key strengths
- APM with full-fidelity trace ingest: keep every trace, not a sample, for accurate service maps.
- Infrastructure monitoring: 200+ integrations, OpenTelemetry ingestion, dashboards, and real-time alerts.
- Digital experience monitoring: Real User Monitoring and Synthetic Monitoring for frontend visibility.
Why choose Splunk Observability Cloud: Splunk fits enterprises with heavy log and security analytics needs that want observability tied to that same data gravity. Full-fidelity trace ingest is a meaningful advantage for teams that cannot afford sampling gaps during investigations. A free edition for up to 15 hosts lets smaller teams try it before committing.
Splunk Observability Cloud pricing: Splunk lists separate starts-at prices by product. Infrastructure Monitoring is $15 per host per month billed annually, and Application Performance Monitoring is $55 per host per month. Real User Monitoring is $14 per 10,000 sessions, Synthetic Monitoring is $1 per 10,000 uptime requests, and Database Monitoring is $75 per database instance per month. A free edition covers up to 15 hosts. Splunk Observability Cloud holds a 4.3/5 rating on G2.
7. Amazon CloudWatch
Amazon CloudWatch is an AWS monitoring and management service for collecting metrics, logs, alarms, events, and operational insights across AWS, on-premises, hybrid, and other cloud applications and infrastructure. For teams already running on AWS, it is the native default: it collects metrics from more than 70 AWS services automatically and requires no separate vendor relationship.
Best for: AWS-centric DevOps, SRE, developer, and IT teams that need native monitoring, logging, alerting, and operational visibility for cloud infrastructure and applications.
Key strengths
- Native AWS telemetry: default metrics from 70+ AWS services plus custom metrics, with no extra integration work.
- Logs and Live Tail: centralize logs from AWS, on-premises, and other clouds in near real time.
- Dashboards and alarms: anomaly detection, Container Insights, ServiceLens, and cross-account observability.
Why choose Amazon CloudWatch: CloudWatch fits AWS-native teams that want monitoring built into the platform they already pay for, with no new contract to sign. The trade-off is depth: it covers AWS deeply but is less suited to multi-cloud observability than vendor-neutral platforms. For single-cloud AWS workloads, it is the path of least resistance.
Amazon CloudWatch pricing: CloudWatch has a free tier and usage-based paid pricing. The free tier includes 5 GB of logs data, 10 custom metrics, 1 million API requests, three custom dashboards, and 10 alarm metrics monthly. Paid usage examples include $0.30 per custom metric and $0.10 per standard-resolution alarm metric, with no upfront commitment. Pricing varies by AWS Region. Amazon CloudWatch holds a 4.3/5 rating on G2.
8. Elastic Observability
Elastic Observability is a full-stack observability platform for monitoring logs, metrics, traces, applications, and infrastructure with AI-assisted investigation and remediation. Built on the Elastic Stack, it brings search-powered analysis to telemetry, which suits teams that already run Elasticsearch and want to extend that investment into observability rather than adding a separate tool.
Best for: SRE, DevOps, and platform teams that need unified, large-scale observability across logs, metrics, traces, cloud infrastructure, and applications.
Key strengths
- Search-powered telemetry: log analytics, infrastructure monitoring, APM, and distributed tracing on a search engine core.
- OpenTelemetry-first ingestion: schema-agnostic ingest with native PromQL support.
- AI-driven investigation: root-cause analysis, agentic investigations, anomaly detection, and forecasting.
Why choose Elastic Observability: Elastic fits teams already invested in Elasticsearch who want observability on the same engine they use for search and security. The search-native model is powerful for exploring high-volume logs. Usage-based serverless pricing means cost tracks ingest and retention, so model your data volume before committing.
Elastic Observability pricing: Elastic Observability Serverless offers Logs Essentials starting as low as $0.07 per GB ingested, with retention as low as $0.017 per GB per month and 50 GB of data transfer free. The Complete tier, covering full-stack observability across logs, metrics, traces, and synthetic tests, starts as low as $0.09 per GB ingested. Add-ons include synthetic monitoring and the Elastic Managed LLM. Elastic Observability holds a 4.2/5 rating on G2.
9. Honeycomb
Honeycomb is an observability platform for engineering teams to investigate, debug, and understand production systems using unified telemetry data. Its strength is high-cardinality event analysis: where many tools struggle when you slice data by user ID, request ID, or any high-variance field, Honeycomb is built for exactly that. It is a developer-first tool for debugging the genuinely hard problems.
Best for: Engineering, SRE, and DevOps teams debugging complex production systems with logs, metrics, traces, and high-cardinality telemetry.
Key strengths
- Distributed tracing: trace requests across services with rich, queryable context.
- BubbleUp outlier analysis: automatically surface what differentiates anomalous events from normal ones.
- OpenTelemetry support: ingest open-standard telemetry without proprietary agents.
Why choose Honeycomb: Honeycomb fits engineering teams who debug production by asking sharp, high-cardinality questions rather than watching pre-built dashboards. BubbleUp is genuinely differentiated for finding the needle in a noisy haystack. Teams that mainly want infrastructure dashboards may find it more specialized than they need, but for deep debugging it stands out.
Honeycomb pricing: Honeycomb's Free plan is free forever and covers up to 20 million events per month, suited to testing and individual projects. Pro starts at $130 per month for up to 1.5 billion events per month, billed monthly or annually, and targets teams running a production application. Enterprise offers custom plans for multi-team, large-scale applications. Honeycomb holds a 4.7/5 rating on G2.
10. IBM Instana
IBM Instana is a full-stack observability platform for DevOps and engineering teams that automatically discovers and instruments applications and infrastructure. The automation is the headline: rather than manually configuring what to monitor, Instana discovers services and dependencies and instruments them itself, then captures distributed traces at full fidelity in real time.
Best for: DevOps, SRE, and platform teams that need automated full-stack observability across cloud-native applications and infrastructure.
Key strengths
- Automatic service discovery: map services and dependencies without manual configuration.
- Distributed end-to-end tracing: real-time, full-stack visibility into every request.
- Broad technology support: OpenTelemetry data collection across 300+ supported technologies.
Why choose IBM Instana: Instana fits enterprises that want automated discovery and instrumentation so teams spend less time configuring monitoring and more time resolving issues. Real-time tracing suits fast-moving production environments. There is no perpetual free tier, only a 14-day trial, so plan to evaluate inside that window.
IBM Instana pricing: Instana's SaaS Essentials tier, positioned for infrastructure monitoring, lists at USD 20 per MVS per month. The Standard tier, covering full-stack observability with code-level visibility, tracing, and log management, lists at USD 75 per MVS per month. Add-ons start at USD 0.0003 per synthetic test execution and USD 0.35 per GB for logs in context. A 14-day free trial is available. IBM Instana holds a 4.4/5 rating on G2.
11. Coralogix
Coralogix is an AI-native observability platform for logs, metrics, traces, security, AI observability, alerting, and infrastructure monitoring. Its distinguishing move is on cost: index-free, remote querying with infinite retention against your own cloud storage means you can keep telemetry long-term without the indexing bill that usually drives observability costs through the roof.
Best for: Engineering, DevOps, SRE, security, and platform teams that need full-stack observability with usage-based pricing and long-term telemetry retention.
Key strengths
- Index-free querying: remote query with infinite retention against customer cloud storage to control cost.
- Full-signal coverage: logs, metrics, traces, APM, real user monitoring, infrastructure, and SIEM.
- Cost optimization tools: cross-stack dashboards and DataPrime querying with built-in cost controls.
Why choose Coralogix: Coralogix fits teams whose observability bill is dominated by data volume and retention, and who want long-term telemetry without indexing penalties. The single usage-based model (no tier gating on features or support) keeps pricing simple. Teams comfortable with its DataPrime query approach get strong cost control as data grows.
Coralogix pricing: Coralogix states there are no separate pricing tiers: customers pay by data usage with all features and support included. Headline rates are $0.42 per GB for logs, $0.16 per GB for traces, $0.05 per GB for metrics, and $1.50 per 1M tokens for AI. Every account includes 24/7 human support, unlimited sources, and unlimited users and hosts. A 14-day free trial is available. Coralogix holds a 4.6/5 rating on G2.
12. Middleware
Middleware is a full-stack observability platform that detects issues from infrastructure, APM, and RUM and resolves them using an AI SRE agent. It is OpenTelemetry-based and positioned around cost efficiency, which makes it a strong fit for cloud-native teams that want unified observability without enterprise-tier pricing. The OpsAI SRE agent adds automated detection and remediation on top of the telemetry layer.
Best for: Engineering, SRE, and platform teams that need unified observability with AI-assisted incident detection and remediation.
Key strengths
- Unified telemetry: infrastructure monitoring, APM, log monitoring, RUM, and synthetic monitoring in one place.
- OpsAI SRE agent: AI-assisted detection and remediation across logs, metrics, and traces.
- OpenTelemetry-based: open-standard ingestion that avoids proprietary lock-in.
Why choose Middleware: Middleware fits cost-conscious cloud-native teams that want full-stack observability on open standards with usage-based pricing. The OpsAI SRE agent is a genuine differentiator for smaller teams without a large on-call rotation. The free access is a 14-day trial rather than a permanent free plan, so plan your evaluation accordingly.
Middleware pricing: Middleware offers three tiers. The Free Trial includes all features for 14 days. Pay As You Go is usage-based, starting at $0.30 per GB of metrics, logs, and traces, so you pay only for what you use. Enterprise is custom priced with volume discounts and premium support. Middleware holds a 4.7/5 rating on G2.
How to choose observability software: buyer considerations
Pricing and feature lists only get you so far. These are the criteria that separate a tool that fits from one that frustrates six months in.
Telemetry coverage and OpenTelemetry support
Confirm the platform ingests all three signals you care about: logs, metrics, and traces. Just as important, check OpenTelemetry support. Open-standard instrumentation means you can switch backends later without re-instrumenting your entire stack, which is the single biggest protection against vendor lock-in.
Pricing model and data-volume costs
Most observability platforms bill on ingestion or usage, so costs scale with telemetry volume. This is where teams get surprised. Before committing, estimate your monthly log, metric, and trace volume and model the bill at that volume, not at the entry tier. Ask vendors how overages are charged.
Integrations and stack fit
Check the integrations that matter for your environment: cloud providers, CI/CD pipelines, alerting tools like PagerDuty or Opsgenie, and Kubernetes support. The right tool fits the stack you already run rather than forcing you to rebuild around it. Native cloud integrations save real configuration time. The same principle applies when you evaluate any platform's integration ecosystem before committing.
Scalability and data retention
Verify the platform handles your telemetry volume from today's scale through where you expect to be in two years, without performance degradation. Retention matters too: how long can you keep data, and what does long-term retention cost? Index-free or tiered storage models change the math significantly.
Time-to-value and instrumentation effort
Auto-instrumentation gets you to first insight faster than manual setup. Ask how long until the platform produces a meaningful answer, not just ingests data. For teams with limited engineering bandwidth, automated discovery and instrumentation can be the deciding factor. Vendors that let you preview the workflow through a live demo make this far easier to assess before you instrument anything.
Conclusion
The right observability platform depends less on which tool is "best" and more on which fits your stack, telemetry volume, and team workflow. For full-stack enterprise coverage in one platform, Datadog and Splunk Observability Cloud lead. For AI-driven automation at enterprise scale, Dynatrace and IBM Instana stand out. Teams committed to open standards gravitate to Grafana Cloud and Prometheus, while AWS-native shops default to Amazon CloudWatch. Developer-first debugging belongs to Honeycomb, and cost-conscious cloud-native teams should weigh Coralogix, Middleware, and Elastic Observability.
The next step is concrete. Shortlist two or three tools from this list that match your stack and budget. Then run a proof of concept against your real telemetry volume, not a synthetic demo, and evaluate each against your actual incident workflows. Pay close attention to what the bill looks like at production data volumes. The tool that surfaces root cause fastest during a real incident, at a cost you can predict, is the one worth buying. If you are on the other side of that conversation building these evaluations, our guides to the best product analytics software tools and the best session replay software tools cover adjacent tooling that often sits alongside observability in a modern stack.
FAQs
Monitoring tracks predefined metrics and tells you when something breaks based on thresholds you set in advance. Observability lets you explore unknown problems by querying rich telemetry, so you can understand why something broke even if you never anticipated that failure. Monitoring is essentially a subset of what observability delivers.
The three pillars are logs (timestamped records of discrete events), metrics (numerical measurements over time), and traces (the path of a request across services). Together they give full context on system behavior. Some practitioners argue the model should expand to include profiling and events, but logs, metrics, and traces remain the core.
No. APM (application performance monitoring) is a subset of observability focused specifically on application performance, such as response times and error rates. Observability is broader, covering infrastructure, logs, distributed traces, and user experience across the entire system. Most modern observability platforms include APM as one capability among several.
Most observability software uses usage-based or ingestion-based pricing, so costs scale with the volume of logs, metrics, and traces you send. Entry points range from free open-source tools like Prometheus to free tiers from New Relic and Amazon CloudWatch, up to enterprise contracts. Because billing tracks data volume, model your telemetry volume before committing to avoid surprises.
OpenTelemetry is an open-source, CNCF-hosted standard for collecting telemetry data (metrics, logs, and traces). It abstracts data collection away from any single vendor, so you can switch observability backends without re-instrumenting your applications. Because most major platforms support it, OpenTelemetry is the strongest available defense against vendor lock-in.
For Kubernetes, cloud-native and open-source tools fit best. Prometheus is the CNCF metrics standard and integrates tightly with Kubernetes, while Grafana Cloud and Middleware offer managed, OpenTelemetry-based observability suited to ephemeral container workloads. The right pick depends on whether you want to self-host or use a managed platform.
Yes. By correlating logs, metrics, and traces and applying anomaly detection, observability software speeds up root-cause analysis and reduces mean-time-to-resolution during incidents. Faster diagnosis means shorter outages. Many platforms also forecast problems before they cause downtime, which shifts teams from reactive firefighting toward proactive prevention.
Logging alone shows isolated events but cannot tell you how they connect across services. Observability software correlates logs with metrics and traces to give full-system context, which matters most in distributed systems where a single request crosses many services. If you run microservices or Kubernetes, logging by itself usually is not enough.