

An API rarely announces its own failure. It just gets slower. A p95 latency creeps from 120ms to 900ms, a downstream dependency starts throttling you, an error rate climbs from 0.1% to 4%, and none of it shows up until a customer opens a ticket or a deal stalls in a technical review. By then you are debugging in reverse, reconstructing what broke from logs that may or may not have captured it.
That gap between "something is wrong" and "we know what and why" is where API monitoring tools earn their place. The stakes are only getting higher. The broader application metrics and monitoring tools market is expected to grow from roughly USD 14.3 billion in 2026 to around USD 42 billion by 2036, a 11.3% CAGR, according to Future Market Insights (2024). More services, more dependencies, more surface area to watch.
For presales and technical teams, this is not just an ops concern. When a prospect's engineering lead asks how you handle uptime, latency, and incident response, you need real answers backed by real telemetry. The same visibility that keeps production healthy also builds buying confidence during technical validation. If you are also mapping the wider stack, our roundup of application performance monitoring tools pairs well with this one.
This guide is built for people who have to prove reliability, not just claim it.
What's inside
This is a shortlist of nine API monitoring tools for 2026, spanning four practical categories: full-stack observability platforms, synthetic and uptime monitoring, application performance monitoring (APM), and open-source, OpenTelemetry-native stacks you can self-host.
We selected tools based on four criteria that matter in production:
- Production fit: does it monitor real API traffic, not just synthetic pings?
- Alerting quality: can it catch latency spikes, error rates, and throughput drops before customers do?
- Integrations: does it plug into your existing logs, metrics, traces, and incident workflows?
- Scalability: does it hold up from a single service to a sprawling microservices estate?
Every entry includes verified pricing where public, a G2 rating where available, and honest guidance on who each tool actually fits.
TL;DR
- Best for API analytics plus monetization: Moesif, if you need usage insight and billing in one platform.
- Best for unified enterprise observability: Datadog, when you are already standardized on infrastructure monitoring.
- Best for full-stack correlation: New Relic, for teams balancing product and infrastructure visibility.
- Best OpenTelemetry-native cloud option: Uptrace or SigNoz, depending on whether you want managed or self-hosted.
- Best for uptime and incident response: Better Stack, for a fast path to operational visibility.
- Best open-source metrics foundation: Prometheus paired with Grafana for dashboards and alerting.
- Best for large-scale governance and compliance: Splunk Observability Cloud.
What is API monitoring?
API monitoring is the continuous observation of an API's availability, performance, and correctness in production so teams can detect and diagnose failures before they reach users.
Good API monitoring watches a specific set of signals:
- Uptime and availability: is the endpoint reachable and returning valid responses?
- Latency and response time: how long does each request take, measured at p50, p95, and p99?
- Error rate: what percentage of requests return 4xx or 5xx status codes?
- Throughput and request rate: how many requests per second is the API handling, and is that changing?
- Data validation: is the response body correct, not just a 200 with garbage inside?
- Dependency health: are the third-party APIs and microservices you rely on holding up?
- Security signals: unusual traffic patterns, auth failures, or rate-limit breaches.
The three pillars of API observability are logs, metrics, and traces. Logs tell you what happened. Metrics tell you how much and how often. Traces tell you where a request went and where it slowed down. Strong tools correlate all three so you can move from an alert to a root cause without jumping between five tabs.
Monitoring is not testing. API testing validates behavior before you ship, in CI/CD or a staging environment, with assertions about expected responses. API monitoring watches the same behavior in production, continuously, on live traffic. Testing asks "does this work?" once. Monitoring asks "is this still working?" forever. You need both, and the best synthetic monitoring blurs the line by running test-like checks against production on a schedule.
When to use API monitoring tools
Detect failures before customers do
Production alerting is the core job. A monitoring tool watches your error rate, latency, and throughput against thresholds or SLOs, then fires an alert the moment something drifts. The value is speed: catching a 5xx spike at 2% instead of finding out at 2pm when support escalates. Well-tuned API monitoring alerts cut mean time to resolution (MTTR) because you start diagnosing from a specific signal, not a vague "the app feels slow" report. Pair alerting with traces and you go from notification to root cause in minutes, not hours.
Prove reliability during technical evaluation
For presales and sales engineers, monitoring is a trust instrument. When a prospect's security or platform team asks about uptime history, incident response, and SLA adherence, dashboards and historical metrics answer the question with evidence. This matters in the same moments you would reach for hands-on validation, whether that is a technical deep-dive, a security review, or a proof-of-concept. Demonstrating that you actually watch your APIs, and can show the numbers, removes a common late-stage objection and keeps deals moving.
Track third-party and microservice dependencies
Modern systems fail at the seams. Your own API might be healthy while a payment provider, geocoding service, or internal auth microservice quietly degrades. API monitoring gives you visibility into both internal and external dependencies, so you can see when a third-party API starts throttling you or when a downstream service blows its latency budget. Look for broad protocol coverage (REST, GraphQL, gRPC), rate-limiting awareness, and distributed tracing that follows a request across service boundaries.
Comparison table
The table below summarizes all nine tools. Read "Intent" as the primary job each tool is built for, and "Key differentiation" as the reason to pick it over a similar option. Pricing reflects publicly listed starting figures verified in July 2026; G2 ratings are shown where a current listing exists.
| # | Product | Intent | Key differentiation | Pricing | G2 rating |
|---|---|---|---|---|---|
| 1 | Moesif | API analytics + monitoring | Usage-based billing built into observability | Free tier; pay-as-you-go | 4.5/5 |
| 2 | Datadog | Unified observability | Broad platform across infra, APM, logs, synthetics | From $15/host/mo (annual) | 4.4/5 |
| 3 | New Relic | Full-stack observability | Usage-based pricing with generous free tier | Free; Standard from $10/first user/mo | 4.4/5 |
| 4 | Uptrace | OpenTelemetry observability | Traces, logs, metrics in one OTel-native tool | 50 GB free/mo; from $0.075/GB | Not listed |
| 5 | Better Stack | Uptime + incident response | Fast operational visibility with on-call | Free tier; Uptime from $25/mo | 4.8/5 |
| 6 | SigNoz | Open-source observability | OTel-native, self-host or cloud | Community free; Teams from $49/mo | Not listed |
| 7 | Prometheus | Metrics + alerting | Open-source standard for time-series metrics | Free, open source | Not listed |
| 8 | Grafana | Dashboards + visualization | Query and visualize across many data sources | Free; Pro from $19/mo + usage | 4.5/5 |
| 9 | Splunk Observability Cloud | Enterprise observability | Full-stack, no data sampling, AI-assisted | Infra from $15/host/mo (annual) | 4.3/5 |
The 9 best API monitoring tools for 2026
1. Moesif
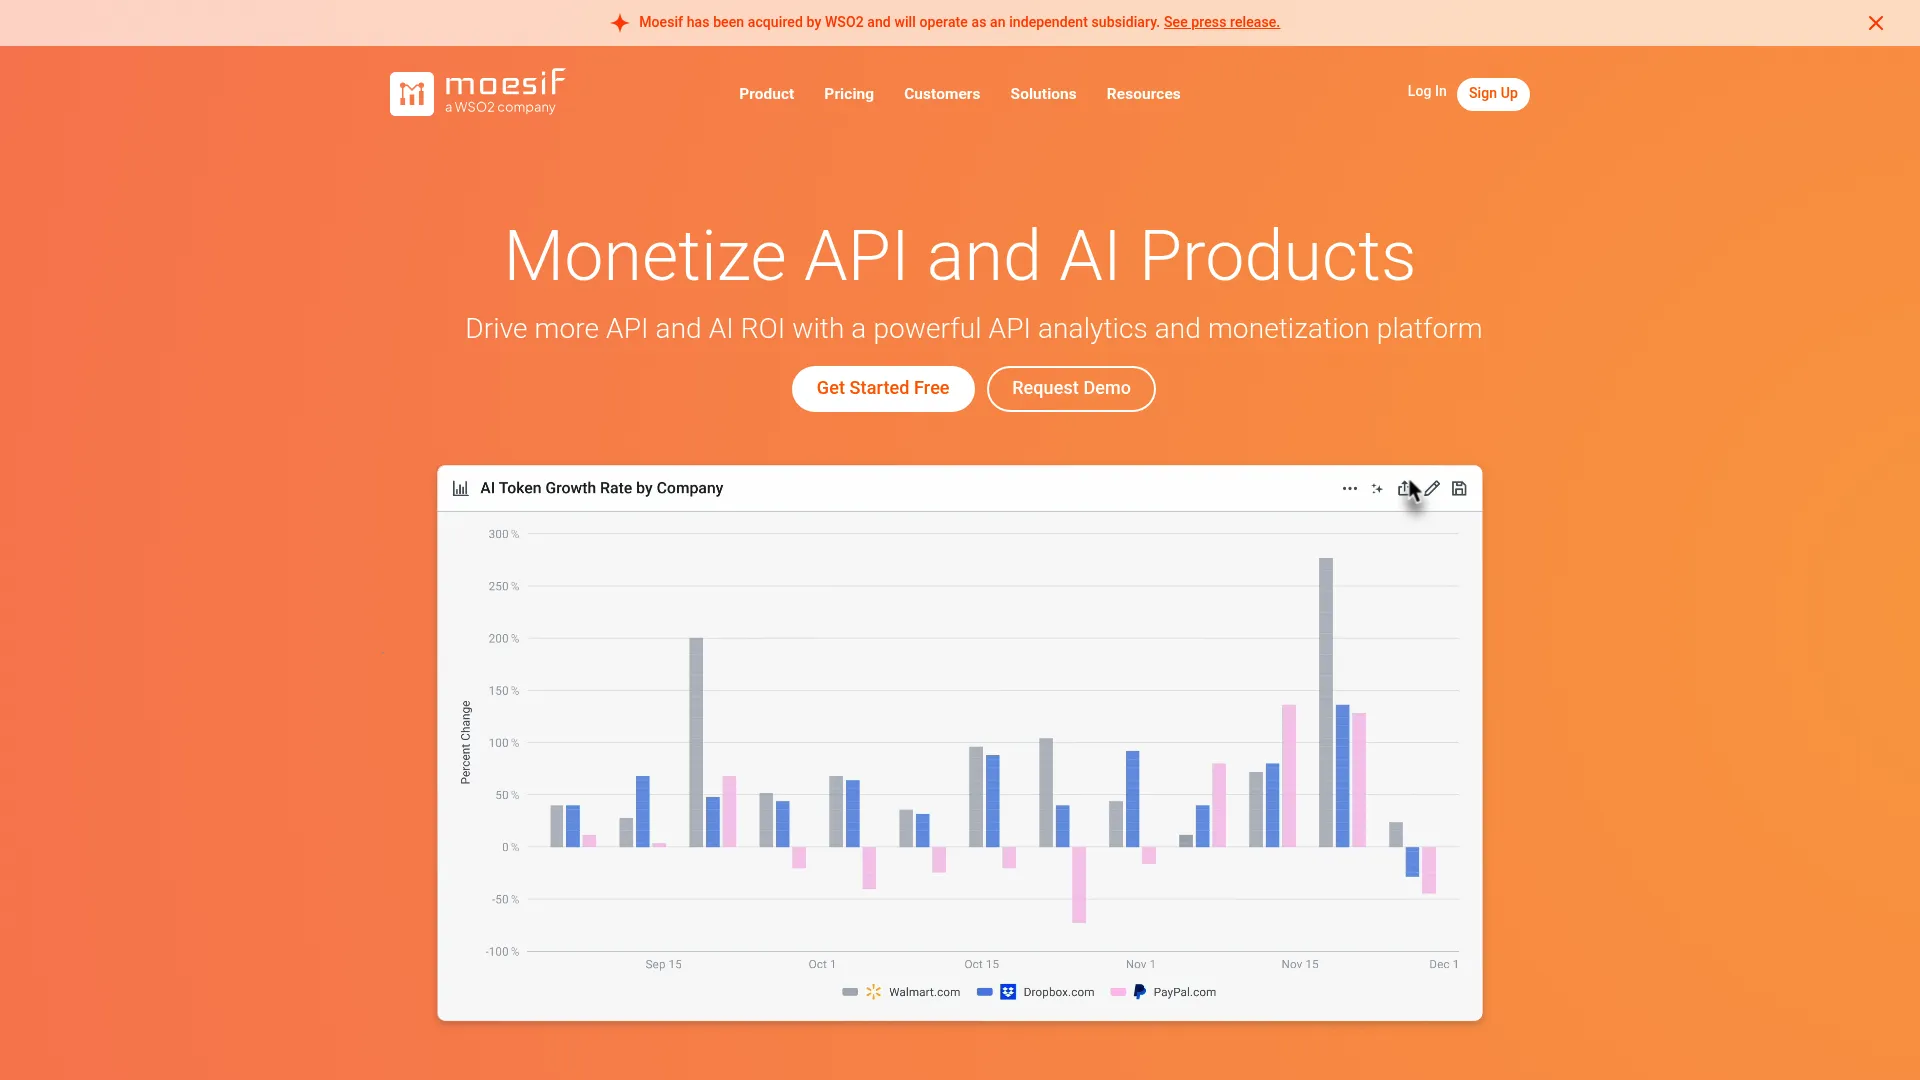
Moesif is an API analytics and monitoring platform built for teams that ship APIs as a product. Instead of treating API traffic purely as infrastructure telemetry, Moesif treats it as behavioral data: who is calling which endpoints, how usage trends over time, and where customers hit friction. That framing makes it a strong fit for API-first companies and developer platforms where usage and revenue are tied together.
Best for: API product teams that need observability and usage-based monetization in one place.
Key strengths
- API analytics: Track endpoint usage, adoption, and customer behavior at a granular level.
- API monitoring: Watch error rates, latency, and anomalies across live API traffic.
- Usage-based billing: Turn tracked usage into metering and billing without a separate system.
Why choose Moesif: If your API is your product, you care about more than uptime. You care about which customers are ramping usage, which endpoints are underused, and where developers abandon integration. Moesif answers those questions alongside standard monitoring, which is rare in this category. It fits API platform, fintech, and infrastructure teams that need analytics and monetization signals in the same view.
Moesif pricing: Moesif offers a Free plan and simple pay-as-you-go pricing. The 14-day trial converts to Free and includes Growth plan features plus 10 million events. Additional team members are listed at $75 per month. A public numeric base price for paid tiers is not published on the pricing page, so confirm current figures with Moesif directly. It holds a 4.5/5 rating on G2.
2. Datadog
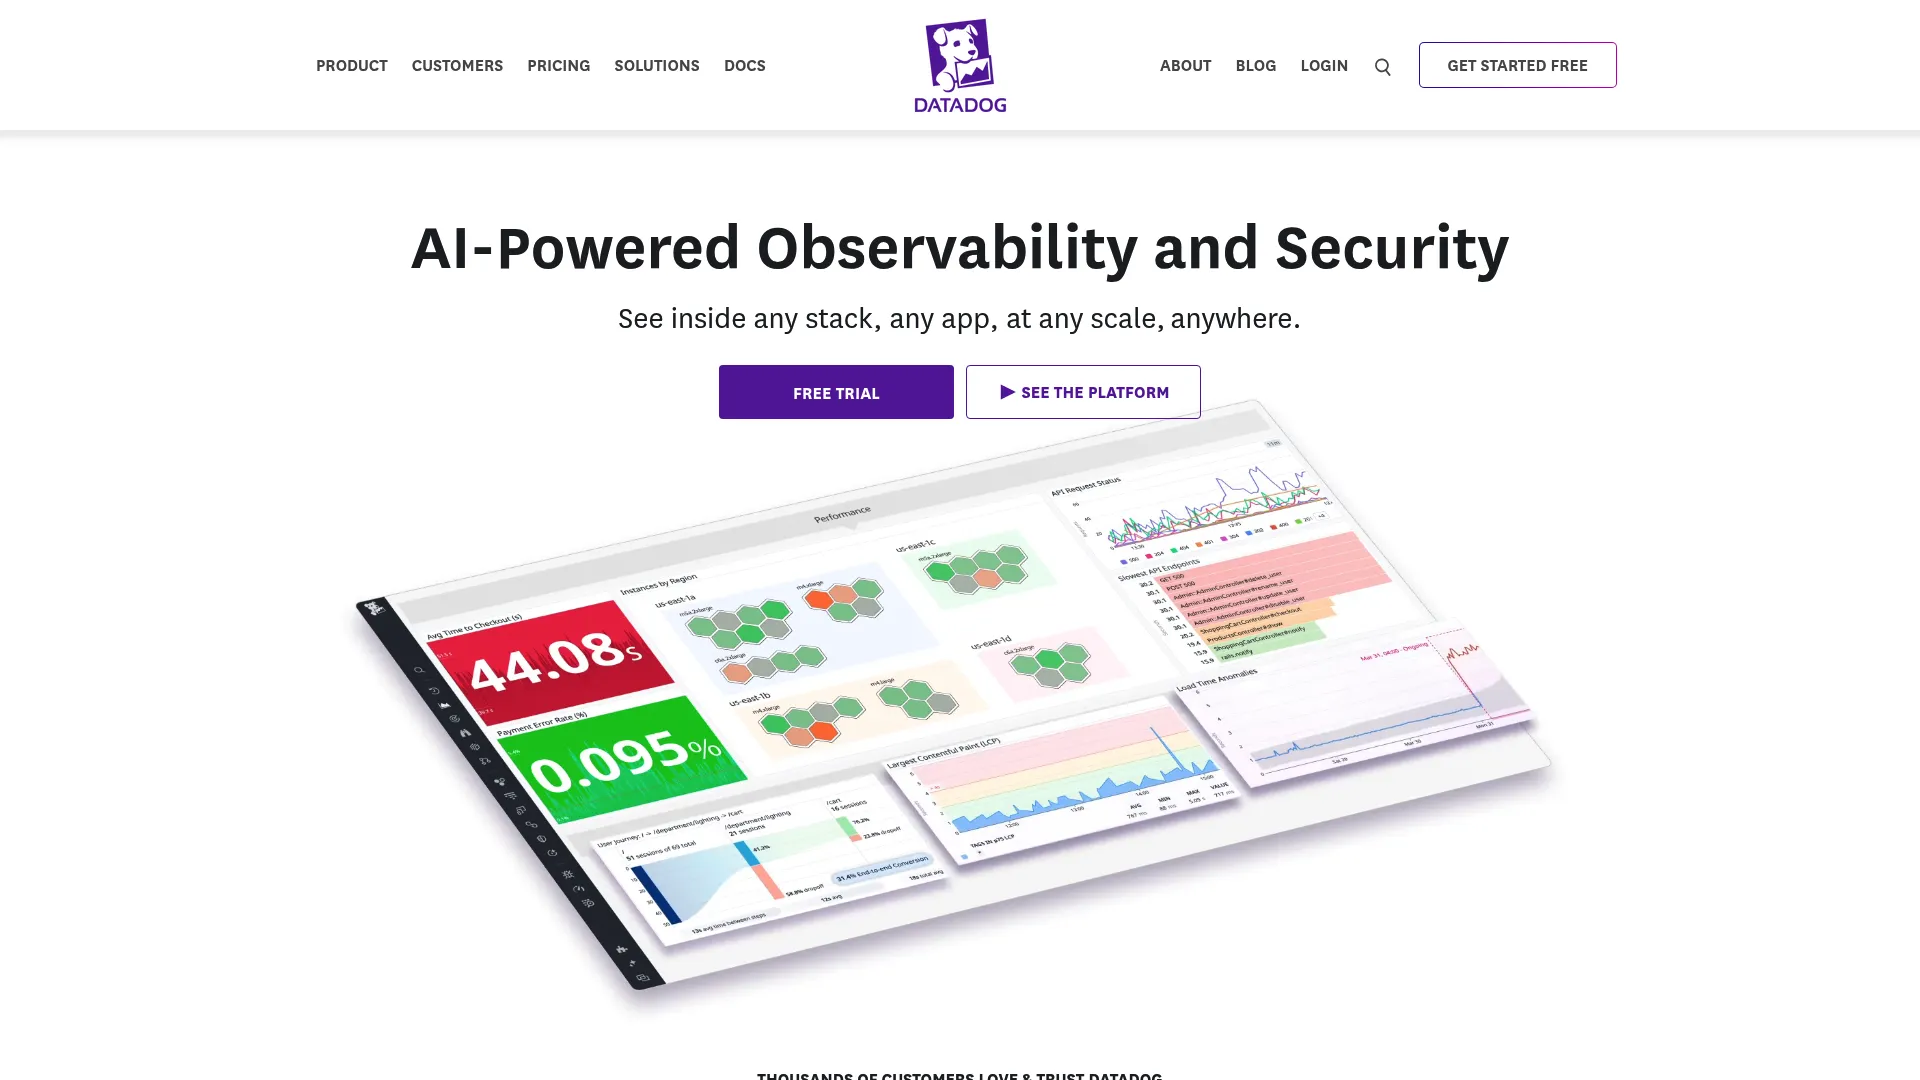
Datadog is a cloud monitoring and security platform that spans infrastructure, applications, logs, and user experience. For API monitoring specifically, it combines distributed tracing, APM, and synthetic monitoring, so you can watch a request from the edge through every service it touches. Teams already standardized on Datadog for infrastructure get API visibility without adding another vendor.
Best for: Teams that want unified observability and security across the whole stack.
Key strengths
- Infrastructure monitoring: Metrics, visualizations, and alerting across hosts and containers.
- Distributed tracing and APM: Follow requests across services with logs and traces correlated.
- Synthetic and user experience monitoring: Run scheduled API tests and track real user impact.
Why choose Datadog: The strength here is breadth. If you want one platform that correlates API latency with infrastructure load, log errors, and downstream service health, Datadog covers it. That consolidation is valuable for teams tired of stitching signals across tools. The trade-off is that usage-based pricing across many products can add up, so watch your ingest.
Datadog pricing: Infrastructure Pro starts at $15 per host per month billed annually, with Infrastructure Enterprise at $23. DevSecOps tiers run $22 and $34 per host per month. Datadog publishes many product-specific prices and offers a 14-day free trial. It holds a 4.4/5 rating on G2.
3. New Relic
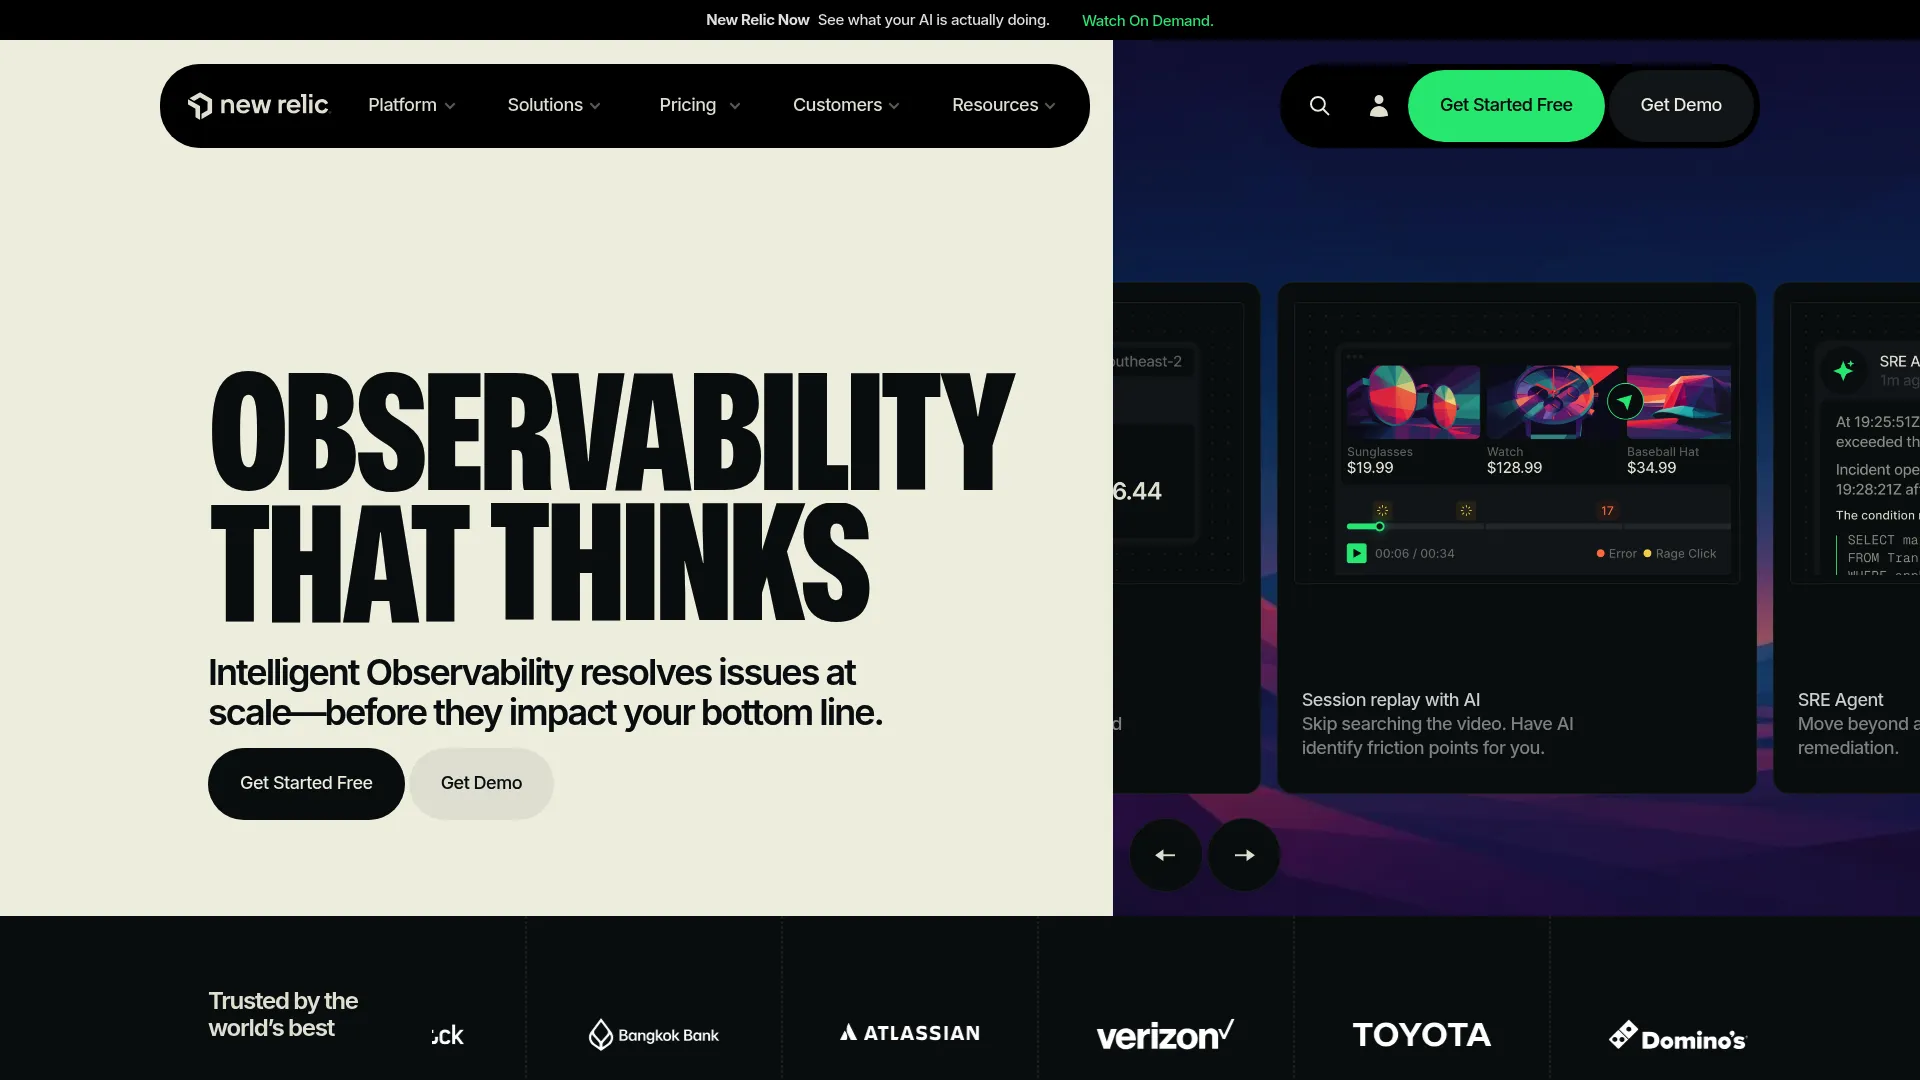
New Relic is a full-stack observability platform that combines APM, infrastructure and log monitoring, and digital experience monitoring in one place. Its usage-based pricing model, priced on data ingest and users rather than per host, appeals to teams that want to scale monitoring without seat-count anxiety. For API monitoring, the value is cross-layer correlation: linking an API error to the exact code path, host, or dependency that caused it.
Best for: Teams that need to balance product and infrastructure visibility under one bill.
Key strengths
- Application performance monitoring: Trace transactions down to slow queries and code paths.
- Infrastructure and log monitoring: Correlate API behavior with host health and log events.
- Digital experience monitoring: Browser, mobile, and synthetic monitoring for end-to-end coverage.
Why choose New Relic: The pricing structure is the differentiator. A free tier with 100 GB of ingest and one full platform user lets small teams monitor real production traffic at no cost, and the model scales on data rather than hosts. That suits teams whose service count grows faster than their budget.
New Relic pricing: The Free tier is $0 and includes 100 GB of data ingest plus one full platform user. Standard starts at $10 for the first user per month. Pro runs $349 per user on annual commitments, and Enterprise is custom. Data ingest beyond the free allowance is $0.40/GB, or $0.60/GB for Data Plus. It holds a 4.4/5 rating on G2.
4. Uptrace
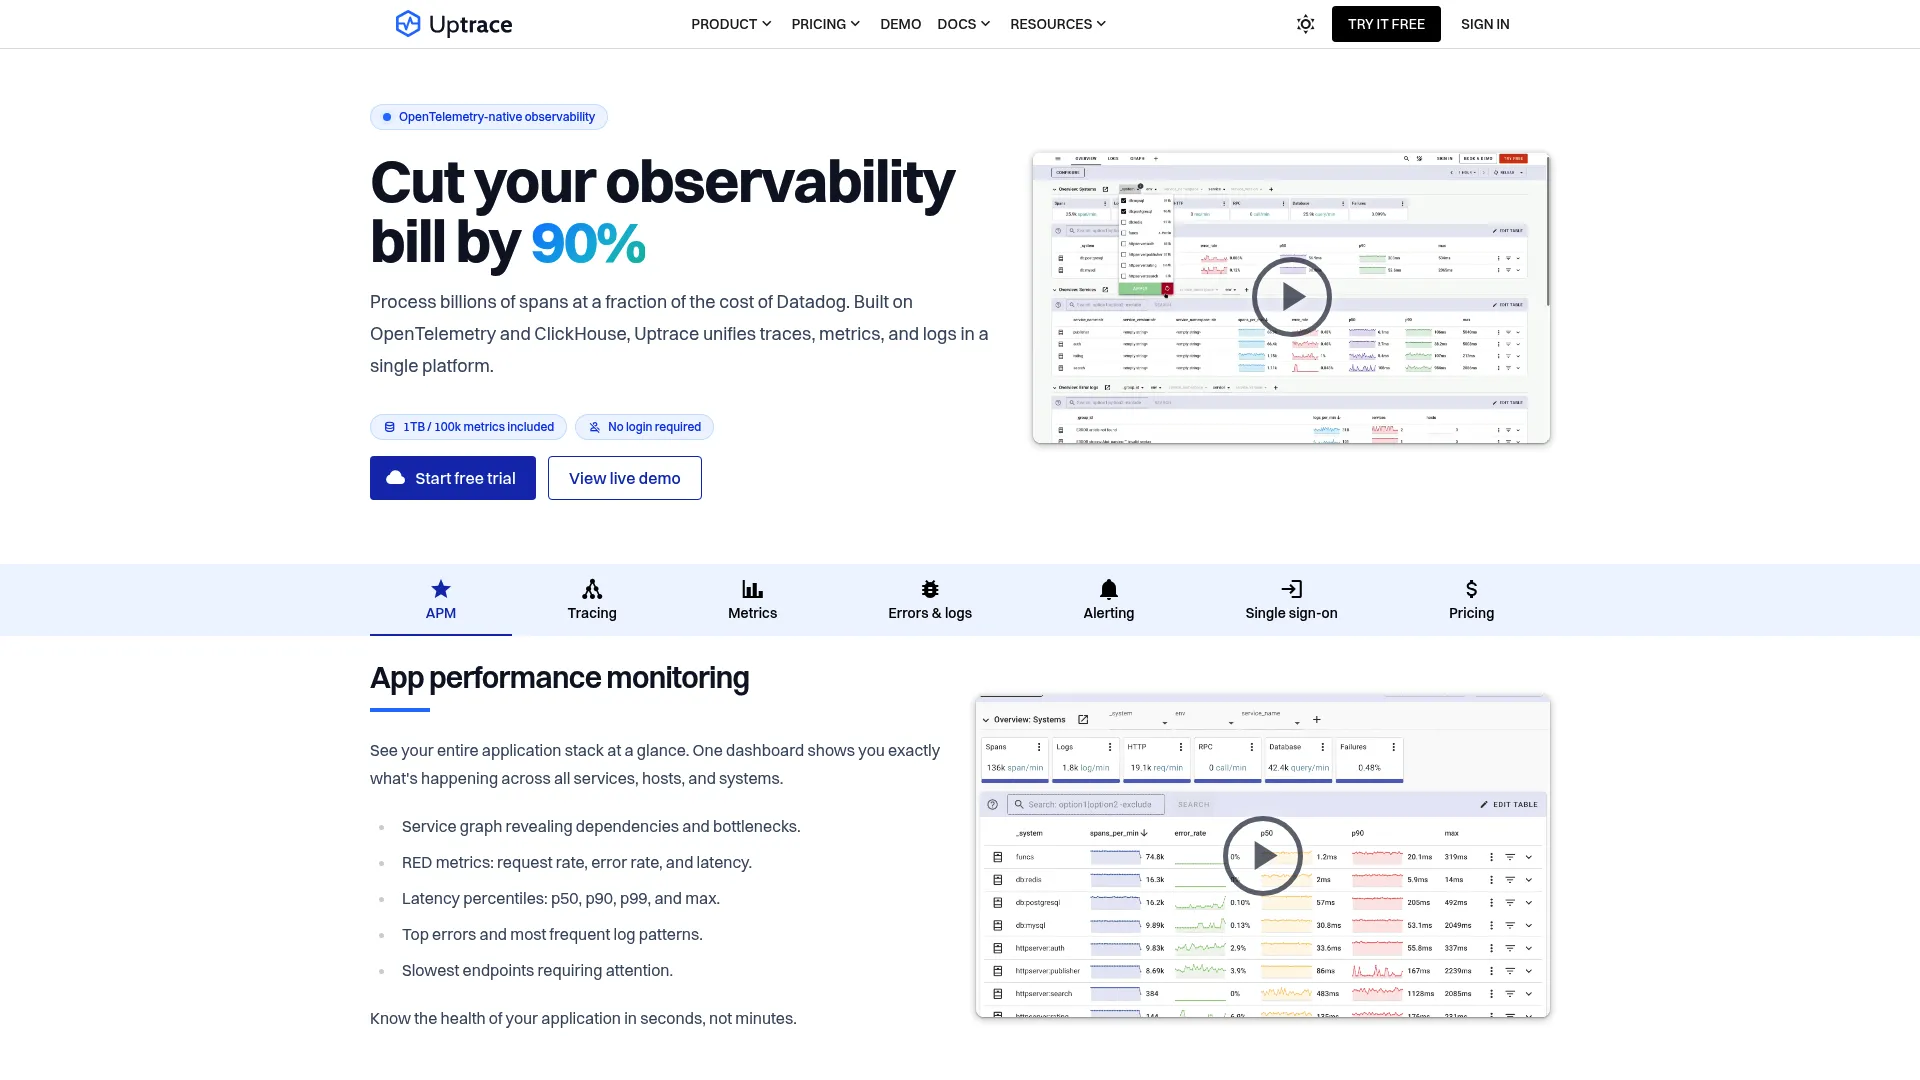
Uptrace is an OpenTelemetry-native observability platform that unifies traces, logs, and metrics. Because it is built on OTel, instrumenting your APIs uses open standards rather than a proprietary agent, which keeps you flexible if you switch tools later. The trace waterfall and span detail make it easy to see exactly where an API request spends its time.
Best for: Engineering teams that want one OpenTelemetry-based tool for traces, logs, metrics, and alerting.
Key strengths
- Distributed tracing: Trace waterfall and span detail pinpoint latency across services.
- Unified telemetry: Logs, errors, and metrics live in one platform.
- Operational features: Dashboards, alerting, service graph, querying, and SSO.
Why choose Uptrace: If you have committed to OpenTelemetry, Uptrace lets you get API observability without heavyweight complexity or vendor lock-in. The trace-first approach is well suited to microservice architectures where a single API call fans out to many downstream services. Both cloud and on-premises options exist, so you can pick based on data-residency needs.
Uptrace pricing: Cloud pricing includes 50 GB of traces, logs, and metrics free every month, then usage-based rates from $0.075/GB. A 14-day cloud free trial requires no credit card. On-premises pricing has a $1,000 per month minimum plus separate hosting costs. A current G2 rating was not available at writing time.
5. Better Stack
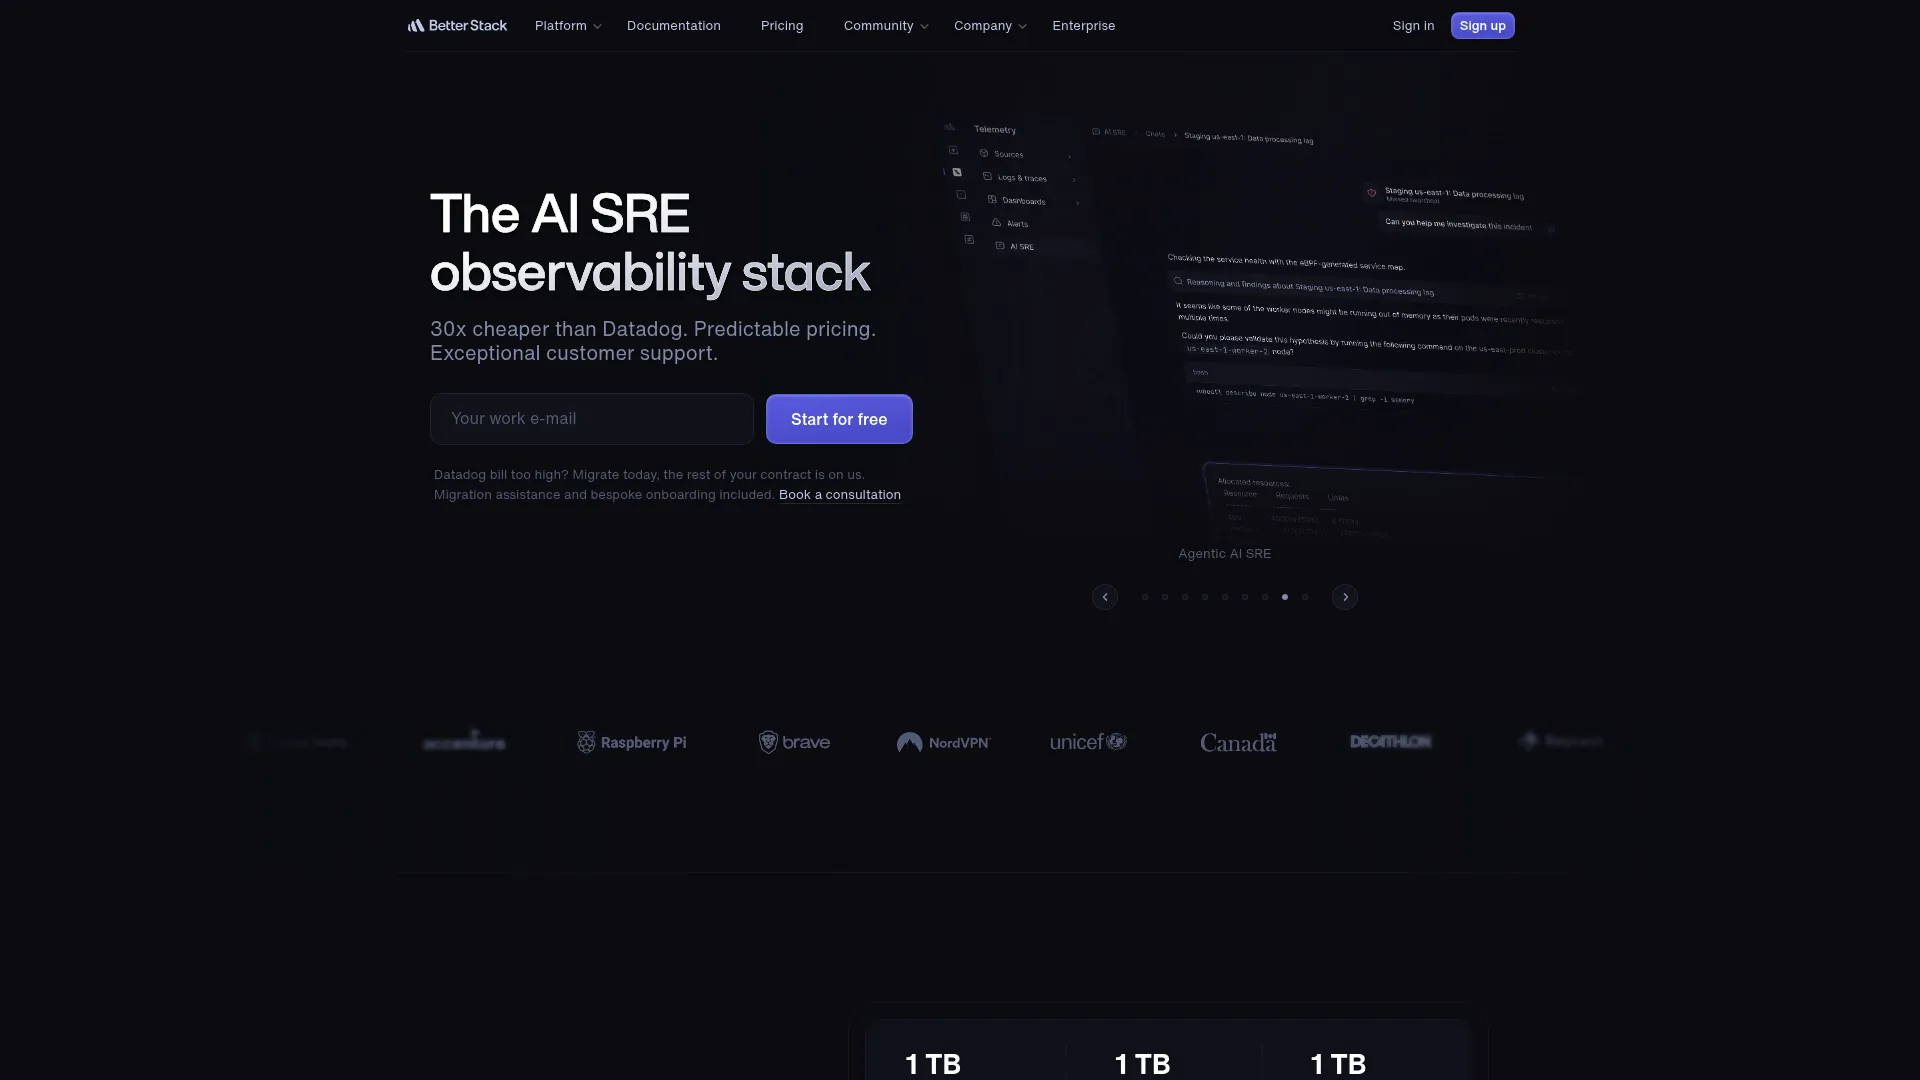
Better Stack combines uptime monitoring, logs and traces, and incident management in one platform. For teams that want a fast path to operational visibility, it hits the essentials: monitor an endpoint, get alerted when it breaks, and route the incident to the right on-call engineer. The uptime monitoring is straightforward to set up, which lowers the barrier to actually watching your APIs.
Best for: Teams needing unified monitoring, logs, and incident response without heavy configuration.
Key strengths
- Uptime monitoring: Check API endpoints on a schedule and alert on downtime.
- Logs and traces: Centralize logs and correlate them with monitoring signals.
- Incident management: On-call scheduling and escalation built in.
Why choose Better Stack: The appeal is speed to value and a clean incident workflow. If your priority is knowing the instant an API goes down and getting the right person paged, Better Stack delivers that without a long implementation. The included incident management means you do not need a separate on-call tool.
Better Stack pricing: A free tier covers personal projects at $0. The Responder license is $34 per license per month. Logs and Traces is usage-based at $0.15/GB, and Uptime monitoring starts at $25 per month. Enterprise is a custom quote. It holds a 4.8/5 rating on G2, among the highest in this list.
6. SigNoz
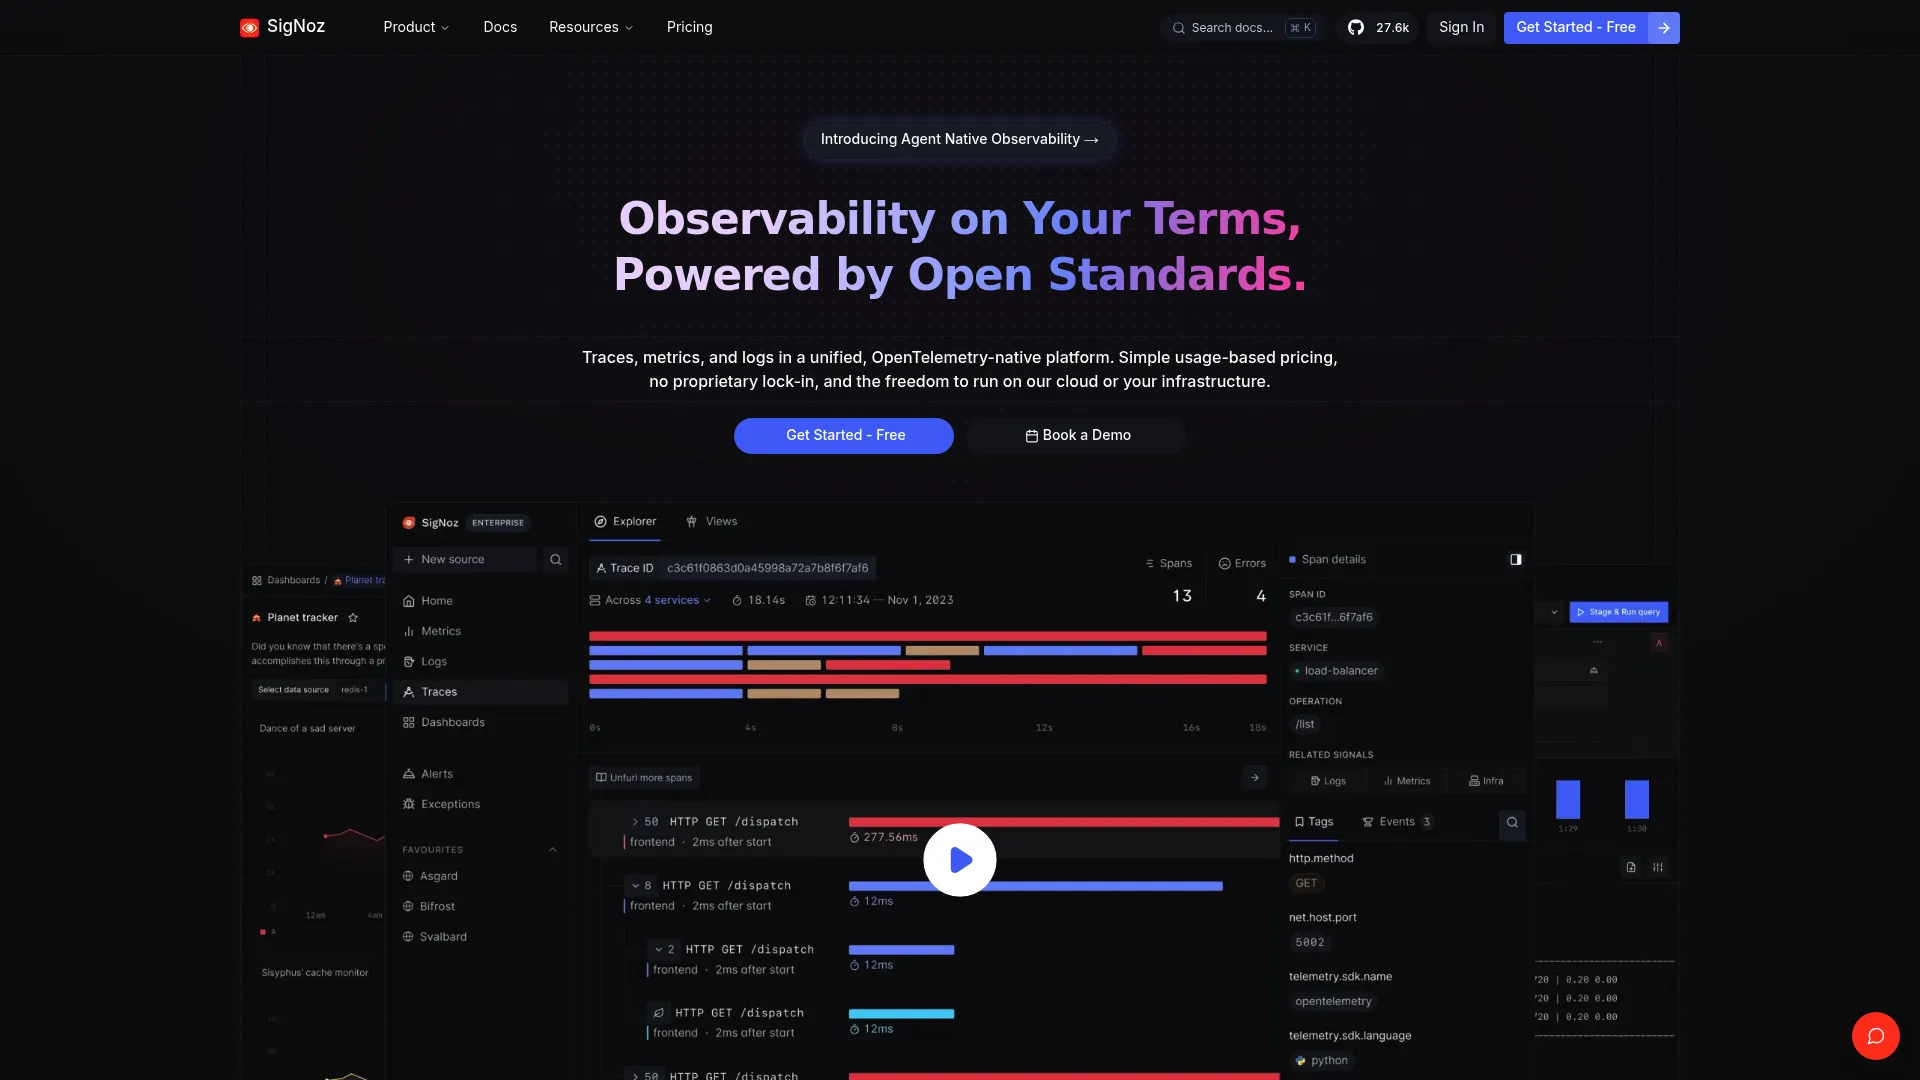
SigNoz is an open-source, OpenTelemetry-native observability platform covering logs, metrics, traces, dashboards, and alerts. It gives teams that want control and flexibility a self-hostable alternative to proprietary suites, with a managed cloud option when you would rather not run it yourself. APM, distributed tracing, and exception tracking come in one unified view.
Best for: Teams wanting OpenTelemetry-native observability with transparent, usage-based pricing.
Key strengths
- Unified observability: Logs, metrics, traces, and exceptions in a single platform.
- Flexible analytics: Query Builder, SQL, and PromQL-based analysis.
- APM and tracing: Distributed tracing, dashboards, and alerts out of the box.
Why choose SigNoz: If self-hosting matters for cost control or data governance, the open-source Community Edition lets you run full observability on your own infrastructure. Teams that prefer managed can move to cloud without changing instrumentation, since everything is OTel-native. The transparent usage-based pricing avoids surprise bills.
SigNoz pricing: The Community Edition is free and self-hosted. The Teams cloud plan starts at $49 per month, with usage-based rates for logs, traces, and metrics. Enterprise is contact-sales for cloud or self-hosted. A current G2 rating was not available at writing time.
7. Prometheus
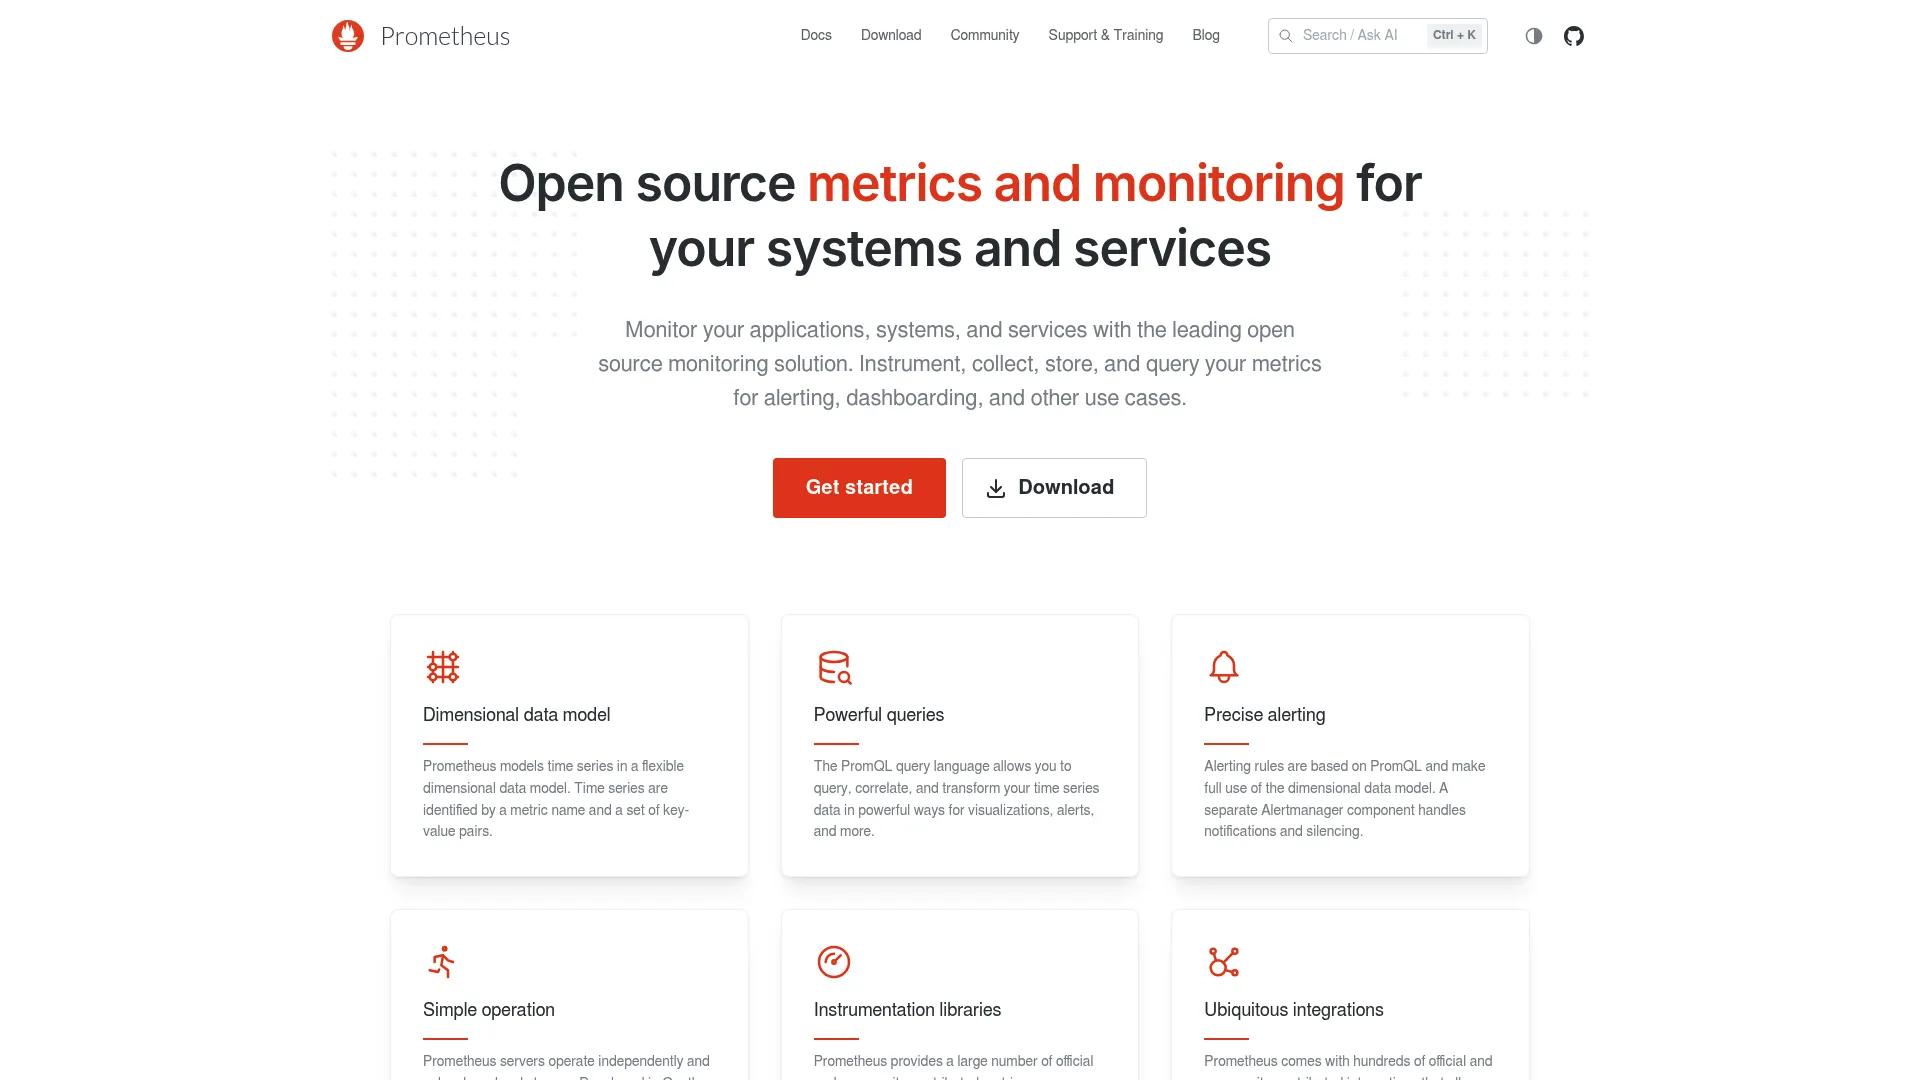
Prometheus is the open-source standard for metrics-based monitoring and alerting. Its dimensional time-series data model and PromQL query language give engineering teams fine-grained control over what they collect and how they slice it. For API monitoring, you instrument endpoints to expose metrics like request rate, error count, and latency histograms, then query and alert on them precisely.
Best for: Teams needing open-source metrics monitoring and alerting with full control over instrumentation.
Key strengths
- Dimensional data model: Time-series metrics with rich labels for slicing by endpoint, status, or service.
- PromQL: A powerful query language for latency percentiles, error rates, and throughput.
- Alerting: Rule-based alerting via Alertmanager with flexible routing.
Why choose Prometheus: When you want complete control and custom instrumentation, Prometheus is the foundation most engineering teams reach for. It is 100% open source and community-driven, with a massive ecosystem of exporters and integrations. It is metrics-first, so most teams pair it with a visualization layer and a tracing tool for full coverage.
Prometheus pricing: Prometheus is 100% open source and free. There is no commercial pricing on the official site. Your only costs are the infrastructure you run it on and the engineering time to operate it. No current G2 rating was available at writing time.
8. Grafana
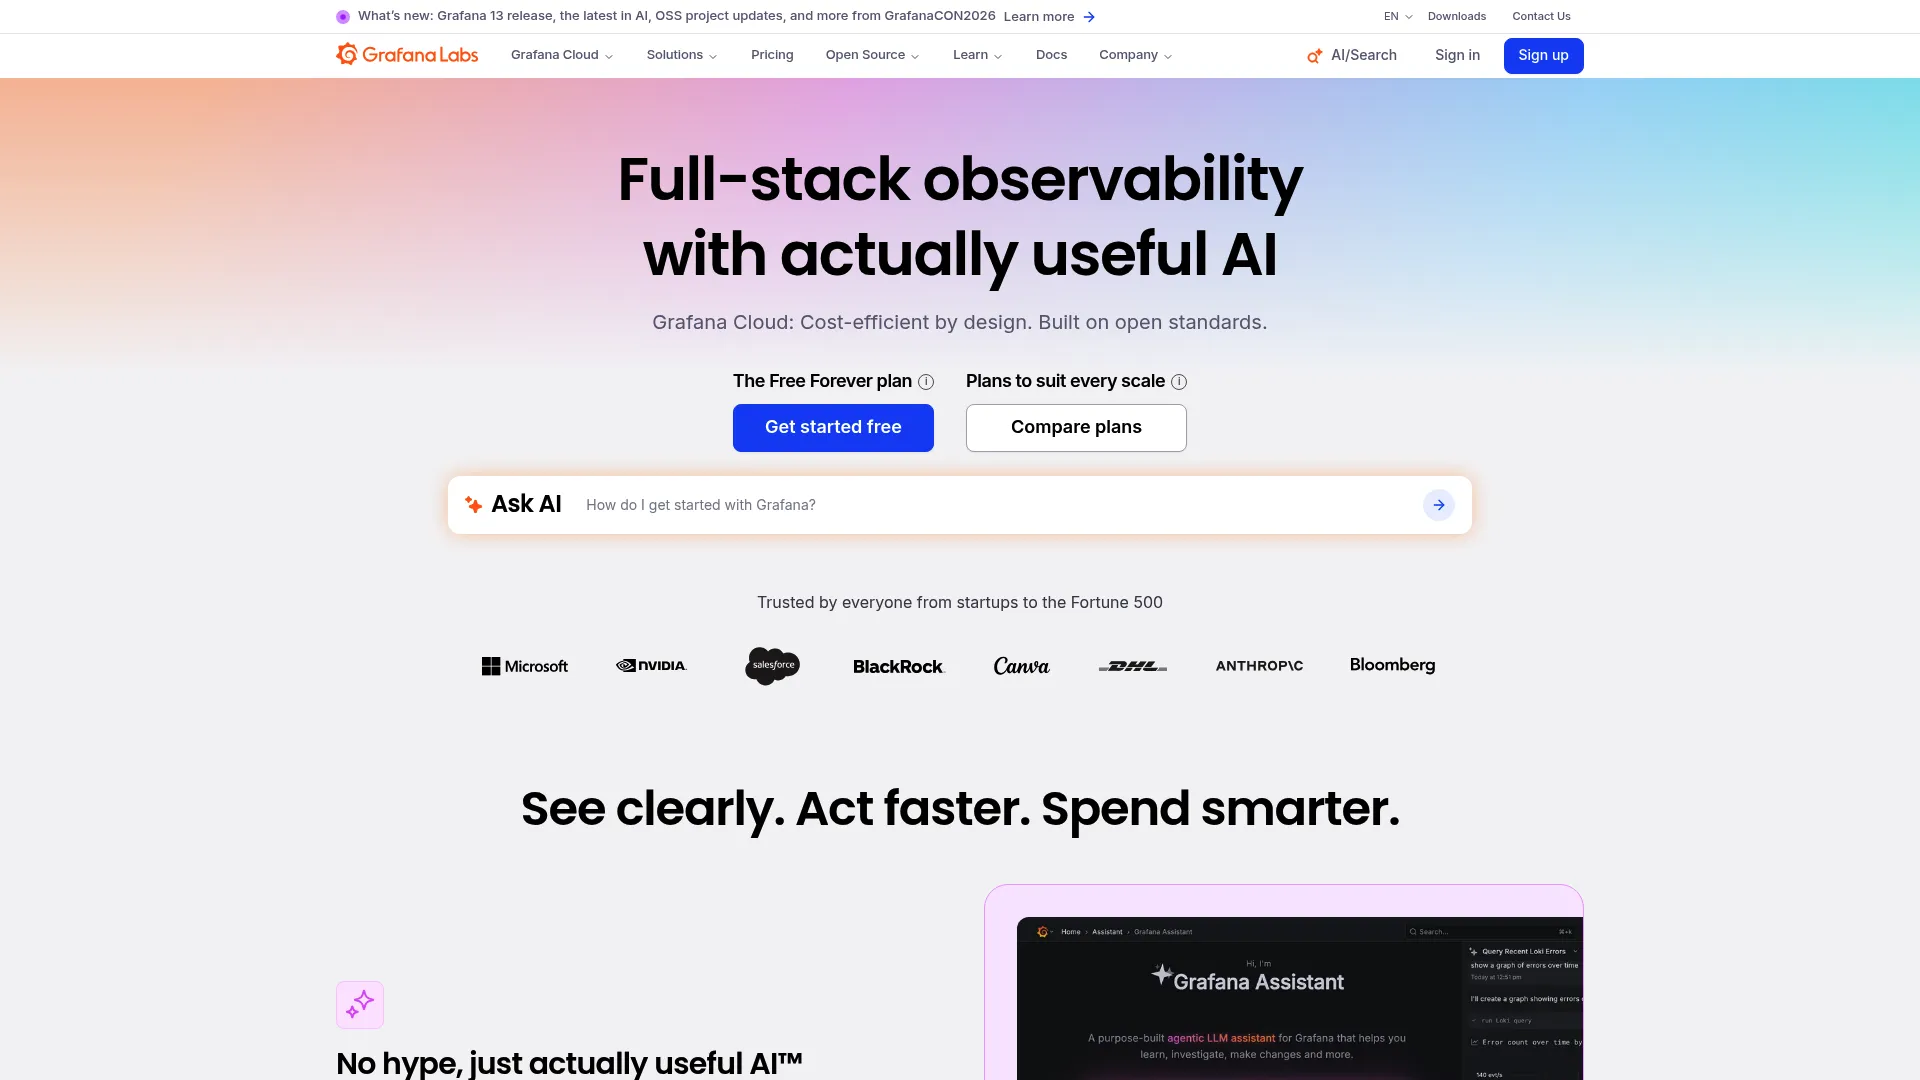
Grafana is an open observability platform for querying, visualizing, and alerting on metrics, logs, and traces. It is the dashboarding layer most teams put on top of a metrics source like Prometheus, and it queries across many data sources in one place. For API monitoring, Grafana turns raw telemetry into readable dashboards that show latency, error rate, and throughput trends at a glance.
Best for: Teams needing a flexible observability and dashboarding platform across many data sources.
Key strengths
- Dashboards: Rich, customizable visualization for any metric, log, or trace source.
- Alerting: Unified alerting rules that span multiple data sources.
- Multi-source queries: Connect Prometheus, logs, traces, and cloud data in one view.
Why choose Grafana: Grafana is usually part of the monitoring stack rather than the whole thing. Its strength is presenting and alerting on data from wherever it lives, which makes it the connective tissue between your metrics, logs, and traces. Teams that value flexible visualization and vendor-neutral dashboards default to it.
Grafana pricing: Grafana Cloud offers a Free plan at $0, always. Pro starts at $19 per month plus usage. Enterprise starts at a $25,000 per year spend commitment. The open-source Grafana software itself is free to self-host. It holds a 4.5/5 rating on G2.
9. Splunk Observability Cloud
Splunk Observability Cloud is an OpenTelemetry-native platform for unified visibility across applications and infrastructure. It covers APM, infrastructure monitoring, real user monitoring, synthetic monitoring, log analytics, and database monitoring, with an AI Assistant for troubleshooting and no data sampling. For enterprises with scale, compliance, and governance requirements, that completeness is the draw.
Best for: Teams needing full-stack observability with OpenTelemetry-native monitoring and AI-assisted troubleshooting.
Key strengths
- Full-stack observability: APM, infrastructure, RUM, synthetic, log, and database monitoring together.
- No data sampling: Analyze full-fidelity data rather than a sampled subset.
- AI-assisted troubleshooting: An AI Assistant helps surface root causes faster.
Why choose Splunk Observability Cloud: For larger organizations, the combination of no data sampling, broad coverage, and enterprise governance is hard to match. Synthetic monitoring includes API tests, so you can watch endpoints proactively alongside real user data. It fits teams that need scale and compliance more than the lowest entry price.
Splunk Observability Cloud pricing: Infrastructure Monitoring starts at $15 per host per month billed annually. APM is $55 per host per month, Real User Monitoring is $14 per 10,000 sessions, and Synthetic Monitoring is $1 per 10,000 uptime requests. A free edition is available for up to 15 hosts. It holds a 4.3/5 rating on G2.
Considerations before you buy
A shortlist narrows the field. These criteria help you pick the one that fits your stack and production maturity.
Production fit over feature count
The best demo does not always survive real traffic. Ask whether the tool monitors live API calls, not just scheduled synthetic checks, and whether it handles your protocols (REST, GraphQL, gRPC). A tool with fewer features that watches production accurately beats a feature-rich one that only pings a health endpoint.
Alert quality and noise
Alerts are only useful if people trust them. Evaluate how the tool handles thresholds, anomaly detection, and SLO-based alerting, and how easy it is to tune out noise. Alert fatigue kills response times faster than any missing feature. Look for routing, deduplication, and on-call integration.
Integration with your existing stack
Monitoring lives inside a workflow. Confirm the tool ingests your existing logs, metrics, and traces, and that it connects to your incident tooling and communication channels. OpenTelemetry support is a strong signal here, since it keeps you portable if you change vendors later.
Cost model and scale
Usage-based pricing can be efficient or brutal depending on your data volume. Model your ingest, host count, or event volume against each tool's pricing before committing. Open-source options trade licensing cost for operational time, so weigh engineering hours against a subscription.
SLI, SLO, and SLA alignment
Decide what you promise before you decide what you monitor. Map your service level indicators (latency, error rate, availability) to the objectives and agreements your business commits to. The right tool makes it easy to define an SLO and alert against its error budget, not just raw thresholds.
Conclusion
There is no single best API monitoring tool, only the best fit for your stack and your production reality. If your API is your product, Moesif brings analytics and monetization together. For teams already invested in broad observability, Datadog and New Relic offer full-stack correlation, while Splunk Observability Cloud carries the enterprise-grade governance and no-sampling depth larger organizations need. If you have committed to OpenTelemetry, Uptrace and SigNoz give you portable, standards-based monitoring, with SigNoz adding a self-hostable path. For fast uptime coverage and incident response, Better Stack is hard to beat. And for teams that want full control, Prometheus plus Grafana remains the open-source foundation.
The practical next step is to match the tool to what you already run. Audit your current logs, metrics, and traces, decide whether you want managed or self-hosted, and start with the one that fits your existing workflow. Then define one SLO and monitor it end to end before expanding coverage.
FAQs
API monitoring continuously watches an API in production for availability, latency, error rate, and correctness, alerting you when something drifts. API testing validates behavior before you ship, typically in CI/CD or staging, with assertions about expected responses. Testing asks "does this work?" once; monitoring asks "is this still working?" on live traffic, forever. You need both.
The core set is latency (measured at p50, p95, and p99), error rate (percentage of 4xx and 5xx responses), throughput or request rate, and availability. Beyond those, watch data validation to confirm responses are correct, not just successful, plus the health of third-party dependencies. Tie these API monitoring metrics to your SLOs so alerts reflect real user impact.
Synthetic monitoring runs scheduled checks against your endpoints to catch outages proactively, even when traffic is low. APM watches real traffic and traces requests down to slow code paths and queries. Most production teams use both: synthetics for early detection and uptime SLAs, APM for diagnosing what real users hit. Several tools on this list combine them.
They shorten the path from "something is wrong" to "here is the cause." Good tools alert on a specific signal, then let you pivot straight into correlated logs and distributed traces to find the failing service or code path. That removes the slow, manual step of reconstructing an incident from scattered data, which is where most of MTTR is lost.
Prioritize production fit (monitoring real traffic, not just synthetic pings), alert quality with low noise, integration with your existing logs, metrics, traces, and incident tools, and a cost model that scales with your data volume. OpenTelemetry support is a strong plus because it keeps you portable. Match the platform to your stack rather than chasing the longest feature list.
Yes. Prometheus for metrics, Grafana for dashboards and alerting, and OpenTelemetry-native options like SigNoz and Uptrace all run production workloads at scale. The trade-off is operational: you exchange a subscription for the engineering time to deploy, tune, and maintain the stack. For teams with the expertise, open source offers control, flexibility, and no vendor lock-in.
Instrument outbound calls so you capture latency, error rate, and rate-limit responses from external services, then track them alongside your own metrics. Distributed tracing helps by following a request across service boundaries, including calls to third parties. Set alerts on dependency latency and error budgets so you notice a provider degrading before it cascades into your own API.
Service level objectives turn raw metrics into commitments. Instead of alerting on every latency blip, you define an SLO (for example, 99.9% of requests under 300ms) and monitor its error budget. Alerts then fire when you are at risk of breaching the objective, which reduces noise and aligns monitoring with what the business actually promises through its SLAs.