

It's 2:14am. A checkout service starts timing out. Carts hang, users bounce, and your on-call engineer is staring at a wall of green dashboards with no idea which of 40 microservices, which database query, or which deploy from six hours ago broke the flow. By the time someone traces it manually, revenue has already leaked.
This is the exact problem application performance monitoring tools exist to solve. Industry studies estimate that an hour of critical application downtime can cost large enterprises hundreds of thousands of dollars in lost revenue and productivity. The harder cost is trust: users who hit a slow page rarely tell you, they just leave.
The category has shifted fast. Modern application performance monitoring software no longer just charts response time. It correlates traces, logs, metrics, and real user data, uses AI to surface root cause, and instruments your stack through open standards like OpenTelemetry. Most 2026 APM round-ups cover between 5 and 16 tools, with many clustered around 8 to 10. We went deeper.
This guide compares 12 current APM tools head to head, with verified pricing, G2 ratings, tracing depth, and honest notes on who each one actually fits. No legacy products, no single-vendor spin.
What's inside
This guide is for engineering teams, SREs, DevOps engineers, platform engineers, and technical evaluators (including sales engineers assessing their own or a prospect's observability stack) who need to shortlist an APM tool fast. If you're a sales engineer evaluating your own stack, an interactive demo can be just as critical as your monitoring tooling for showcasing product reliability.
We selected and ranked the 12 tools on four criteria that separate a modern APM platform from a metrics dashboard:
- Distributed tracing depth across services
- OpenTelemetry and instrumentation support
- Cloud-native, multicloud, and full-stack coverage
- Pricing transparency and AI-assisted root-cause analysis
Every pricing figure and G2 rating below was verified against live vendor pages and G2 listings.
TL;DR
Short on time? Here are the quick picks from the 12 tools below.
- Best for full-stack observability: Datadog APM, one platform for traces, logs, metrics, and RUM.
- Best for AI-driven root-cause analysis: Dynatrace, with its Davis causation engine and OneAgent auto-instrumentation.
- Best all-in-one with a real free tier: New Relic, usage-based with 100 GB ingest free monthly.
- Best for AWS-native teams: Amazon CloudWatch, deeply wired into AWS with X-Ray tracing.
- Best open-source option: Prometheus with Grafana, free, Kubernetes-native metrics and alerting.
- Best for high-cardinality debugging: Honeycomb, event-based observability with BubbleUp for fast root cause.
What is application performance monitoring (APM)?
Application performance monitoring (APM) is the practice of tracking, measuring, and analyzing how software applications perform in production so teams can detect, diagnose, and resolve issues before they hurt users. In plain terms, APM meaning comes down to this: it tells you whether your app is fast, healthy, and working, and when it isn't, it tells you why.
An APM tool measures signals like response time, throughput, error rates, resource usage (CPU, memory, I/O), and end-user experience. It then ties those signals together across every service a request touches. That is what separates application performance management software from basic uptime checks.
Modern apm monitoring covers a core set of capabilities:
- Distributed tracing across services and APIs
- Trace, log, metric, and real user monitoring (RUM) correlation
- Root-cause analysis and anomaly detection, increasingly AI and ML assisted
- OpenTelemetry-based instrumentation for vendor-neutral data
- Full-stack and cloud-native or multicloud visibility
- Alerting, SLOs, and incident response workflows
The shift toward OpenTelemetry matters. It lets you instrument once and send telemetry to any backend, which reduces lock-in and makes switching application monitoring tools far less painful. Most application performance monitoring tools on this list now ingest OpenTelemetry data natively.
APM vs observability (and APM vs application performance management)
These terms get blurred constantly. APM monitors known performance signals: you know what to watch (latency, errors, throughput) and you track it. Observability is broader. It lets you investigate unknown-unknowns by querying traces, logs, and metrics together to answer questions you didn't predict.
Application performance management is the wider strategic discipline. APM (the monitoring) is one component of it. Here is the practical distinction.
| Dimension | APM | Observability |
|---|---|---|
| Scope | Known performance signals | Unknown-unknowns and exploration |
| Signals | Traces, metrics, errors | Traces, logs, metrics, events combined |
| Use case | Watch and alert on what you expect | Investigate what you didn't expect |
In practice, most tools below now span both.
When to use an APM tool
You don't always need a full APM platform. Here are the moments where one earns its cost.
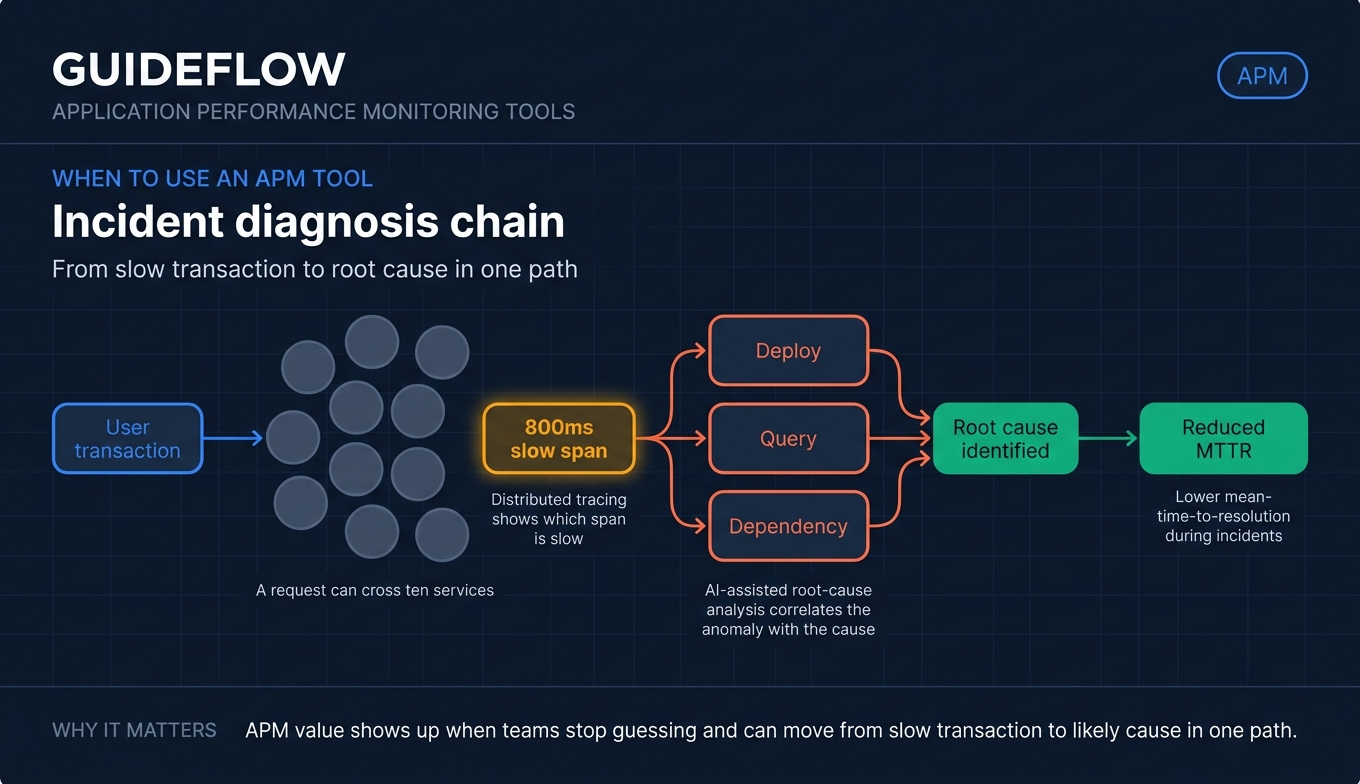
Diagnose slow transactions across distributed services
When a request crosses ten services and one of them adds 800ms, logs alone won't find it. Distributed tracing follows a single request end to end and shows you exactly which span is slow. This is the core reason teams adopt application performance monitoring software in the first place. For microservices, it is non-negotiable.
Cut mean-time-to-resolution during incidents
During an incident, every minute spent guessing is a minute of user pain. AI-assisted root-cause analysis correlates the anomaly with the deploy, the query, or the dependency that caused it. Teams that pair tracing with automated correlation routinely cut mean-time-to-resolution, which is often the metric that justifies the spend to leadership.
Validate performance before and after deploys
Shipping a change without measuring its performance impact is a gamble. APM tools let you baseline a service, deploy, and compare. For sales engineers and technical evaluators, the same capability validates that your own product holds up under load before a prospect ever sees it. Pairing solid performance with a polished live demo is what closes technical buyers.
Application performance monitoring tools compared
Here are the 12 application performance monitoring tools side by side. Pricing reflects verified entry tiers as of mid-2026, and ratings come from live G2 listings. Use this table to narrow your shortlist, then read the detailed sections below.
| # | Product | Intent | Key use case | Pricing | G2 rating |
|---|---|---|---|---|---|
| 1 | Datadog APM | Full-stack SaaS observability | Unified traces, logs, metrics, RUM for cloud-native teams | From $31/APM host/mo (annual) | 4.4/5 |
| 2 | Dynatrace | AI-assisted enterprise APM | Causal root cause across multicloud estates | From $7/mo per host | 4.5/5 |
| 3 | New Relic | All-in-one observability | Consolidated full-stack monitoring with free tier | Free, then usage-based | 4.4/5 |
| 4 | AppDynamics | Business-aligned APM | Tie app performance to business transactions | From $6/mo per CPU core (annual) | 4.3/5 |
| 5 | Amazon CloudWatch | AWS-native monitoring | Metrics, logs, traces for AWS stacks | Free tier, then pay-as-you-go | 4.3/5 |
| 6 | Grafana Cloud | Open-standard observability | Managed LGTM stack with flexible pricing | Free, then $19/mo + usage | 4.5/5 |
| 7 | Prometheus + Grafana | Open-source metrics | Kubernetes-native metrics and alerting | Free (open source) | 4.5/5 |
| 8 | Elastic APM | Search-led observability | OpenTelemetry APM on the Elastic Stack | From $0.09/GB ingested | 4.0/5 |
| 9 | Splunk Observability Cloud | Enterprise full-fidelity tracing | NoSample tracing for Splunk-portfolio teams | From $15/host/mo (annual) | 4.3/5 |
| 10 | Honeycomb | High-cardinality debugging | Event-based observability for distributed systems | Free, then $130/mo | 4.7/5 |
| 11 | Sentry | Developer-centric monitoring | Error plus performance in one tool | Free, then $26/mo (annual) | 4.5/5 |
| 12 | SolarWinds AppOptics | Cost-effective SMB APM | Tracing plus infrastructure for mid-market | Per-host monthly | Verify on G2 |
The 12 best application performance monitoring tools for 2026
1. Datadog APM
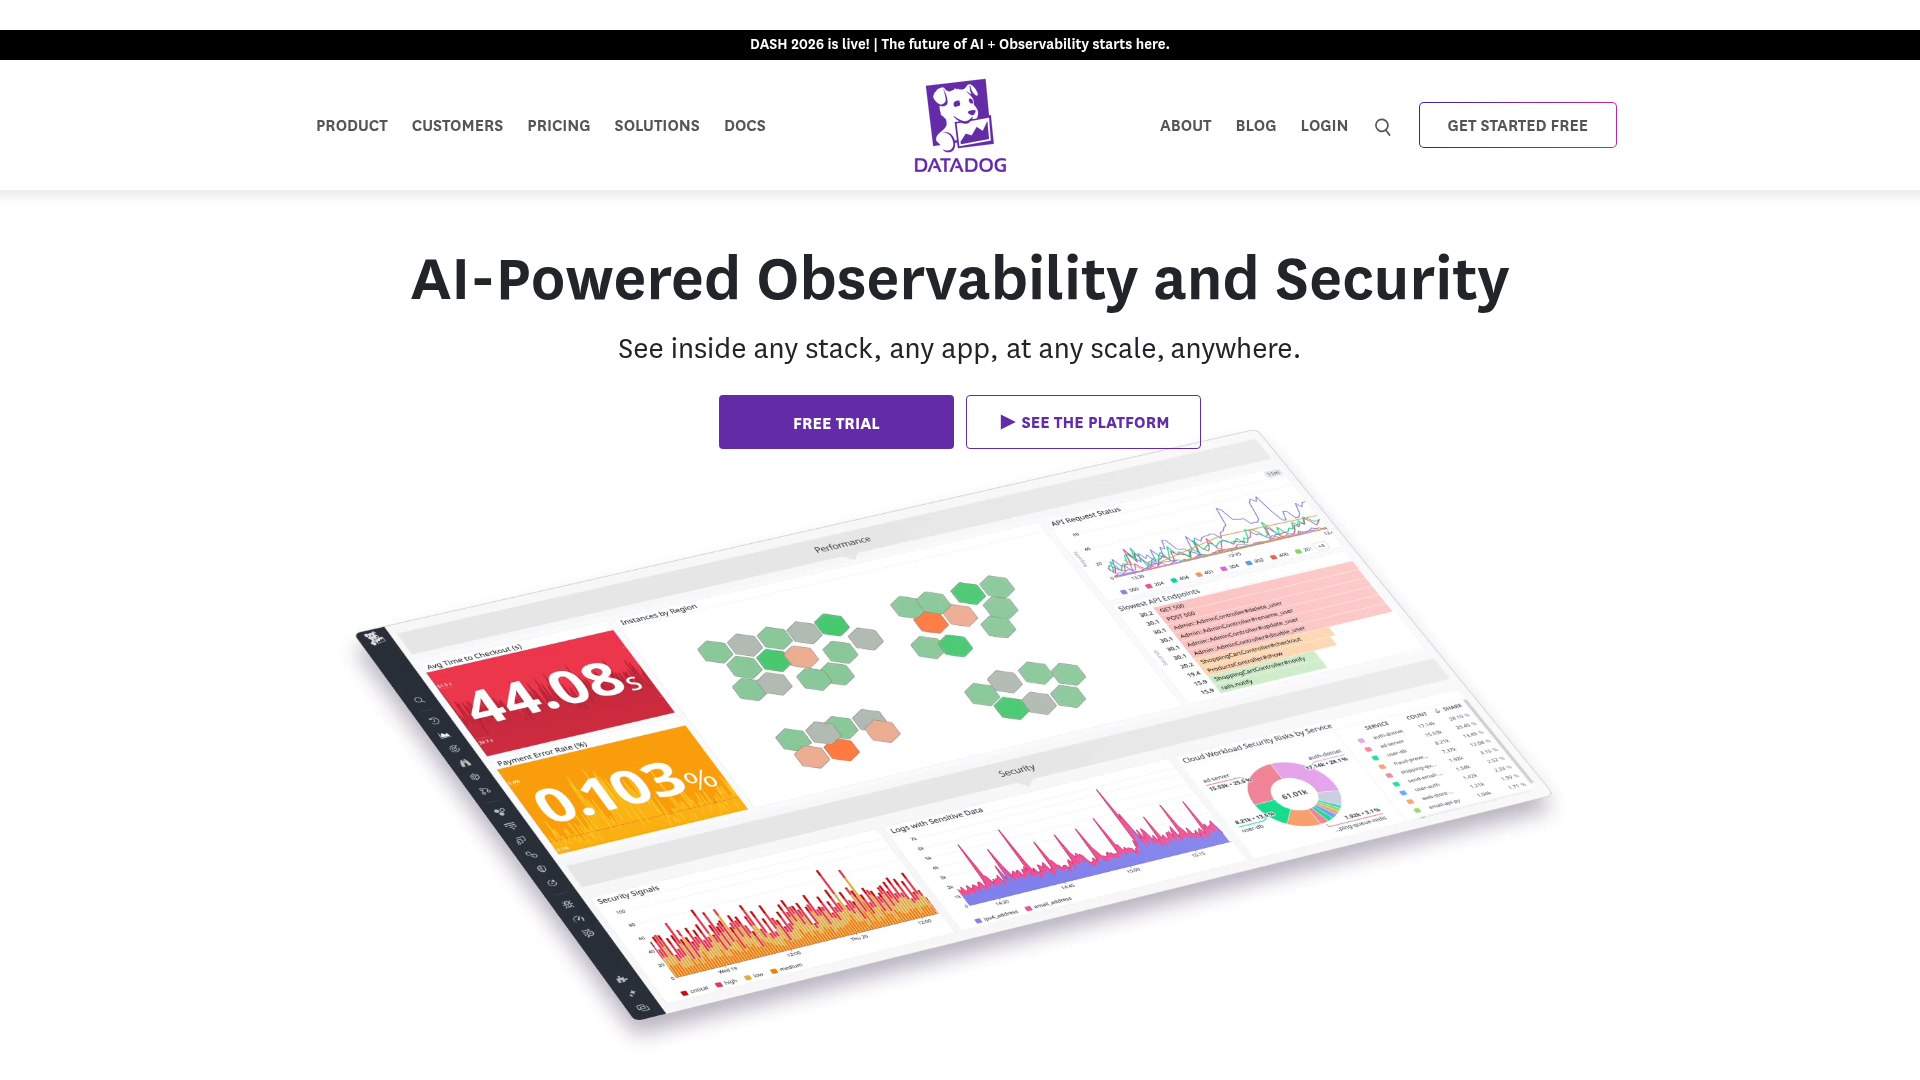
Datadog is an AI-powered observability and security platform for monitoring infrastructure, applications, logs, digital experiences, software delivery, service management, and AI systems. Its APM module ties distributed tracing to logs, metrics, and real user monitoring in one view, so engineers stop pivoting between tools mid-incident.
Best for: Engineering, DevOps, SRE, and security teams that want unified observability across cloud-scale infrastructure and applications.
Key strengths
- Unified observability: Infrastructure monitoring, APM, log management, and RUM live in one platform, so traces correlate to logs and metrics automatically.
- Watchdog AI root cause: Datadog's anomaly detection surfaces likely causes during incidents instead of leaving engineers to dig manually.
- OpenTelemetry and serverless: Native OTLP ingest, Continuous Profiler, change tracking, and broad serverless support cover modern cloud-native stacks.
Why choose Datadog: If your team is tired of stitching together five tools, Datadog's single-pane model is the strongest fit. Cloud-native teams that value correlation across signals over a single specialized feature get the most value here.
Datadog pricing: Datadog uses modular, per-product pricing in USD. APM starts at $31 per APM host per month billed annually. Infrastructure Pro starts at $15 per infra host per month annually, and log ingestion runs $0.10 per ingested GB. A free trial is available. Datadog holds a 4.4/5 rating on G2.
2. Dynatrace
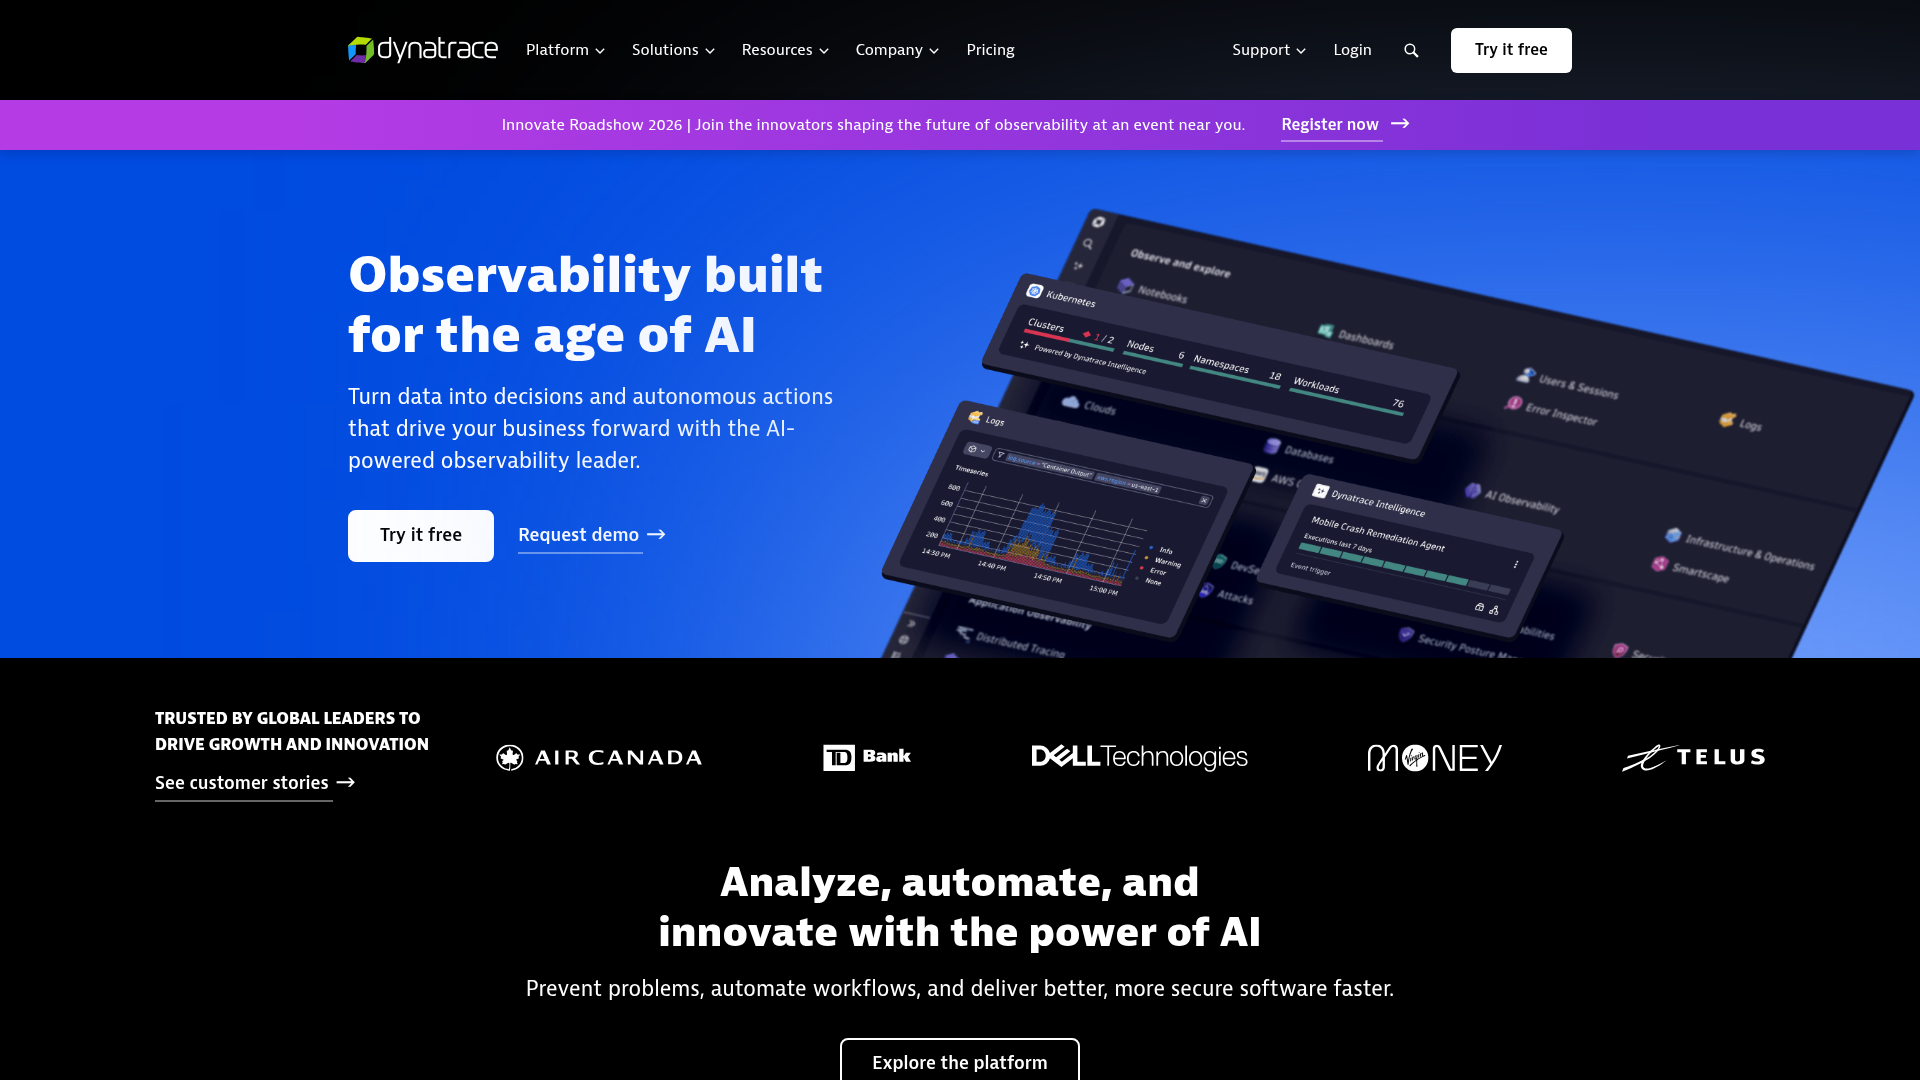
Dynatrace is an AI-powered observability platform for monitoring, analyzing, securing, and automating complex cloud, application, infrastructure, and digital experience environments. Its differentiator is the Davis causation engine, which moves past correlation to identify the actual cause of a problem.
Best for: Enterprises and platform teams needing AI-assisted full-stack observability and root-cause analysis across complex hybrid and cloud-native environments.
Key strengths
- Davis causal AI: Dynatrace pinpoints the root cause of an issue rather than just flagging correlated anomalies, which shortens enterprise incident cycles.
- OneAgent auto-instrumentation: A single agent auto-discovers services and instruments the full stack, reducing manual setup across large estates.
- Unified data platform: Grail, Smartscape topology mapping, PurePath tracing, and OpenTelemetry support give deep visibility across multicloud.
Why choose Dynatrace: For large organizations running sprawling multicloud and hybrid estates, Dynatrace's automation and causal AI handle scale that lighter tools struggle with. The depth pays off when manual instrumentation is impractical.
Dynatrace pricing: Dynatrace uses consumption-based pricing under the Dynatrace Platform Subscription. Foundation & Discovery starts at $7 per month per host, Infrastructure Monitoring at $29 per month per host, and Full-Stack Monitoring at $58 per month per 8 GiB host. A free trial is available. Dynatrace holds a 4.5/5 rating on G2.
3. New Relic
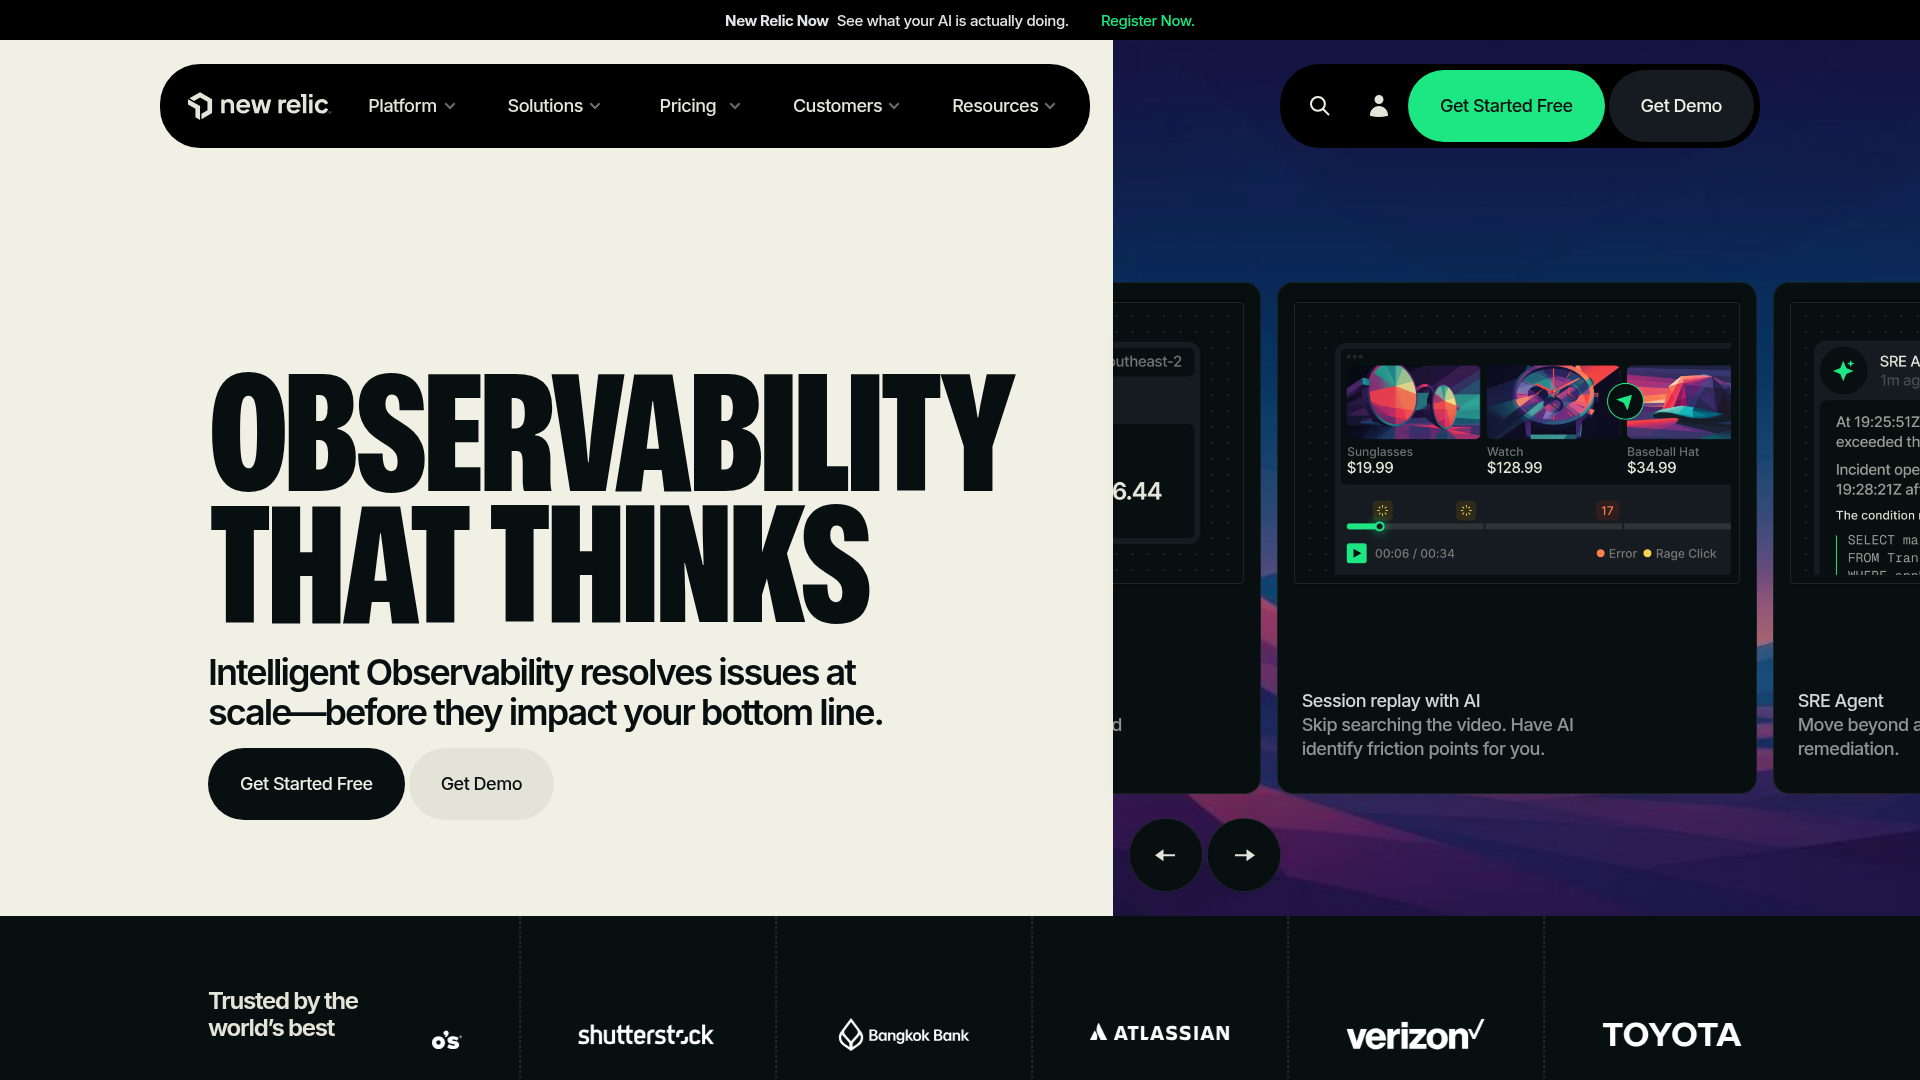
New Relic is an intelligent observability platform for monitoring, debugging, and improving applications, infrastructure, logs, digital experiences, and AI systems. APM 360 and distributed tracing anchor the platform, with agents and OpenTelemetry covering instrumentation.
Best for: Engineering, DevOps, and SRE teams that want unified full-stack observability across applications, infrastructure, logs, traces, and user experience.
Key strengths
- APM 360 and distributed tracing: A consolidated view ties application performance to the rest of the stack, useful for full-stack debugging.
- Broad instrumentation: Language agents plus OpenTelemetry ingest mean you can instrument however your team prefers.
- Usage-based model: Pricing is tied to data and users rather than per-host seats, which suits teams consolidating tools.
Why choose New Relic: Teams that want one platform instead of several, and a free tier generous enough to run a real evaluation, find New Relic a practical consolidation play. The usage model rewards teams that prefer to scale ingest predictably.
New Relic pricing: New Relic is usage-based with Free, Standard, Pro, and Enterprise editions. The Free tier includes 100 GB of data ingest per month, one full platform user, and unlimited basic users at $0. Beyond the free 100 GB, original data ingest is $0.40/GB, Core users are $49/user, and full platform users start at $349/user on annual commitments. Enterprise is contact-sales. New Relic holds a 4.4/5 rating on G2.
4. AppDynamics
AppDynamics, now part of Cisco, is an observability product for optimizing hybrid and on-prem application performance with full-stack observability linked to business performance. Its hallmark is business transaction monitoring, which connects technical metrics to revenue-affecting flows.
Best for: Enterprises running hybrid or on-prem applications that need full-stack APM tied to business transactions, infrastructure, and SAP or digital-experience monitoring.
Key strengths
- Business transaction monitoring: AppDynamics maps performance to the transactions that matter to the business, helping teams prioritize by impact.
- Hybrid and on-prem fit: Strong coverage for hybrid estates and on-prem workloads that pure-SaaS tools handle less gracefully.
- Digital experience monitoring: Web, mobile, and synthetic user monitoring round out full-stack visibility.
Why choose AppDynamics: If you need to tie application performance directly to business KPIs, and you run hybrid or on-prem infrastructure, AppDynamics is built for that context. It excels when business-transaction context matters more than the lightest possible setup.
AppDynamics pricing: AppDynamics is licensed per CPU core with annual billing. The Infrastructure Monitoring Edition starts at $6 per month per CPU core, the Premium Edition at $33, and the Enterprise Edition at $50, with an Enterprise Edition for SAP Solutions at $95. A 30-day free trial is available. There is no free tier. AppDynamics holds a 4.3/5 rating on G2.
5. Amazon CloudWatch
Amazon CloudWatch is an AWS monitoring and observability service for collecting logs, metrics, events, alarms, and operational insights across AWS, on-premises, hybrid, and other cloud resources. For AWS-heavy teams, it is the default starting point.
Best for: AWS-heavy teams that need native monitoring, logging, alerting, and observability across cloud infrastructure and applications.
Key strengths
- Native AWS integration: Default metrics from more than 70 AWS services arrive with no setup, plus custom metrics where you need them.
- Tracing via X-Ray: CloudWatch integrates with AWS X-Ray to surface trace data alongside metrics and logs.
- Alarms and insights: Dashboards, anomaly detection, Logs Insights, Container Insights, Lambda Insights, and RUM cover most operational needs.
Why choose Amazon CloudWatch: If your stack lives in AWS, CloudWatch removes integration friction and bills only for what you use. Teams with significant non-AWS infrastructure may want a vendor-neutral tool alongside it.
Amazon CloudWatch pricing: CloudWatch is usage-based with a free tier. The free tier includes allowances like 5 GB of log ingestion, 10 custom metrics, 1 million API requests, and 3 dashboards. Paid usage is pay-as-you-go with no minimum fee, and rates vary by region. Public examples include $0.50/GB for some log ingestion and $0.30 per custom metric per month. CloudWatch holds a 4.3/5 rating on G2.
6. Grafana Cloud
Grafana Cloud is a fully managed observability platform for dashboards, metrics, logs, traces, profiling, alerting, incident response, and synthetic monitoring. Built on the open LGTM stack (Loki, Grafana, Tempo, Mimir), it pairs open standards with a managed experience.
Best for: Engineering, DevOps, SRE, and platform teams that want managed, open-standard observability with flexible usage-based pricing.
Key strengths
- Open LGTM stack: Tempo for traces, Mimir and Prometheus for metrics, Loki for logs, and Grafana for dashboards, all OpenTelemetry-friendly.
- Application Observability: Purpose-built APM views sit on top of the open data stack without locking you into proprietary formats.
- Flexible deployment: Run self-hosted open source or managed cloud, with Adaptive Telemetry and an AI Assistant in the cloud tier.
Why choose Grafana Cloud: Teams that value open standards and want to avoid lock-in, but don't want to operate the full stack themselves, get the best of both with the managed cloud. The free tier is genuinely usable for small teams.
Grafana Cloud pricing: The Free tier is always free with limited usage across all services, community support, and 14 days of retention. Pro starts at $19 per month plus usage, adding pay-as-you-go scaling, longer retention, and 8x5 support. Enterprise starts at a $25,000 per year spend commit. Grafana Labs holds a 4.5/5 rating on G2.
7. Prometheus + Grafana
Prometheus is an open-source metrics monitoring and alerting system for applications, systems, and services. Paired with Grafana for visualization, it forms the default monitoring stack for Kubernetes and cloud-native infrastructure.
Best for: Cloud-native teams needing open-source metrics collection, querying, and alerting for dynamic infrastructure.
Key strengths
- Dimensional data model: Metrics use names plus key-value labels, which suits dynamic, container-based environments.
- PromQL: A powerful query language for correlating and transforming metrics, with deep Kubernetes adoption.
- Built-in alerting: Alerting rules plus a separate Alertmanager handle notifications and silencing without extra licensing.
Why choose Prometheus + Grafana: If you run Kubernetes and want free, open tooling you fully control, this pairing is the standard. Be ready to operate and scale it yourself, since the software is free but infrastructure and maintenance are not.
Prometheus pricing: Prometheus is open source under the Apache 2.0 license and free to use. There is no subscription. Your only costs are the compute and storage to run it, plus engineering time to operate it. Prometheus holds a 4.5/5 rating on G2.
8. Elastic APM
Elastic APM is Elastic's application performance monitoring capability for monitoring services and applications in real time with traces, errors, metrics, and correlated observability data. It runs on the Elastic Stack, so logs and APM data sit in one search-led system.
Best for: Engineering and SRE teams that want OpenTelemetry-native APM integrated with Elastic logs, metrics, traces, and observability workflows.
Key strengths
- OpenTelemetry-native tracing: Distributed tracing with head- and tail-based sampling, built around open standards.
- ML-driven correlation: Machine learning correlates latency, errors, and failures to speed up anomaly detection.
- Service dependency mapping: Live architecture visualization shows how services depend on each other in real time.
Why choose Elastic APM: If your team already runs Elasticsearch or the ELK stack, adding APM on the same platform keeps logs, metrics, and traces searchable in one place. The search-led model suits log-heavy environments.
Elastic APM pricing: Elastic Observability Serverless is usage-based. The Complete plan, which covers APM traces along with logs and metrics, starts as low as $0.09 per GB ingested, with retention as low as $0.019 per GB per month. Logs Essentials starts as low as $0.07 per GB ingested. A free trial is available. Elastic APM holds a 4.0/5 rating on G2.
9. Splunk Observability Cloud
Splunk Observability Cloud provides unified visibility and AI-assisted troubleshooting across applications and environments. Its APM module is known for full-fidelity NoSample tracing, which keeps every trace rather than sampling.
Best for: Engineering and operations teams needing full-stack observability across infrastructure, applications, logs, and digital experience.
Key strengths
- NoSample full-fidelity tracing: Splunk APM retains all traces, so you don't lose the one trace that explains a rare failure.
- OpenTelemetry-first: Instrumentation is built around the Splunk OpenTelemetry collector and open standards.
- Full-stack modules: Infrastructure monitoring, real user monitoring, and synthetic monitoring complete the picture.
Why choose Splunk Observability Cloud: For enterprises already invested in the Splunk portfolio, the observability suite extends that platform with strong tracing fidelity. Full-fidelity tracing is a real advantage when intermittent issues evade sampled approaches.
Splunk Observability Cloud pricing: Pricing is per host, billed annually. The Infrastructure tier starts at $15 per host per month for over 15 hosts, App & Infra at $60 per host per month, and End-to-End at $75 per host per month. A free tier is available for up to 15 hosts. Splunk Observability Cloud holds a 4.3/5 rating on G2.
10. Honeycomb
Honeycomb is an observability platform for engineering teams to understand production systems, debug distributed services and AI workflows, and investigate end-user impact. It is built around high-cardinality, event-based data and fast querying.
Best for: Engineering, DevOps, and SRE teams needing high-cardinality observability, distributed tracing, OpenTelemetry-native telemetry, and fast production debugging.
Key strengths
- BubbleUp root cause: BubbleUp compares anomalous events against the baseline to surface what's different, fast.
- High-cardinality events: Honeycomb handles rich, high-cardinality data that traditional metrics systems struggle with.
- OpenTelemetry-native: Telemetry, SLOs, Service Map, and a Canvas AI Copilot are built on open instrumentation.
Why choose Honeycomb: Teams debugging complex distributed systems, where the hard problems hide in specific user, region, or version slices, get the most from Honeycomb's event model. It excels when you need to ask new questions of your data quickly.
Honeycomb pricing: The Free plan is free forever for up to 20 million events per month, suitable for testing and individual projects. Pro starts at $130 per month for up to 1.5 billion events per month, billed monthly or annually. Enterprise is custom. Honeycomb holds a 4.7/5 rating on G2, the highest on this list.
11. Sentry
Sentry is application monitoring software for developers to detect, debug, and fix errors, performance issues, and production problems. It combines error tracking with performance monitoring in a single developer-centric tool.
Best for: Developer and engineering teams that need application error monitoring, tracing, debugging context, and production issue resolution workflows.
Key strengths
- Error plus performance: Sentry pairs error monitoring and tracing so developers see the error and the slow transaction behind it.
- Code-level context: Session replay and release health connect issues to specific releases and code paths.
- Broad SDK coverage: Logs, metrics, profiling, uptime monitoring, and cron monitoring span many languages and frameworks.
Why choose Sentry: Development teams that want error tracking and performance monitoring in one developer-first tool, rather than a heavy ops platform, find Sentry a natural fit. It shines closest to the code.
Sentry pricing: The Developer plan is free for one user. Team starts at $26 per month billed annually with unlimited users and third-party integrations. Business starts at $80 per month billed annually, adding unlimited custom dashboards, anomaly detection, and SAML plus SCIM support. Enterprise is custom. Sentry holds a 4.5/5 rating on G2.
12. SolarWinds AppOptics
SolarWinds AppOptics is an APM and infrastructure monitoring product positioned for SMB and mid-market teams. It pairs distributed tracing with host and infrastructure monitoring in a single, dashboard-driven view.
Best for: Cost-conscious SMB and mid-market teams that want APM and infrastructure monitoring without enterprise-tier complexity.
Key strengths
- Tracing plus infrastructure: Distributed tracing and host monitoring sit together, giving full-stack context in one place.
- Mid-market fit: Packaging and pricing are aimed at teams that find enterprise platforms heavier than they need.
- Dashboards: Built-in dashboards make it straightforward to visualize application and infrastructure health.
Why choose SolarWinds AppOptics: Smaller teams that want solid tracing and infrastructure monitoring without enterprise overhead get a practical, cost-aware option here. It fits best when budget and simplicity outweigh the deepest possible feature set.
SolarWinds AppOptics pricing: AppOptics is typically priced per host per month, with tiers separating infrastructure monitoring from full APM with tracing. Confirm current per-host rates on the SolarWinds pricing page before you commit, since packaging changes. Check the live SolarWinds AppOptics listing on G2 for the current rating.
How to choose the right APM tool
Twelve strong tools, one decision. Use this checklist to match the tool to your stack and team.
Instrumentation effort and OpenTelemetry support
How fast can you get data flowing? Tools with auto-instrumentation agents (Dynatrace, Datadog) reduce setup, while OpenTelemetry support keeps you vendor-neutral. If you want to instrument once and stay portable, prioritize native OTLP ingest.
Distributed tracing and full-stack correlation depth
Check how deeply the tool traces requests across services and how well it correlates traces with logs, metrics, and RUM. For microservices, full-fidelity tracing (Splunk) or high-cardinality events (Honeycomb) can matter more than dashboard polish.
Pricing model and data retention costs
Pricing models vary widely: per-host, per-user, ingestion-based, and event-based. Model your real telemetry volume, since data retention costs can dwarf the base price at scale. A cheaper entry tier can cost more once ingest grows.
AI-assisted root-cause and anomaly detection
Causal AI (Dynatrace's Davis) and anomaly detection (Datadog's Watchdog) cut investigation time during incidents. Evaluate how much guessing the tool removes, not just whether it has an AI label.
Cloud-native, multicloud, and integration fit
Match the tool to where you run. CloudWatch fits AWS-native teams, Prometheus fits Kubernetes, and Elastic fits ELK shops. Confirm the integrations and clouds you actually use before you sign.
Conclusion
There is no single best APM tool, only the best fit for your stack. For full-stack observability in one platform, Datadog leads. For AI-driven causal root cause across complex multicloud estates, Dynatrace is the strongest pick. New Relic suits teams consolidating tools with a real free tier, and Amazon CloudWatch is the obvious choice for AWS-native shops.
If you want open standards and free tooling, Prometheus with Grafana (or managed Grafana Cloud) is hard to beat. For high-cardinality debugging, Honeycomb stands out, and Sentry wins for developer-centric error plus performance monitoring.
The next step is simple. Shortlist two or three tools from the comparison table that match your stack, then run a free trial against one real, production-like service. Instrument it, simulate a slow transaction, and see which tool surfaces the root cause fastest. The right APM tool will prove itself in that first incident, not in a feature list. If your evaluation also includes presales tooling, our roundup of the best presales software tools and the best product analytics software are worth a look alongside your observability shortlist.
FAQ
An application performance monitoring tool is software that tracks how an application performs in production, measuring response time, error rates, throughput, and traces to detect and resolve issues. It answers what is APM in practice: it tells you whether your app is healthy and, when it isn't, why. The apm meaning comes down to visibility into performance plus the ability to find root cause fast.
APM monitors known performance signals like latency, errors, and throughput that you already expect to track. Observability is broader, letting you investigate unknown issues by querying traces, logs, and metrics together to answer questions you didn't anticipate. Most modern application monitoring tools now span both, so the line is increasingly blurred in practice.
APM tools use several pricing models: per-host (Datadog, Splunk), per-user plus ingestion (New Relic), per-CPU-core (AppDynamics), consumption-based (Dynatrace), and event-based (Honeycomb, Sentry). Entry prices range from free open-source options to enterprise contracts. Watch data retention and ingestion costs, since they often grow faster than the base price as your telemetry volume scales.
Most modern application performance monitoring software on this list supports OpenTelemetry, including Datadog, New Relic, Grafana Cloud, Splunk Observability Cloud, Honeycomb, and Elastic APM. Vendor-neutral instrumentation matters because it lets you instrument your code once and send telemetry to any backend. That reduces lock-in and makes switching tools far less painful later.
For fully open-source monitoring, Prometheus paired with Grafana is the standard, especially for Kubernetes and cloud-native infrastructure, free under the Apache 2.0 license. Beyond that, several vendors offer real free tiers worth evaluating, including New Relic, Grafana Cloud, Sentry, and Honeycomb. The right choice depends on whether you want to self-operate or prefer a managed free tier.
Logging tells you what happened in individual services, but it rarely tells you why a request was slow across a distributed system. APM adds distributed tracing and correlation that logging alone lacks, following a single request end to end. The two are complementary: logs give detail, APM gives the cross-service picture and root cause.
APM (application performance monitoring) is the act of tracking and analyzing performance signals in production. Application performance management is the broader strategic discipline that includes monitoring, plus capacity planning, optimization, and aligning performance to business outcomes. In short, the monitoring is one component of the wider application performance management software practice.
In a microservices app, a single request can cross dozens of services, and APM tools use distributed tracing to follow it end to end and pinpoint the slow span. They add container and Kubernetes visibility, plus dependency mapping that shows how services relate. That makes it possible to diagnose issues that logs and metrics alone cannot isolate across a dynamic, cloud-native stack.