


Your telemetry bill is growing faster than your user base. According to the Sawmills AI State of Observability and Telemetry Report (2025), organizations actively use only 13% of the telemetry they collect for monitoring, alerting, or troubleshooting. The other 87% is still ingested, still stored, still billed.
Meanwhile, Grafana Labs found in its 2025 observability survey that organizations now run an average of eight observability technologies. Each one wants data in its own format. Each charges differently. And engineering teams keep shipping more services, which means telemetry volume compounds every quarter.
The root issue is not dashboards or alerts. It is control. Without a layer between your telemetry sources and your downstream tools, every byte gets routed to the most expensive destination by default. You cannot drop debug logs from healthy services. You cannot mask tokens before they hit an external SIEM. You cannot send the same event to application performance monitoring tools and a data lake without duplicating agents.
Observability pipeline software gives you that control layer. This guide covers 15 tools that sit between your telemetry sources and your destinations, so you can decide what to keep, where it goes, and how much it costs.
What's inside
This guide compares 15 observability pipeline software tools for platform engineers, SRE teams, security operations, and product and data leaders who care about instrumentation quality and telemetry cost.
- Who this is for: Teams managing telemetry cost, routing complexity, or sensitive-data controls
- Selection criteria: Category fit, telemetry processing depth, routing flexibility, OpenTelemetry support, and market presence
- What we compare: Best use case, key differentiator, pricing model, and G2 rating
- How to read the list: Start with your bottleneck, whether that is cost, redaction, routing, or vendor-neutral collection
TL;DR
- Best overall for enterprise telemetry routing: Cribl Stream handles multi-source, multi-destination pipelines at scale with a free tier up to 1 TB/day
- Best for Datadog-first teams: Datadog Observability Pipelines manages filtering, enrichment, and dual-shipping inside your existing operating model
- Best for OpenTelemetry-first teams: OpenTelemetry Collector is the free, vendor-neutral standard for teams that want portability over managed control planes
- Best lightweight agent for edge and Kubernetes: Fluent Bit keeps resource footprint minimal while supporting 100+ input and output plugins
- Best for high-cardinality debugging: Honeycomb Telemetry Pipeline pairs sampling and rehydration with Honeycomb's event-driven observability
- Best for security-heavy data routing: DataBahn and Axoflow both target SIEM cost control and security telemetry pipelines; your SIEM and syslog stack determines which fits better
What is observability pipeline software?
Observability pipeline software collects, processes, transforms, filters, samples, enriches, and routes telemetry data before it reaches monitoring, security, storage, or analytics tools.
Unlike observability platforms, which store and visualize telemetry, pipeline software operates upstream. It intercepts logs, metrics, events, and traces (MELT telemetry) in flight and applies rules before anything lands in a paid destination. The distinction matters because ingest-based pricing makes every unfiltered byte expensive.
Core capabilities to look for:
- Collection: Accept telemetry from agents, collectors, applications, cloud services, and network sources via OpenTelemetry, OTLP, syslog, HTTP, Kafka, and common log formats
- Processing: Parse, enrich, normalize, mask, deduplicate, and transform data in motion
- Routing: Send different telemetry streams to observability platforms, SIEMs, object storage, and data platforms simultaneously
- Cost control: Drop, sample, aggregate, or archive lower-value data before it reaches paid ingest
- Governance: Manage schema, access, pipelines, retention, and audit controls across your telemetry estate
- Standards support: Align with OpenTelemetry and OTLP so instrumentation is portable across vendors
Where observability pipeline software sits relative to adjacent categories:
A telemetry collector like Fluent Bit or the OpenTelemetry Collector handles ingestion and forwarding. A full observability pipeline product adds transformation, enrichment, routing logic, governance, and replay. An event streaming platform like Kafka provides durable buffering between producers and consumers but does not interpret telemetry semantics by default. Some tools in this list, such as OpenObserve and Axiom, also serve as the destination backend, not only the pipeline.
Understanding where your bottleneck sits, collection, processing, routing, or storage, determines which category of tool you actually need. For product and platform leaders, big data analytics software decisions often intersect with pipeline choices when telemetry lands in a warehouse or data lake.
When to use observability pipeline software
Control telemetry costs before they hit paid destinations
Ingest-based pricing turns verbose logging into a budget problem. A single Kubernetes cluster emitting health logs at the default interval can generate millions of low-value lines per hour. Observability pipeline software lets you drop debug logs from healthy services while keeping full fidelity for errors, payment flows, onboarding activations, and enterprise account traffic. That distinction, what to keep versus what to drop, is a product decision as much as a platform one.
Route the same telemetry to observability and security teams
Your APM tool, SIEM, object storage layer, and data warehouse may all need access to overlapping telemetry. Routing that data with four separate agents creates four inconsistent schemas and four maintenance surfaces. A pipeline layer fans out from one collection point to multiple destinations, keeps schemas consistent, and gives each team what they need without duplicating instrumentation.
Redact sensitive data before it leaves your environment
Tokens, user identifiers, emails, payment references, and internal metadata frequently appear in log lines. Sending those fields to external tools without masking creates exposure. Observability pipeline software applies redaction rules in transit, so the data reaching your SIEM or vendor APM never contains the raw sensitive values. This is about enforcing controls, not achieving compliance outcomes on its own.
Observability pipeline software comparison
The table below covers all 15 tools, sorted by relevance to the core pipeline use case. Pricing and G2 ratings reflect verified data from vendor pricing pages and live G2 listings as of November 2026.
| # | Product | Best for | Key differentiator | Pricing | G2 rating |
|---|---|---|---|---|---|
| 1 | Cribl Stream | Enterprise telemetry routing | Vendor-neutral routing and transformation, 80+ sources and destinations | From $0.27/GB (Standard Cloud Worker) | 4.6/5 |
| 2 | Datadog Observability Pipelines | Datadog-centered teams | Managed pipeline control inside Datadog's existing operating model | From $0.095/GB/month | 4.4/5 |
| 3 | Honeycomb Telemetry Pipeline | High-cardinality debugging | Sampling, rehydration, and OTel-native transformation tied to Honeycomb | Custom pricing | 4.5/5 |
| 4 | OpenTelemetry Collector | Vendor-neutral open standards | Free, community-maintained collector with receivers, processors, exporters | Free (open source) | N/A |
| 5 | Fluent Bit | Lightweight edge and Kubernetes log collection | High-performance, low-footprint agent with 100+ built-in plugins | Free (open source) | N/A |
| 6 | Fluentd | Plugin-rich log aggregation | Broad plugin ecosystem for diverse sources and destinations | Free (open source) | 4.4/5 |
| 7 | Kafka | Durable event streaming backbone | Replayable, fault-tolerant event log for high-throughput telemetry | Free (open source; managed pricing varies) | 4.5/5 |
| 8 | Axoflow | Security and observability data routing | Autonomous security data layer for syslog and cloud-native telemetry | Custom pricing | N/A |
| 9 | DataBahn | Security telemetry pipeline control | AI-powered filtering and routing for SIEM cost reduction | Custom pricing | 4.8/5 |
| 10 | Edge Delta | Edge processing and cost control | AI-native observability with pre-ingest stream analysis | From $20/month (Pro) | 4.4/5 |
| 11 | Bindplane | OpenTelemetry fleet management | Visual, no-code pipeline builder for OTel collector fleets | Free tier available; Growth at $499/month | N/A |
| 12 | Chronosphere Telemetry Pipeline | Cloud-native metrics and cardinality control | Throughput-based pricing with cardinality and cost governance | Custom pricing | 4.5/5 |
| 13 | OpenObserve | Open-source observability storage plus ingestion | Unified logs, metrics, traces, and RUM with low per-GB pricing | From $0.50/GB ingested (Cloud) | 5.0/5 |
| 14 | Axiom | Developer-friendly telemetry storage and analysis | Usage-based platform with AI features, APL querying, and free personal tier | Free personal tier; Cloud from $25/month | N/A |
| 15 | Apica Flow | Telemetry flow management and governance | Zero-loss buffering, replay, and AI-assisted rule authoring | Custom pricing | 4.2/5 |
Best 15 observability pipeline software tools
1. Cribl Stream
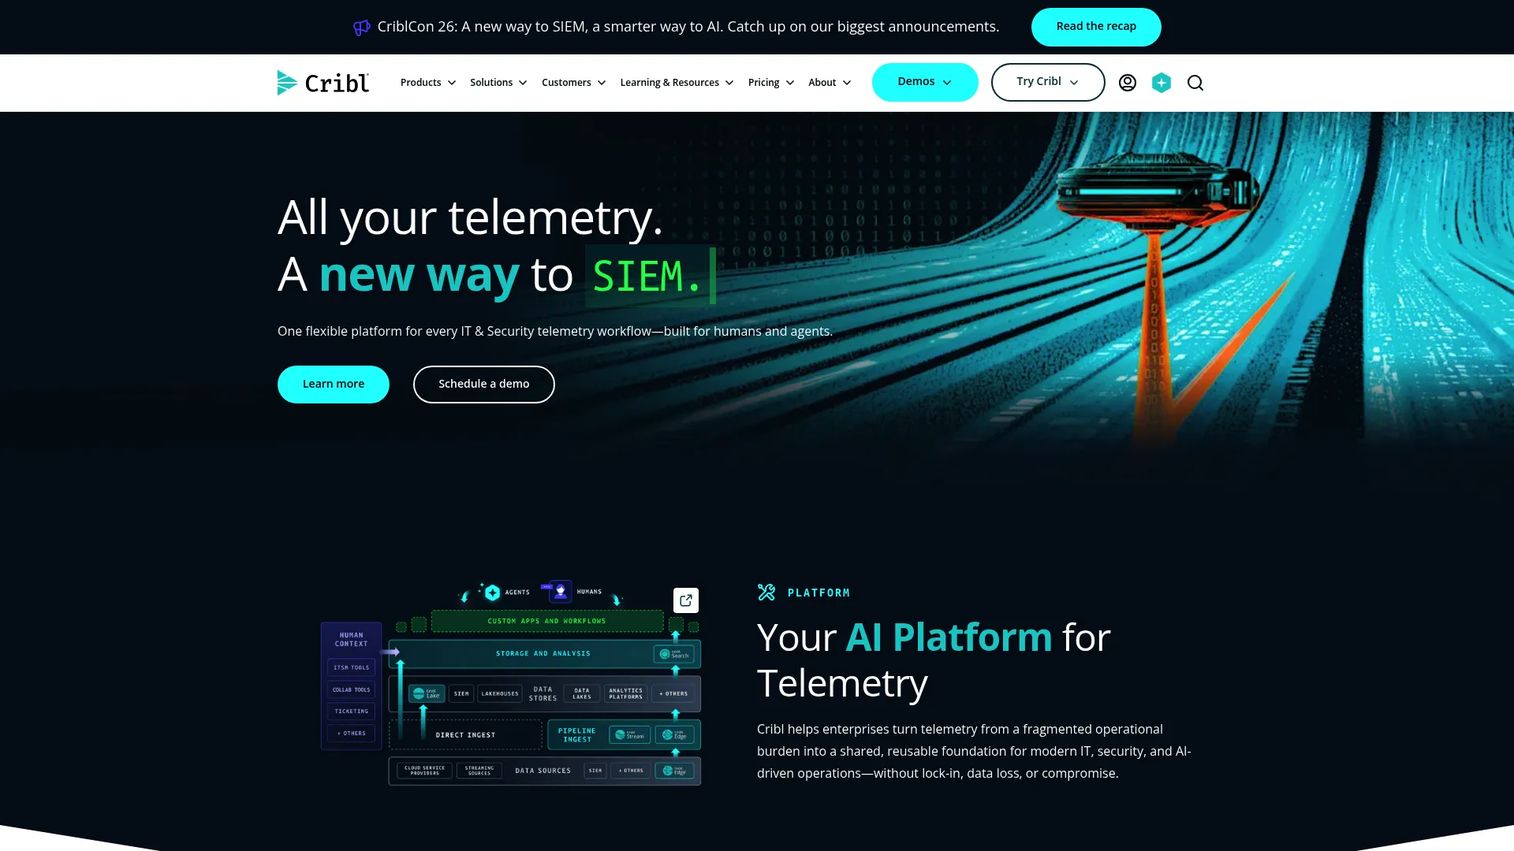
Cribl Stream is an observability pipeline that collects, reduces, enriches, transforms, and routes telemetry from more than 80 sources to more than 80 destinations. It operates across cloud-hosted and self-managed environments, acting as a vendor-neutral routing layer that sits between your agents and your downstream tools. Teams use it to reduce data volume, normalize schemas, replay archived telemetry, and fan out to multiple destinations from a single collection point.
Best for: Enterprise platform, SRE, and security teams managing high telemetry volume across multiple observability and SIEM destinations.
Key features
- 80+ source and destination connectors for logs, metrics, and traces
- Stream processing with filtering, transformation, enrichment, and aggregation
- Replay archived telemetry from low-cost object storage
- Schema normalization and data reduction workflows
- Deployment via cloud-managed or self-hosted workers
Why choose Cribl Stream: Choose Cribl when you need a vendor-neutral routing layer across both your observability and security stacks. It fits teams who want to reduce ingest costs without locking into one vendor's pipeline model.
Cribl Stream pricing: Cribl uses consumption-based pricing measured in credits, where one credit equals one US dollar. Standard Cloud Worker ingestion runs at $0.27 per GB, Enterprise Hybrid Worker at $0.26 per GB, and Enterprise Cloud Worker at $0.32 per GB. The Free plan covers up to 1 TB per day with no license required.
G2 rating: 4.6/5
2. Datadog Observability Pipelines
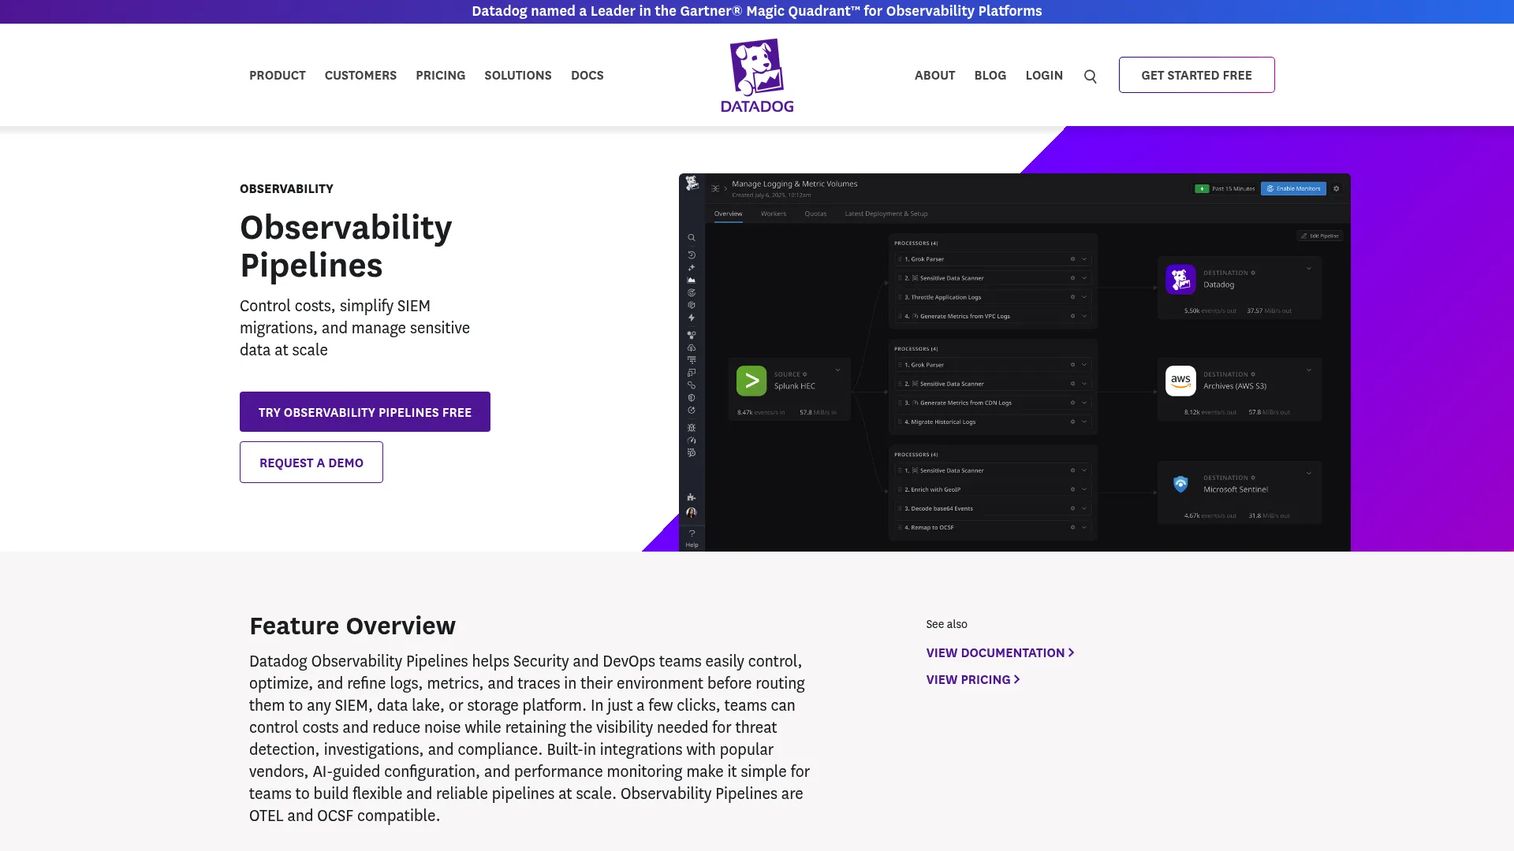
Datadog Observability Pipelines is a telemetry pipeline product built for security and DevOps teams that already run Datadog as their primary observability platform. It deploys an Observability Pipelines Worker alongside your existing agents, then applies processor rules for filtering, sampling, enrichment, redaction, and dual-shipping before data reaches SIEMs, data lakes, or storage systems.
Best for: Organizations standardized on Datadog that want pipeline management without introducing a separate control surface.
Key features
- Observability Pipelines Worker for source, processor, and destination management
- Prebuilt pipeline templates for common patterns such as filtering, archiving, and dual-shipping
- Metric tag governance to control cardinality and cost
- Sensitive data redaction with GeoIP and threat intelligence enrichment
- Pipeline health monitoring via Live Capture and centralized dashboards
Why choose Datadog Observability Pipelines: Choose it when Datadog is already your primary observability platform and your team wants consistent operations rather than managing a separate pipeline tool. It is less compelling if Datadog is not your destination.
Datadog Observability Pipelines pricing: Usage-based pricing starts at $0.095 per ingested GB per month when billed annually, or $0.12 per GB on-demand. Teams processing above 30 TB per month can contact Datadog for per-vCPU pricing. A free trial is available.
G2 rating: 4.4/5
3. Honeycomb Telemetry Pipeline
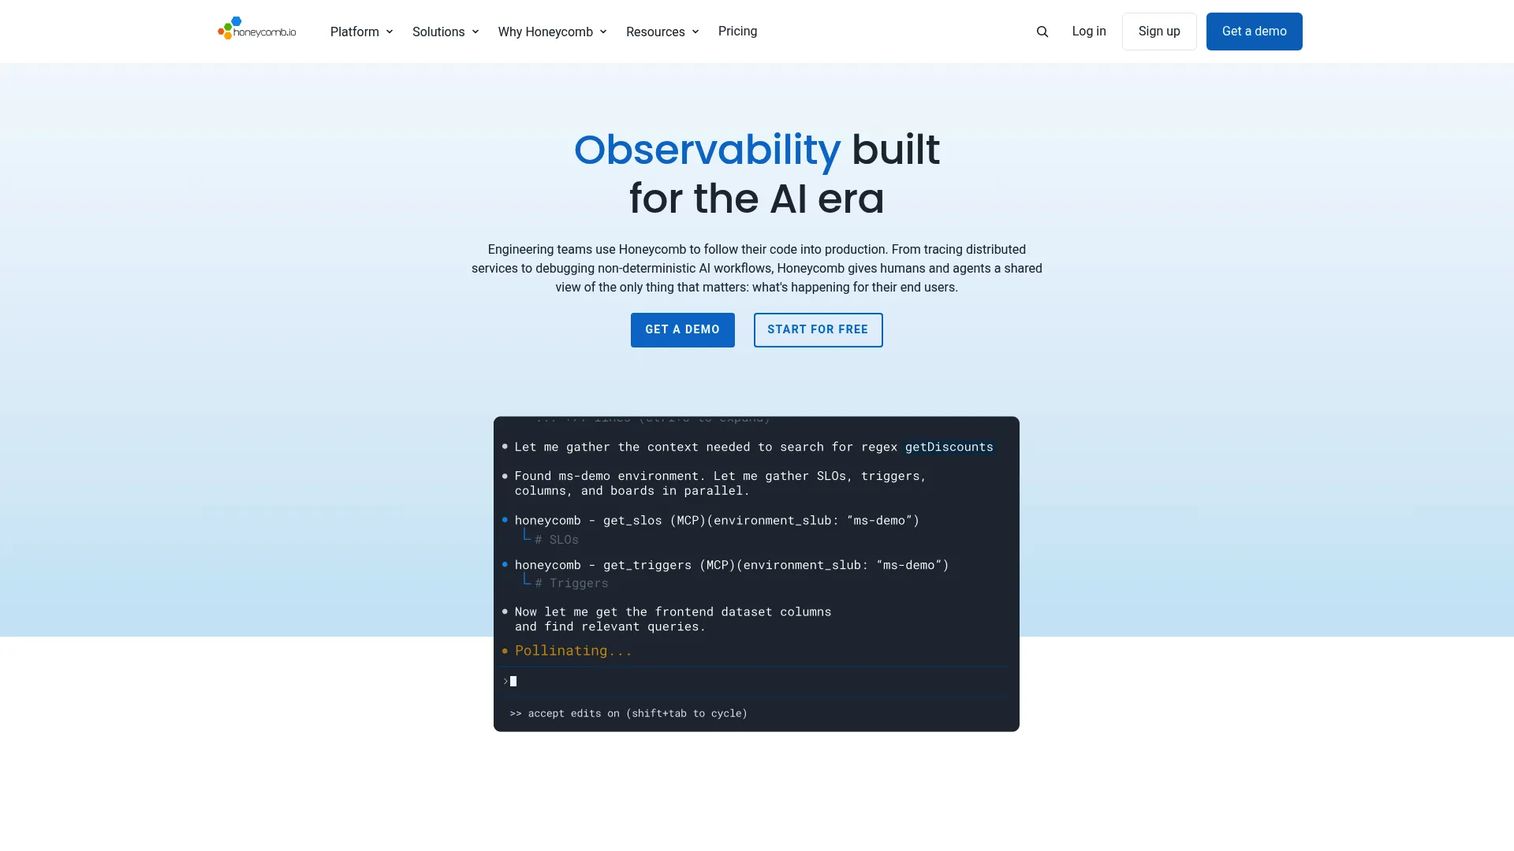
Honeycomb offers telemetry pipeline capabilities designed for engineering and SRE teams that use Honeycomb for high-cardinality, event-driven observability. The pipeline layer handles ingestion, buffering, transformation, sampling, routing, and export, with OpenTelemetry-native support throughout. Rehydration from S3 is a standout capability, letting teams archive at lower cost and retrieve full-fidelity data when debugging a release or incident.
Best for: Engineering teams using Honeycomb for production debugging where the core problem is understanding system behavior, not simply moving log files.
Key features
- Sampling and full-fidelity rehydration from S3
- Log structuring, deduplication, and on-demand replay
- OpenTelemetry-native transformation and collector fleet management
- Telemetry routing and enrichment workflows
- Export integrated with Honeycomb's core observability platform
Why choose Honeycomb Telemetry Pipeline: Choose it when your team's primary need is production debugging with high-cardinality data, and you want pipeline and analysis in one consistent workflow. It is tightly coupled to Honeycomb, which is a strength if you are already there.
Honeycomb Telemetry Pipeline pricing: Contact Honeycomb sales for current packaging. Honeycomb does offer a free tier for the broader platform.
G2 rating: 4.5/5
4. OpenTelemetry Collector
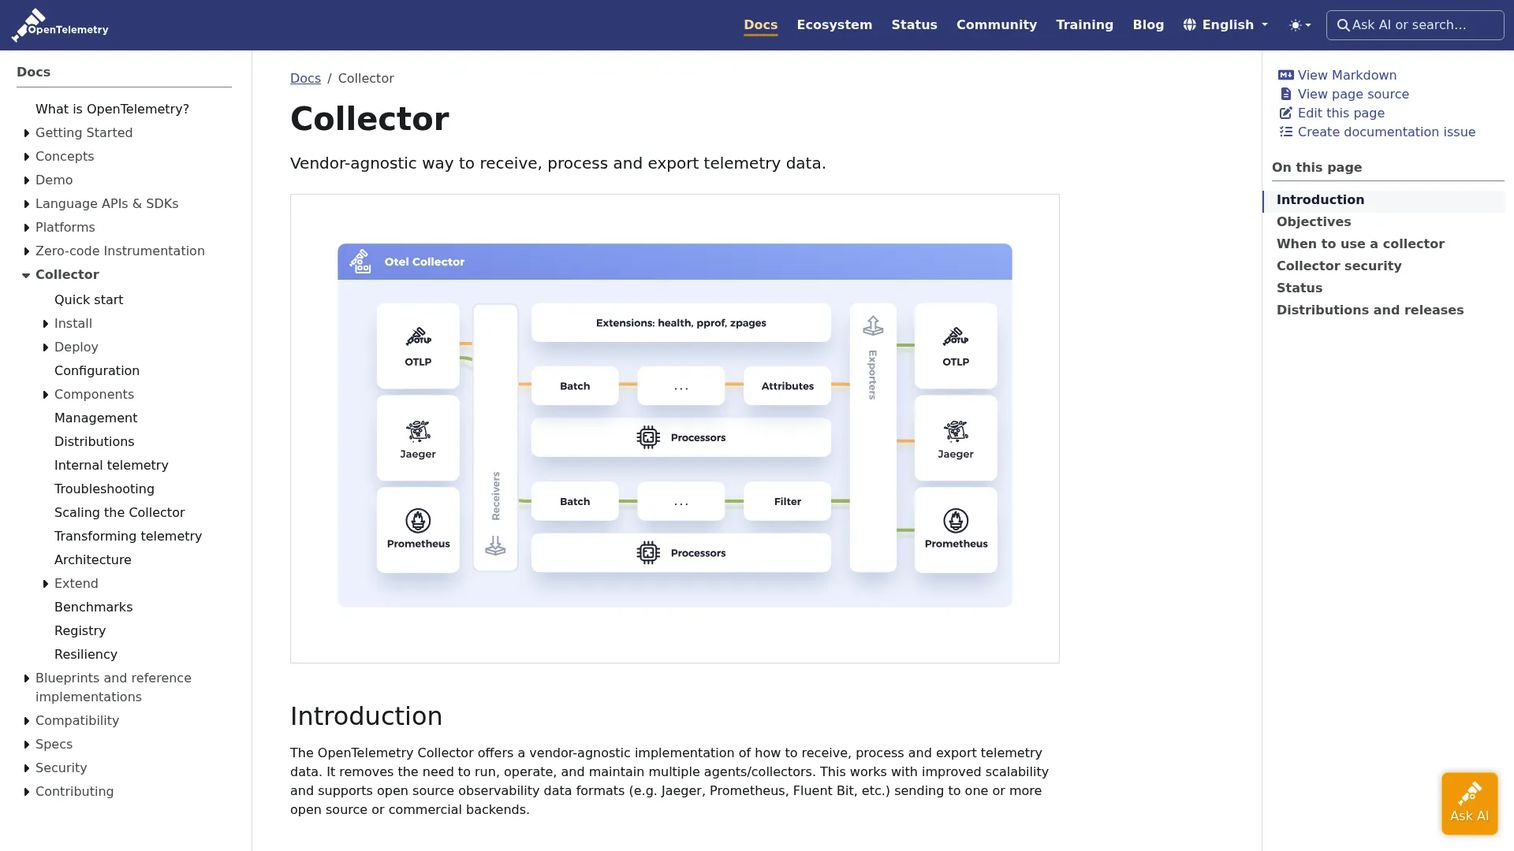
The OpenTelemetry Collector is a vendor-agnostic, open-source implementation for receiving, processing, and exporting telemetry data. It supports a receiver, processor, and exporter architecture, letting teams build pipelines that accept traces, metrics, and logs from multiple protocols and forward them to one or more backends. According to a Riverbed global survey (2025), 88% of enterprises have begun implementing OpenTelemetry, which reflects how foundational this project has become.
Best for: Engineering and platform teams that want vendor-neutral telemetry collection with no licensing cost and full control over their pipeline configuration.
Key features
- Receivers for OTLP, Jaeger, Prometheus, Zipkin, syslog, and many other protocols
- Processors for filtering, sampling, transformation, and attribute manipulation
- Exporters to open-source and commercial backends
- Extensions for health checks, authentication, and configuration management
- Open-source under the CNCF umbrella
Why choose OpenTelemetry Collector: Choose it when standardization and portability matter more than buying a managed control plane. The tradeoff is engineering investment: Configuration, deployment, and maintenance require internal capacity. For API monitoring tools and distributed systems, it removes instrumentation lock-in that becomes expensive at scale.
OpenTelemetry Collector pricing: Completely free as an open-source project. Internal engineering cost for deployment and ongoing maintenance is the real variable to plan for.
5. Fluent Bit
Fluent Bit is a lightweight, open-source telemetry agent and observability pipeline optimized for high-performance, low-resource environments. It is widely deployed as the standard log forwarder for Kubernetes, edge devices, containers, and hybrid cloud infrastructure. Fluent Bit handles log collection, metric gathering, trace forwarding, filtering, enrichment, buffering, and routing, and ships with more than 100 built-in input, filter, and output plugins.
Best for: Engineering teams that need an efficient, scalable telemetry agent for Kubernetes, edge, container, or resource-constrained environments.
Key features
- 100+ built-in input, filter, and output plugins
- OpenTelemetry-native ingestion and delivery
- Stream processing with SQL-based queries
- Prometheus-compatible metrics collection
- Low CPU and memory footprint for edge and embedded workloads
Why choose Fluent Bit: Choose Fluent Bit when the collection layer must stay small and fast. It is not a full observability pipeline product, but it is the right component when you need a proven forwarder that integrates into a larger pipeline architecture.
Fluent Bit pricing: Free open-source project distributed under the Apache License 2.0.
6. Fluentd
Fluentd is a mature, open-source data collector for building a unified logging layer. Its plugin-based architecture connects hundreds of data sources and destinations, covering cloud services, databases, applications, syslog sources, and storage systems. Fluentd uses memory and file-based buffering for reliability, and its JSON-oriented data model makes parsing and formatting flexible across diverse log formats.
Best for: Organizations that need a flexible, plugin-rich open-source log aggregation pipeline with broad ecosystem support.
Key features
- Large plugin ecosystem with input, parser, filter, output, and buffer plugins
- Memory and file-based buffering for reliable log delivery
- Multi-destination output routing
- Data parsing, formatting, and normalization
- Open-source deployment under Apache 2.0
Why choose Fluentd: Choose Fluentd when you have diverse log sources and need community-maintained plugins for custom routing. Compared to Fluent Bit, Fluentd carries a heavier resource footprint but provides a broader plugin library for complex aggregation requirements.
Fluentd pricing: Free and fully open-source under the Apache 2.0 license.
G2 rating: 4.4/5
7. Kafka
Apache Kafka is an open-source distributed event streaming platform built for high-throughput, fault-tolerant data pipelines. In an observability architecture, Kafka typically serves as a durable streaming backbone between telemetry producers and downstream consumers such as processors, storage systems, and analytics platforms. It is not purpose-built for MELT semantics but excels at buffering, replay, and decoupling producers from consumers at scale.
Best for: Teams that need a resilient, replayable event streaming layer between telemetry systems, particularly at high throughput.
Key features
- Durable, fault-tolerant event log storage
- High-throughput publish-subscribe streaming
- Replayable topics for historical telemetry access
- Producer-consumer decoupling across telemetry systems
- Kafka Connect for integrating event sources and sinks
Why choose Kafka: Choose Kafka when telemetry needs a resilient backbone before processing or storage, especially where replay capability is essential. Teams typically pair Kafka with collectors like Fluent Bit and processors like the OpenTelemetry Collector rather than using it as a standalone observability pipeline.
Kafka pricing: Apache Kafka is free and open-source. Managed Kafka pricing depends on the cloud provider, with options from AWS, GCP, and Azure each carrying different cost structures.
G2 rating: 4.5/5
8. Axoflow
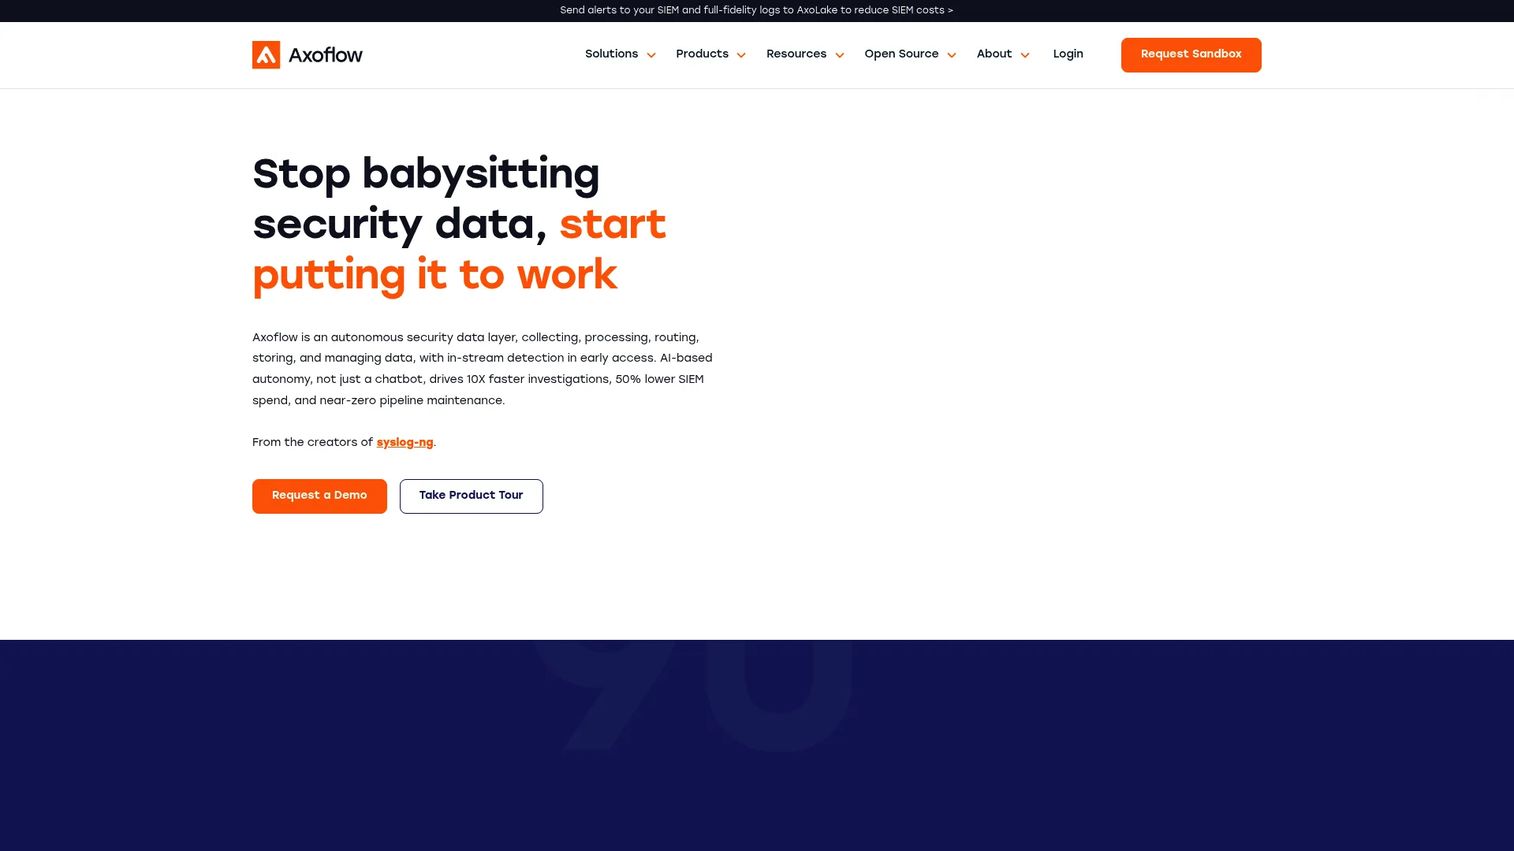
Axoflow is an autonomous security data layer that collects, classifies, processes, routes, stores, and manages security telemetry. It targets enterprise security operations teams dealing with the dual challenge of legacy syslog infrastructure and modern cloud-native telemetry, providing automatic data collection and classification alongside policy-based routing to SIEMs and storage destinations. Pipeline topology views and flow monitoring give security engineers visibility into what is moving where.
Best for: Enterprise security operations and managed security providers needing automated security data pipelines and SIEM cost control across both syslog-heavy and cloud-native environments.
Key features
- Automatic security data collection and classification
- Parsing, normalization, enrichment, and reduction in transit
- Policy-based routing to SIEMs, data lakes, and storage
- Pipeline topology views and flow monitoring
- Queryable local storage with federated search capability
Why choose Axoflow: Choose Axoflow when your team is modernizing a syslog-heavy telemetry pipeline and needs a routing model that handles legacy security data alongside cloud-native sources. Its focus is narrower than a general-purpose pipeline tool, which makes it more opinionated for security-specific workflows.
Axoflow pricing: Axoflow describes a linear pricing model but does not display plan prices; contact sales for a quote.
9. DataBahn
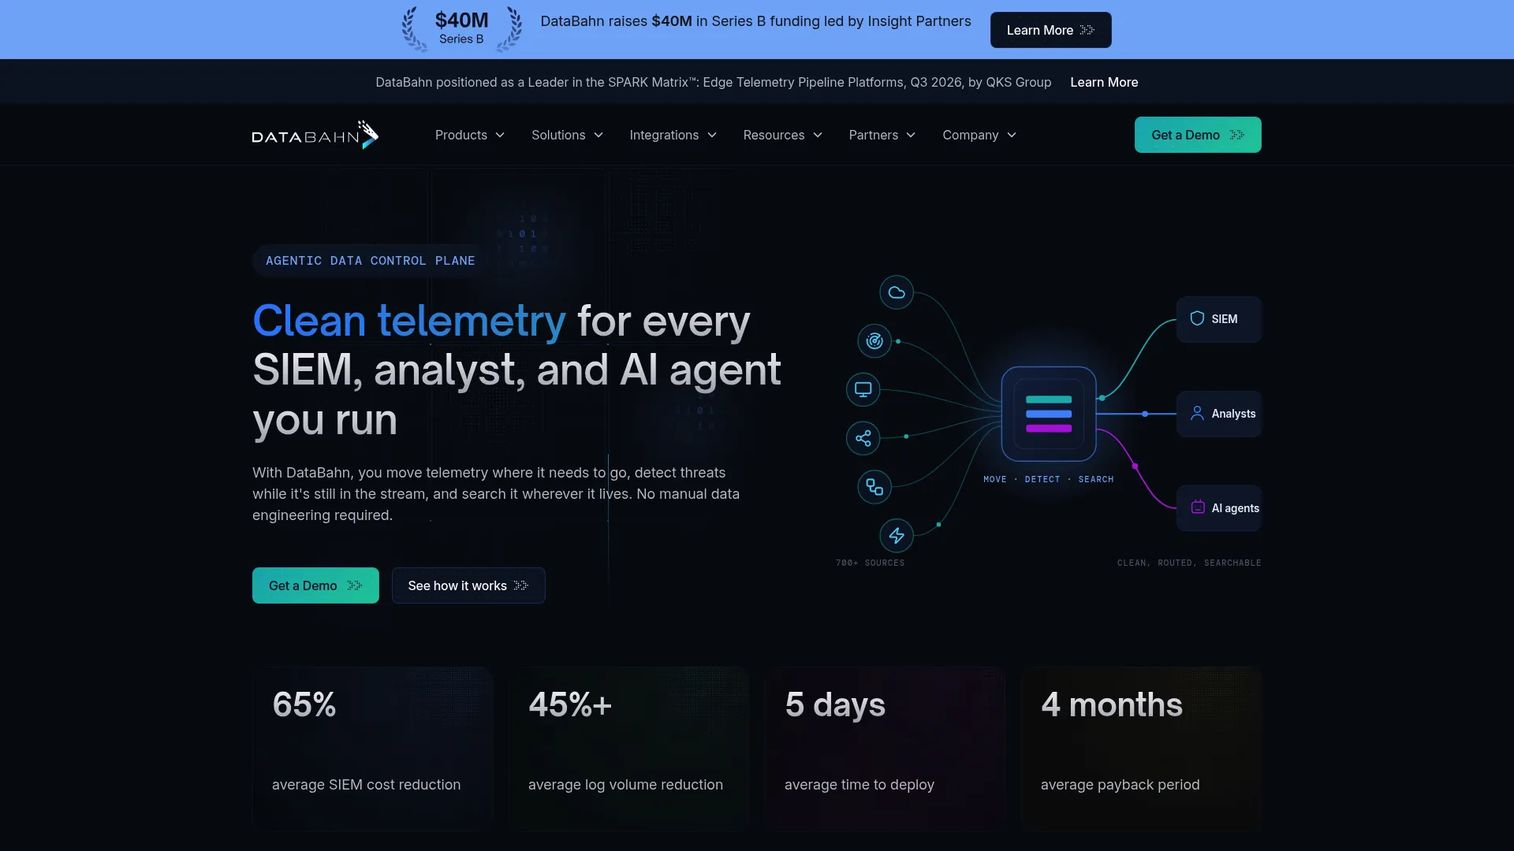
DataBahn is an agentic data control plane for moving, transforming, governing, and analyzing security, observability, application, and IoT/OT telemetry. Its AI-powered pipeline applies filtering, normalization, transformation, routing, and schema-drift management in stream, then delivers data to SIEMs, data lakes, storage systems, and analytics destinations. A contextual knowledge graph called Reef enables multi-source correlation and in-stream intelligence for source-health monitoring and sensitive data masking.
Best for: Enterprise security, observability, and data teams that need to reduce SIEM ingest costs while improving pipeline control, governance, and AI readiness.
Key features
- AI-powered filtering, normalization, transformation, and routing
- In-stream sensitive data masking and threat detection
- 600+ integrations for data sources and destinations
- Reef contextual knowledge graph for multi-source correlation
- Agent and agentless collection methods
Why choose DataBahn: Choose DataBahn when security data volume is the primary cost and governance problem. The AI-assisted reduction layer is particularly useful for teams sending noisy security telemetry to per-event SIEM pricing models. For teams also evaluating AI governance tools, DataBahn's schema drift and data-quality detection capabilities are worth examining.
DataBahn pricing: Contact sales for pricing. The site directs visitors to request a demo.
G2 rating: 4.8/5 (from 4 reviews)
10. Edge Delta
Edge Delta is an AI-native observability platform that combines telemetry pipelines with AI-assisted incident detection, investigation, and response. Its pipeline capabilities cover filtering, masking, normalization, enrichment, routing, and governance across logs, metrics, traces, and events. The key architectural difference from pure pipeline tools is that Edge Delta performs stream analysis close to the source, reducing what reaches centralized ingest before the data ever leaves the edge.
Best for: Engineering and SRE teams that want to detect signal earlier, reduce centralized ingest load, and use AI teammates for incident investigation alongside standard pipeline operations.
Key features
- Edge telemetry processing with pre-ingest filtering and normalization
- AI teammates for SRE, security engineering, and software engineering workflows
- Native log, metric, trace, and event observability
- Masking, enrichment, routing, and governance pipelines
- Dashboards, monitors, service maps, and workflow integrations
Why choose Edge Delta: Choose Edge Delta when you want to detect anomalies and reduce telemetry closer to the source rather than after centralized ingest. The AI-assisted investigation layer differentiates it from pure pipeline tools, though that breadth means more to configure.
Edge Delta pricing: A 14-day Hobby trial is free. The Pro plan starts at $20 per month and includes $20 of credits. Enterprise pricing requires contacting the team.
G2 rating: 4.4/5
11. Bindplane
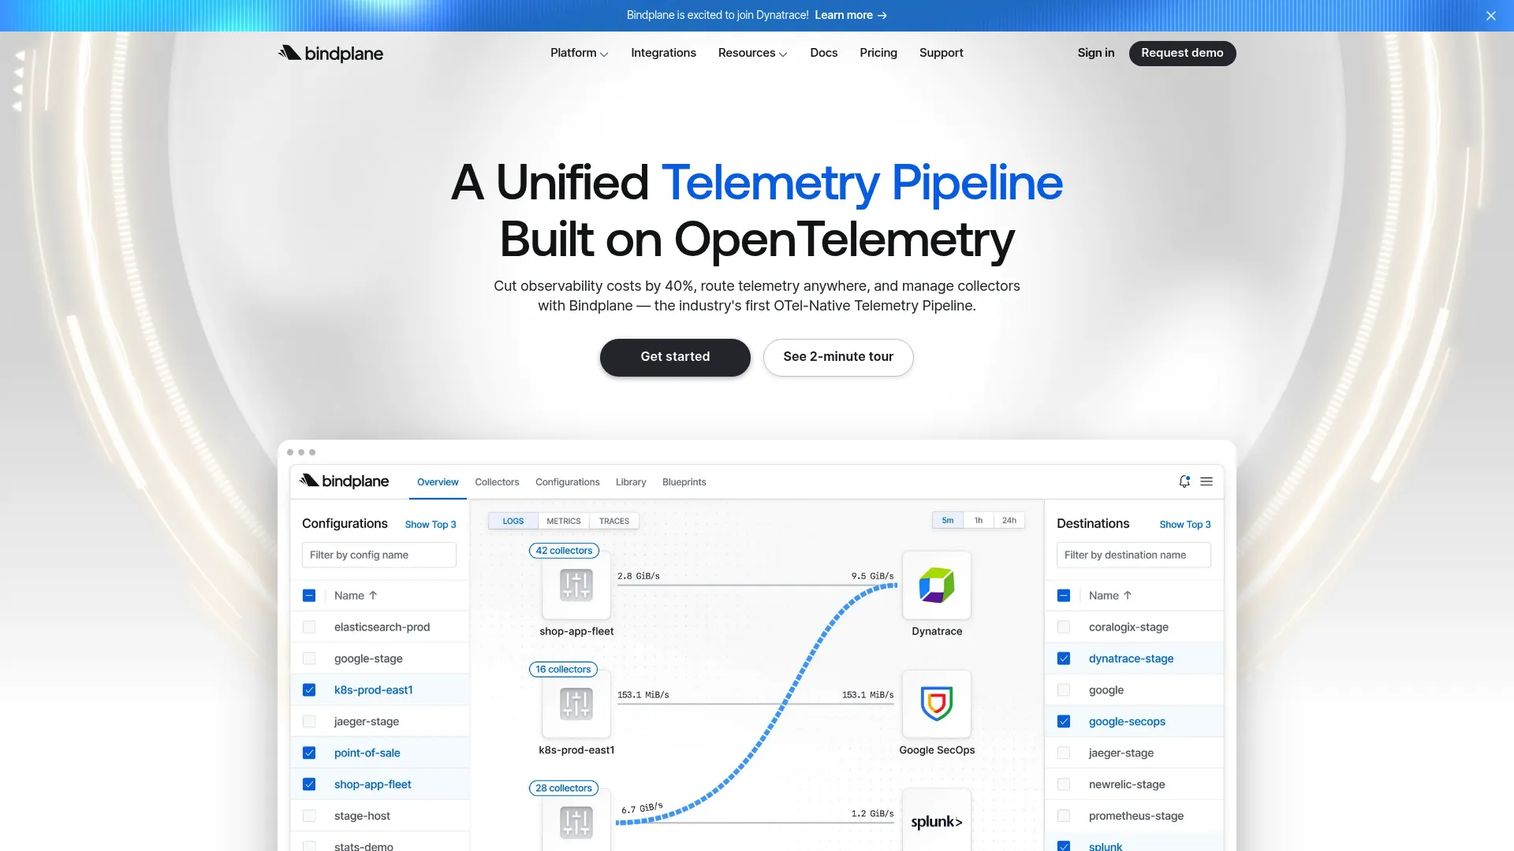
Bindplane is an OpenTelemetry-native telemetry pipeline for centrally managing, configuring, and operating fleets of OpenTelemetry Collectors. Teams that want to standardize on the OpenTelemetry Collector but find hand-managing YAML configurations across dozens or hundreds of collectors operationally painful use Bindplane as the control plane. Its visual, no-code pipeline builder handles filtering, enrichment, transformation, masking, and aggregation without requiring engineers to edit configuration files directly.
Best for: Observability and security teams standardizing on OpenTelemetry that need centralized fleet management rather than per-collector configuration management.
Key features
- Centralized OpenTelemetry Collector fleet management and rollouts
- Visual, no-code pipeline builder with real-time flow visibility
- Processors for filtering, enrichment, transformation, and masking
- Routing from sources to destinations with transformation preview
- Enterprise-grade governance and access controls
Why choose Bindplane: Choose Bindplane when OpenTelemetry is the standard but managing individual collector configurations creates operational drag. It preserves the vendor-neutral advantage of OTel while adding the management layer most large deployments eventually need.
Bindplane pricing: The Free plan covers 1 project, 10 collectors, and 100 GB/day at $0 per month. Growth runs $499 per month for 50 collectors and 200 GB/day. Enterprise pricing is custom for unlimited scale.
12. Chronosphere Telemetry Pipeline
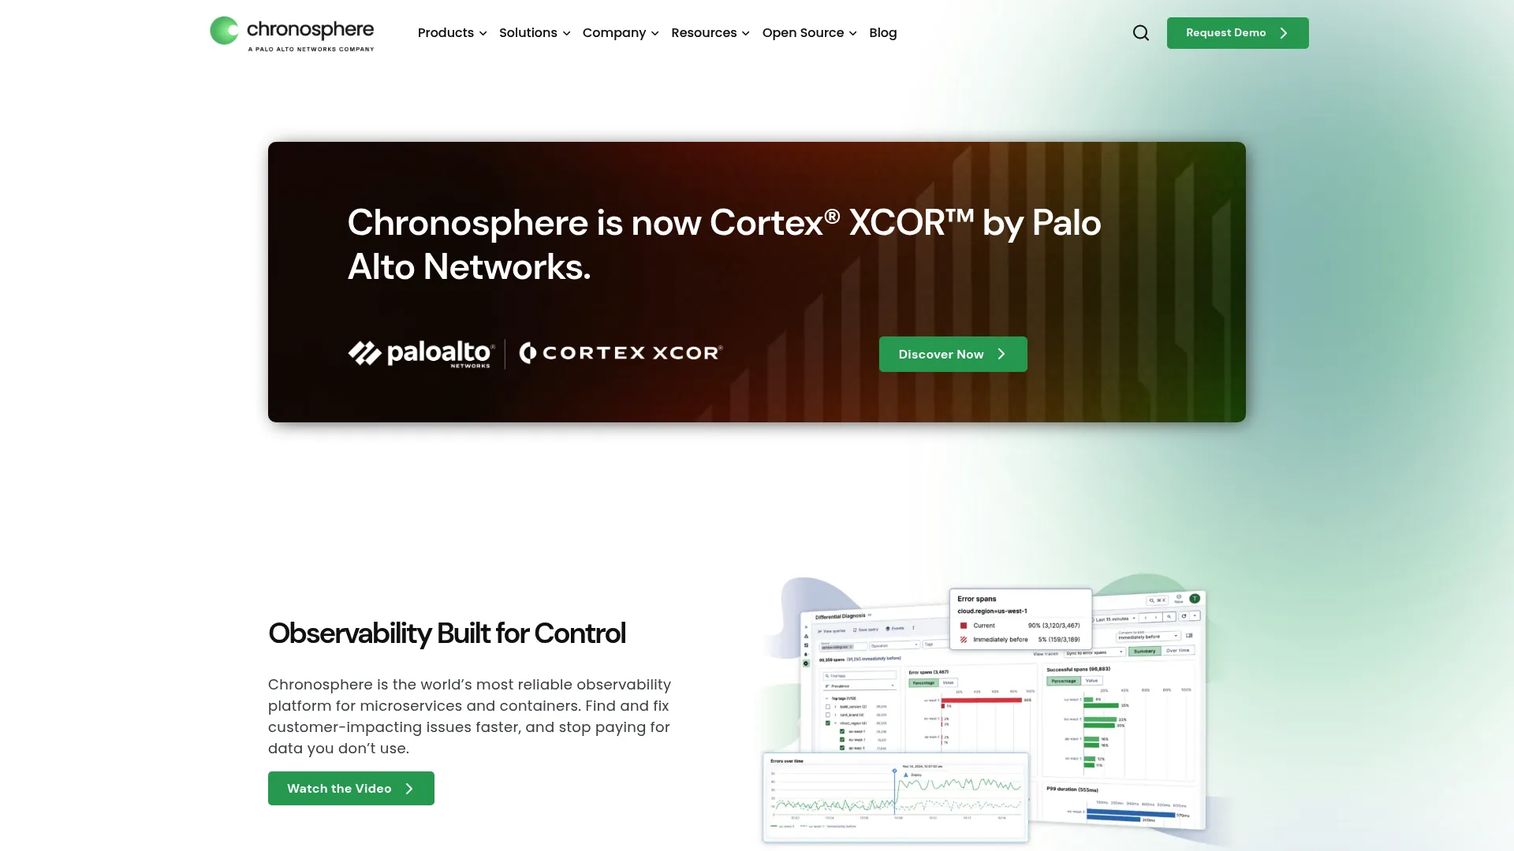
Chronosphere Telemetry Pipeline collects, transforms, enriches, reduces, and routes observability and security data from any source to any destination. Its architecture is Kubernetes-native with automatic healing, retries, high availability, and load balancing built in. The low-code drag-and-drop pipeline builder includes a testing Playground for validating rules before deployment, and Chronosphere also centrally manages Fluent Bit fleets alongside its own pipeline workers.
Best for: Enterprise observability and security teams dealing with high-cardinality metrics growth in cloud-native environments where both cost governance and routing flexibility matter.
Key features
- Low-code, drag-and-drop pipeline builder with testing Playground
- Cardinality management and cost governance for metrics
- Support for observability platforms, SIEMs, Kafka, ClickHouse, and cloud object storage as destinations
- Kubernetes-native architecture with high availability and automatic healing
- Centralized Fluent Bit fleet management
Why choose Chronosphere Telemetry Pipeline: Choose it when metrics volume and cardinality are the budget problem. Chronosphere's throughput-based pricing model rewards teams that invest in upstream reduction before data reaches expensive observability backends.
Chronosphere Telemetry Pipeline pricing: Pricing is based on raw data throughput. Contact Chronosphere for a custom quote.
G2 rating: 4.5/5
13. OpenObserve
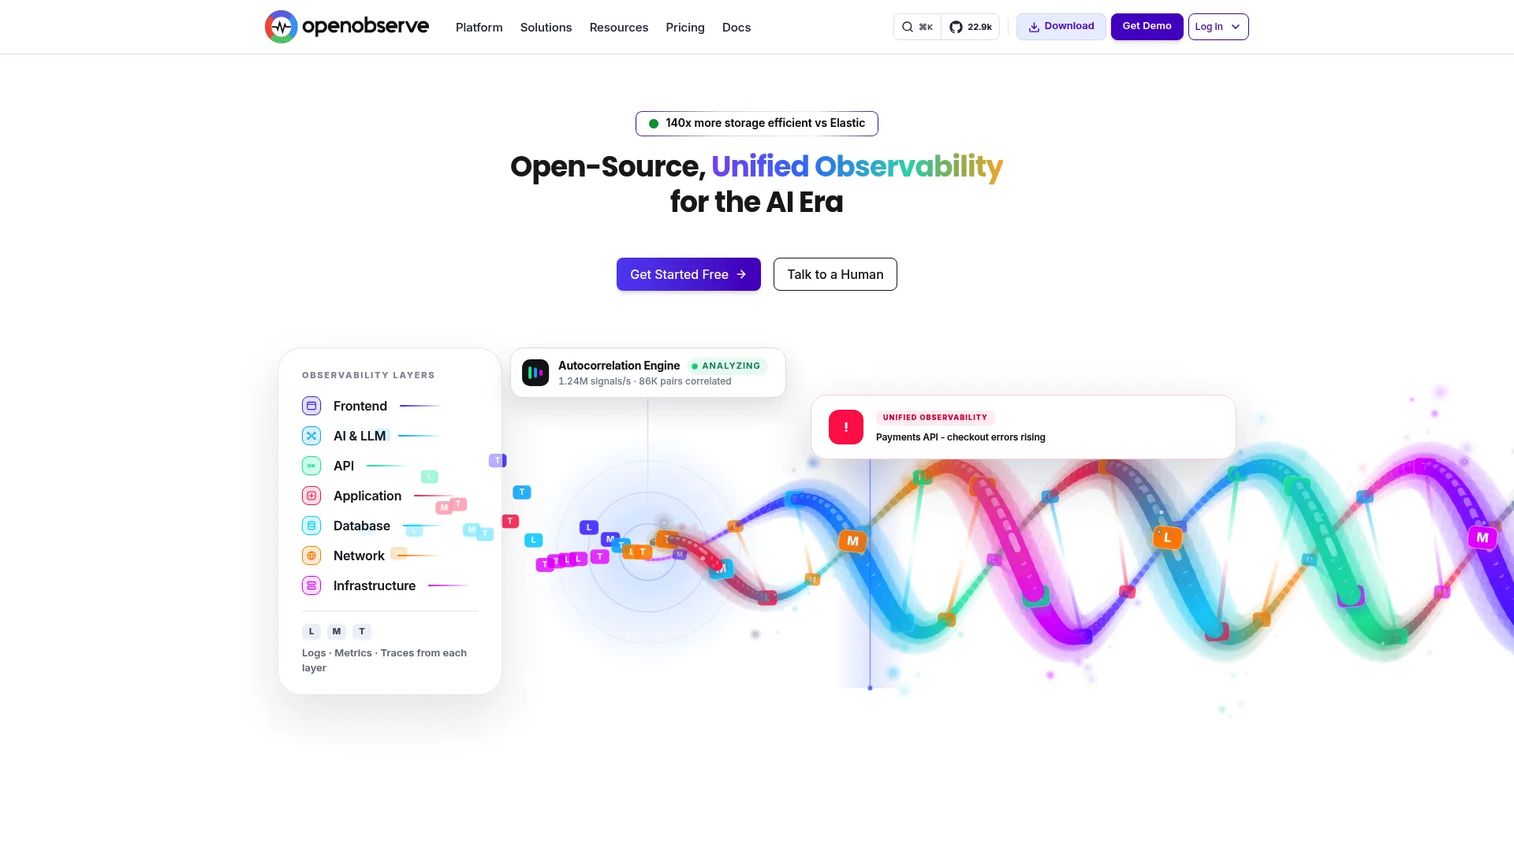
OpenObserve is an open-source, unified observability platform supporting logs, metrics, traces, real user monitoring, and LLM monitoring in a single system. Unlike tools that focus only on the pipeline layer, OpenObserve also serves as the destination backend, covering ingestion, storage, querying, dashboards, and alerting. This makes it relevant both as a pipeline-adjacent ingestion layer and as a lower-cost replacement for expensive observability backends.
Best for: Engineering and DevOps teams that want open-source observability storage with low per-GB pricing and do not want to operate separate pipeline and storage systems.
Key features
- Logs, metrics, traces, RUM, and LLM monitoring in one platform
- SQL and full-text search querying
- Dashboards and alerting workflows
- Open-source self-hosted deployment or cloud-managed with configurable retention
- Usage-based cloud pricing starting at $0.50 per GB ingested
Why choose OpenObserve: Choose OpenObserve when the destination platform cost is part of the pipeline problem. If your current backend charges $5 or more per GB and you are storing logs that rarely get queried, OpenObserve's self-hosted option or $0.50 per GB cloud tier changes the math materially.
OpenObserve pricing: Cloud Pay As You Go is $0.50 per GB ingested. Self-Hosted Open Source is free. Self-Hosted Enterprise is free up to 50 GB/day. A 14-day cloud trial is available.
G2 rating: 5.0/5 (from 5 reviews)
14. Axiom
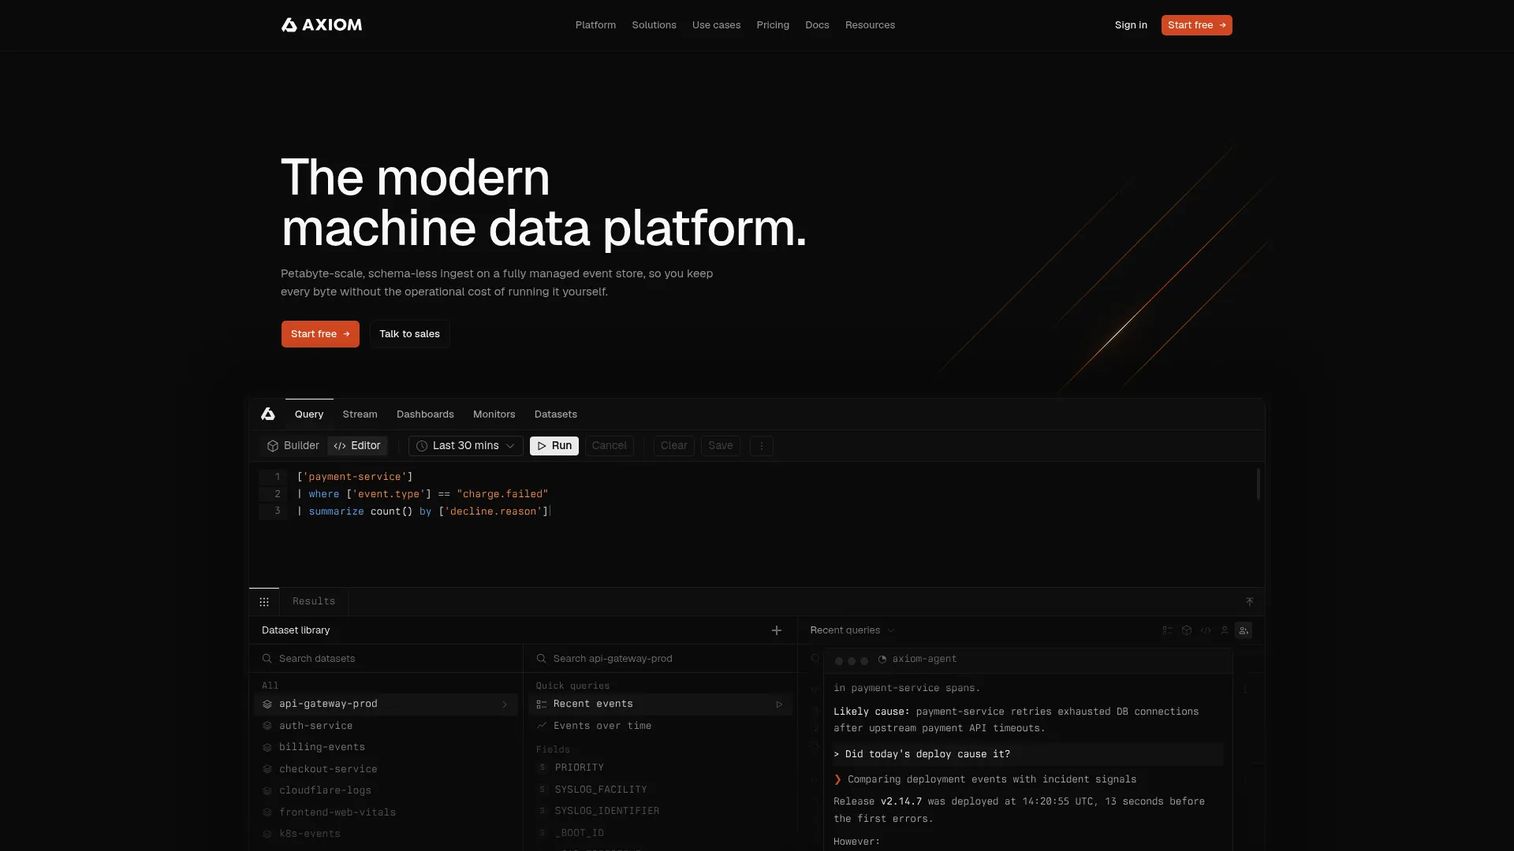
Axiom is a managed machine-data and observability platform built for developer teams that need high-volume telemetry ingest, fast query, configurable retention, and AI-powered analysis. It supports logs, traces, metrics, and events, with OpenTelemetry and integrations for AWS, Kubernetes, Cribl, and Vector. Axiom's AI features include Spotlight for anomaly detection, an MCP server, and LLM observability, positioning it at the intersection of modern telemetry storage and AI-assisted analysis.
Best for: Developer and platform teams needing a modern, usage-based telemetry platform with fast query and AI-assisted investigation capabilities.
Key features
- High-volume ingest for logs, traces, metrics, and events
- Axiom Processing Language and Metrics Processing Language for query
- AI-powered features including Spotlight anomaly detection and MCP server
- OpenTelemetry support and integrations for Kubernetes, AWS, Cribl, and Vector
- Configurable retention and threshold, match, and anomaly monitors
Why choose Axiom: Choose Axiom when your team wants a developer-friendly telemetry destination with modern query capabilities and a generous free personal tier. It is more of a destination platform than a pure routing pipeline, though its OpenTelemetry and Cribl integrations mean it plugs naturally into pipeline architectures.
Axiom pricing: The Personal tier is free and includes 500 GB per month of data loading and 30-day retention. Axiom Cloud starts at $25 per month platform fee plus usage, with 1 TB data loading and 100 GB-hours of query compute included.
15. Apica Flow
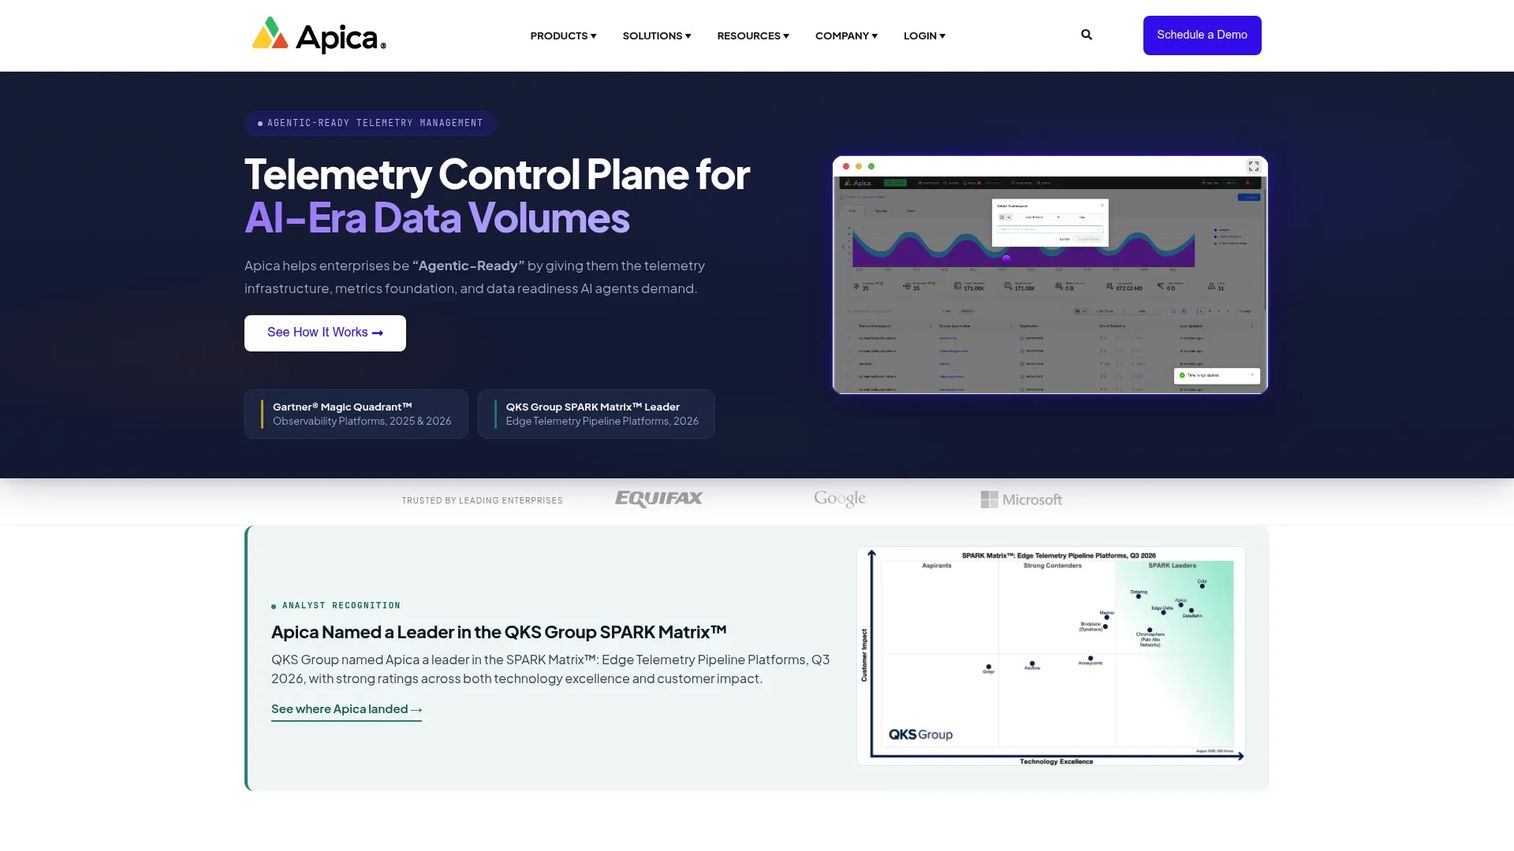
Apica Flow is an OpenTelemetry-native telemetry pipeline that intercepts, transforms, enriches, governs, and routes observability data before it reaches downstream platforms. Its zero-loss buffering capability (InstaStore) holds data during outages and replays it without gaps, while AI-assisted pipeline rule authoring generates routing and transformation rules with human approval steps. Apica Flow also offers historical telemetry replay, 200+ pre-built integrations, and Kubernetes-native elastic scaling.
Best for: Enterprise platform, SRE, and security teams that need centralized telemetry control, governance, and replay capability alongside broader observability and synthetic monitoring operations.
Key features
- Zero-loss buffering with InstaStore for outage recovery and replay
- Real-time filtering, transformation, enrichment, redaction, and routing
- AI-assisted pipeline rule authoring with human approval workflows
- 200+ pre-built integrations with OpenTelemetry support
- Kubernetes-native elastic scaling and historical telemetry replay
Why choose Apica Flow: Choose Apica Flow when pipeline work needs to connect to broader observability operations, including synthetic monitoring. The zero-loss buffering and AI-assisted rule authoring differentiate it from tools that require manual configuration for complex routing scenarios.
Apica Flow pricing: Licensed based on data ingested in gigabytes per month. Contact Apica for a quote.
G2 rating: 4.2/5
Considerations when choosing observability pipeline software
Format fit: Collector, pipeline, or destination
The 15 tools above are not all doing the same job. Fluent Bit, Fluentd, and the OpenTelemetry Collector are collection and forwarding components. Cribl Stream, Datadog Observability Pipelines, Bindplane, Chronosphere, Axoflow, DataBahn, and Apica Flow are purpose-built pipeline control planes. OpenObserve and Axiom are destination platforms that also handle ingestion. Identify your bottleneck first. If the problem is routing and cost control, a pipeline product fits better than a heavier backend. If the problem is storage cost, the destination choice matters more. For teams evaluating application security software, the data handling and redaction capabilities of the pipeline layer deserve as much scrutiny as the destination.
OpenTelemetry support
OpenTelemetry compatibility is now a practical requirement for most teams. According to Riverbed's 2025 survey, 88% of enterprises have started OTel adoption. A pipeline that cannot receive or export OTLP creates a re-instrumentation cost that compounds with every new service. Prioritize tools that treat OTel as a first-class protocol, not a checkbox. For product teams, OTel alignment also means API monitoring tools and performance tracking are portable as your observability stack evolves.
Cost controls and cardinality management
Filtering, sampling, deduplication, aggregation, and tag governance are the mechanisms that actually reduce your bill. A PM monitoring onboarding should keep full fidelity for activation events while sampling repetitive health-check logs. Ask each vendor how they handle high-cardinality tags and whether sampling rules can be applied per-service or per-event type. The specificity of those controls determines how much cost you can actually recover.
Security, redaction, and data control
Sensitive data appears in telemetry more often than teams expect. Tokens, internal identifiers, and payment references frequently end up in log lines. Look for tools with field-level masking, pattern-based redaction, and audit controls for who can configure pipeline rules. Avoid framing any tool as making your environment compliant; that is a process outcome, not a product feature. Evaluate API security tools alongside your pipeline choice if telemetry from API layers contains sensitive headers or response bodies.
Operational ownership
Who runs the pipeline? A self-hosted OpenTelemetry Collector or Fluentd deployment requires platform or SRE engineering capacity for configuration, upgrades, and incident response. A managed product like Datadog Observability Pipelines or Bindplane reduces operational burden but adds vendor dependency. Name the team, their current capacity, and their release cadence before shortlisting. A pipeline that nobody maintains becomes a bottleneck faster than the problem it replaced.
Conclusion
Observability pipeline software is not a monitoring tool. It is a control layer that decides what telemetry is worth keeping, where it goes, how much fidelity it needs, and who can see it. For product and platform leaders, that control directly affects instrumentation quality, release confidence, and the accuracy of activation and retention data.
Here is a quick summary to help narrow the shortlist:
- Cribl Stream is the strongest general-purpose choice for enterprise multi-destination routing
- Datadog Observability Pipelines fits teams already committed to Datadog as their primary observability backend
- OpenTelemetry Collector is the right starting point for teams prioritizing portability and open standards
- Fluent Bit handles edge and Kubernetes log collection with minimal resource overhead
- DataBahn and Axoflow both target security-heavy SIEM routing workflows; your existing syslog stack and cloud mix determine which fits better
- Chronosphere Telemetry Pipeline addresses cloud-native metrics cardinality at scale
- Bindplane adds a management layer for teams already running OpenTelemetry Collectors
Start with your bottleneck, not the tool. Map your telemetry sources, identify your most expensive destinations, and list any sensitive fields that need masking. Then shortlist three tools and validate against your deployment model and team capacity.
Start your journey with Guideflow today!
FAQs
Observability pipeline software collects, processes, transforms, filters, samples, enriches, and routes telemetry data before it reaches monitoring, security, storage, or analytics tools. It operates as a control layer between your telemetry sources and your downstream destinations, letting teams decide what data is worth keeping, where it goes, and in what format. This upstream control is what separates pipeline software from observability platforms, which store and visualize data after ingestion.
The terms are closely related and often used interchangeably. Telemetry pipeline is the broader infrastructure term covering any system that moves raw telemetry, while observability pipeline typically emphasizes logs, metrics, events, and traces used specifically for debugging, monitoring, and incident response. In practice, most vendors now use both terms to describe products that perform the same core functions of ingestion, transformation, routing, and governance.
For teams with engineering capacity and a standards-first approach, the OpenTelemetry Collector can serve as the core pipeline component. It handles receivers, processors, exporters, and extensions across all major telemetry types. The tradeoff is operational overhead: Configuration is YAML-based, fleet management requires additional tooling like Bindplane, and there is no managed control plane. Commercial pipeline products add governance UIs, support contracts, enterprise access controls, and prebuilt templates that reduce the engineering burden significantly.
The main levers are filtering, sampling, deduplication, aggregation, and routing lower-value data to cheaper storage. For example, debug logs from healthy services can be dropped or archived to object storage at a fraction of the cost of sending them to a full-text search platform. High-cardinality metric tags can be dropped or aggregated before they hit per-series pricing in a managed metrics platform. Duplicate events from multiple agents can be deduplicated before SIEM ingestion. The result is that only the telemetry your team actually needs to query or alert on reaches expensive backends.
The right fit depends on your SIEM, syslog infrastructure, and cloud environment. DataBahn targets AI-powered filtering and routing for high-volume security telemetry going to SIEMs and data lakes. Axoflow focuses on automating security data collection and classification across syslog-heavy and cloud-native sources. Cribl Stream handles both observability and security routing in one vendor-neutral platform. Datadog Observability Pipelines fits security teams already using Datadog. Evaluate each against your specific SIEM destinations and sensitive data handling requirements.
A pipeline can process logs, metrics, events, traces, spans, syslog messages, audit events, cloud service logs, Kubernetes pod and node logs, application events, identity system events, firewall logs, and CI/CD pipeline events. The practical answer is: Any structured or semi-structured telemetry your team is currently sending directly to an expensive destination without filtering or enrichment is a candidate for pipeline processing.
Yes, though usually indirectly. Product managers depend on reliable instrumentation to measure activation, retention, and feature adoption. When telemetry is poorly routed or incomplete, activation rate data becomes unreliable, and failed releases can look like user behavior problems. Poor instrumentation also makes incident root-cause analysis slower, which extends the window where user experience is degraded. A well-configured observability pipeline ensures the data flowing into product analytics and customer experience monitoring is accurate, complete, and consistent across releases. For teams using best product analytics software, the quality of upstream telemetry determines the quality of every downstream metric.
Start by mapping your telemetry sources, the number of agents currently running, and your top three destinations by cost. Identify any sensitive fields that need masking or redaction. Check whether the tool supports your required protocols: OTLP, syslog, HTTP, Kafka, or cloud-native log APIs. Confirm the deployment model, cloud-managed or self-hosted, and which team will own ongoing maintenance. Verify OpenTelemetry compatibility if you are standardizing on OTel instrumentation. Finally, ask each vendor how sampling rules and cardinality controls are configured, since those details determine how much cost reduction you can achieve in practice.