The packet loss is intermittent. The application team blames the network. The network team needs proof. Without visibility into what is actually moving across the wire, that argument drags on while users complain and the deal stalls.
Network traffic analysis gives you the evidence to close that loop. It tells you what is happening on the network, where congestion lives, which endpoints are chattering the loudest, and whether that traffic looks suspicious. According to Mordor Intelligence (2026), the global network traffic analysis market is estimated at $4.91 billion in 2026, growing at 11.06% annually through 2031, driven largely by security and threat detection use cases, which account for nearly a third of current market revenue. The tools that serve this market range from free packet capture utilities to enterprise flow monitoring platforms and virtual network security suites. Picking the wrong layer wastes time. This guide helps you pick the right one.
What's inside
This guide is for network engineers, security analysts, IT operations leads, and presales teams supporting technical validation. Tools were selected based on:
- Relevance to packet capture, flow analysis, or traffic visibility
- Deployment model: Free, open-source, commercial, hardware, or platform
- Pricing transparency and availability of review data
- Coverage across both troubleshooting and security investigation use cases
The guide compares four tool types: Packet capture and command-line analyzers, commercial flow monitoring platforms, visibility infrastructure (TAPs and SPAN ports), and observability stack components including indexing and visualization tools.
TL;DR
- Best free packet analyzer: Wireshark, the reference tool for deep protocol inspection
- Best for enterprise flow monitoring: SolarWinds NetFlow Traffic Analyzer, for bandwidth dashboards and top-talker analysis
- Best command-line packet capture: Tcpdump, available on nearly every Unix-like system
- Best for Elastic-native traffic telemetry: Elastic Packetbeat, paired with Elasticsearch and Kibana
- Best for passive packet access: Network TAPs, for reliable out-of-band visibility in production environments
- Best for virtualized network security: VMware NSX and VMware vDefend Advanced Threat Prevention, for VMware Cloud Foundation environments
What is network traffic analysis software?
Network traffic analysis software helps teams capture, inspect, summarize, and interpret data moving across a network so they can troubleshoot performance, investigate security events, and understand traffic behavior.
The category covers several distinct approaches. Understanding which one you need is the first decision.
Packet capture records raw packets for deep inspection. You see exactly what was in each frame, including protocol headers, payload content, timing, and retransmission patterns. This is how you prove what happened.
Flow analysis summarizes network conversations. Instead of recording every packet, flow protocols such as NetFlow, sFlow, and IPFIX report who talked to whom, on which port, for how long, and how many bytes moved. Flow analysis answers scale questions: Bandwidth usage, top talkers, application mix, and capacity trends.
Traffic access methods such as network TAPs and SPAN ports are not analysis tools. They get packets to the analysis tool. Without reliable traffic access, the best analyzer sees nothing.
Security monitoring looks for anomalies, unauthorized connections, lateral movement, and policy violations. Some tools specialize here; others treat security as a downstream use of packet or flow data.
Observability stack components such as Elasticsearch and Kibana store, index, and visualize traffic telemetry at scale. They belong in the stack when volume is high or cross-team investigation is needed.
Key capabilities to look for in this category:
- Packet capture and protocol decoding across hundreds of protocols
- NetFlow, sFlow, or IPFIX flow collection and aggregation
- Top-talker and bandwidth analysis by application, endpoint, or protocol
- Display filters, search, and capture-file analysis
- Dashboards, threshold alerts, and scheduled reporting
- Integrations with SIEM platforms or observability stacks
- Support for cloud, virtual, and on-premises environments
When to use network traffic analysis tools
Troubleshoot intermittent performance issues
An application is slow, but the cause is unclear. Packet capture lets you see retransmissions, TCP window issues, DNS delays, and congestion patterns that logs rarely surface. Flow analysis narrows the window faster: You can identify which source generated the spike, which application consumed the bandwidth, and when the problem started. Use both layers when the symptoms are elusive.
Investigate suspicious network behavior
Security teams reach for traffic data when something looks wrong: A host calling out to an unexpected destination, unusual volume from an internal system, or traffic patterns that suggest lateral movement. Traffic analysis does not replace endpoint detection or SIEM controls, but it provides the network-layer evidence that corroborates or refutes a theory. The detail level matters: Packet capture shows payload context, while flow data shows connection patterns at scale.
Validate bandwidth and capacity planning
Flow analysis tools built around application performance monitoring can show you which branch office is saturating its uplink, which application consumes the most bandwidth during business hours, and how traffic trends shift over weeks. For presales teams, this use case is common during technical validation: Buyers want proof that a monitoring tool can show usage patterns over time, not just point-in-time snapshots.
Network traffic analysis tools comparison
These tools are not interchangeable. Some inspect packets, some summarize flows, some provide visibility infrastructure, and others help index or visualize traffic telemetry. The table below positions each tool by its primary job, not by feature count.
| # | Product | Best for | Key differentiator | Pricing | G2 rating |
|---|---|---|---|---|---|
| 1 | Wireshark | Free packet inspection | Deep protocol decoding, open-source | Free | 4.7/5 |
| 2 | SolarWinds NetFlow Traffic Analyzer | Enterprise flow monitoring | Multi-vendor flow analysis, bandwidth dashboards | Custom quote; 30-day trial | N/A |
| 3 | Tshark | CLI packet analysis | Terminal-based Wireshark-compatible capture | Free | N/A |
| 4 | Tcpdump | Lightweight packet capture | Fast CLI capture on Unix-like systems | Free | N/A |
| 5 | Tcpick | TCP stream tracking | TCP stream reconstruction from pcap | Free (GPL) | N/A |
| 6 | NGrep | Regex packet searching | Grep-style pattern matching on live traffic | Free | N/A |
| 7 | Elastic Packetbeat | Application-layer telemetry | Ships transaction data into the Elastic Stack | Free (open-source) | N/A |
| 8 | Network TAPs | Passive traffic access | Out-of-band, full-duplex packet copy | Hardware, quote required | N/A |
| 9 | SPAN Ports | Switch-based traffic mirroring | Built into most managed switches | Included with switch | N/A |
| 10 | Elasticsearch | Traffic data indexing | Distributed search for network telemetry | Usage-based; contact for pricing | N/A |
| 11 | Kibana | Traffic visualization | Dashboards and investigation views for Elasticsearch data | Starts at $99/month (Elastic Cloud) | 4.5/5 |
| 12 | VMware NSX | Virtual network visibility | Software-defined networking and microsegmentation | Contact sales | 4.4/5 |
| 13 | VMware vDefend Advanced Threat Prevention | Network threat detection | IDS/IPS, NTA, and NDR for VMware environments | Contact sales | 4.5/5 |
Best 13 network traffic analysis tools for 2026
These tools do different jobs. Choose based on the question you need traffic data to answer, not on brand recognition alone.
1. Wireshark
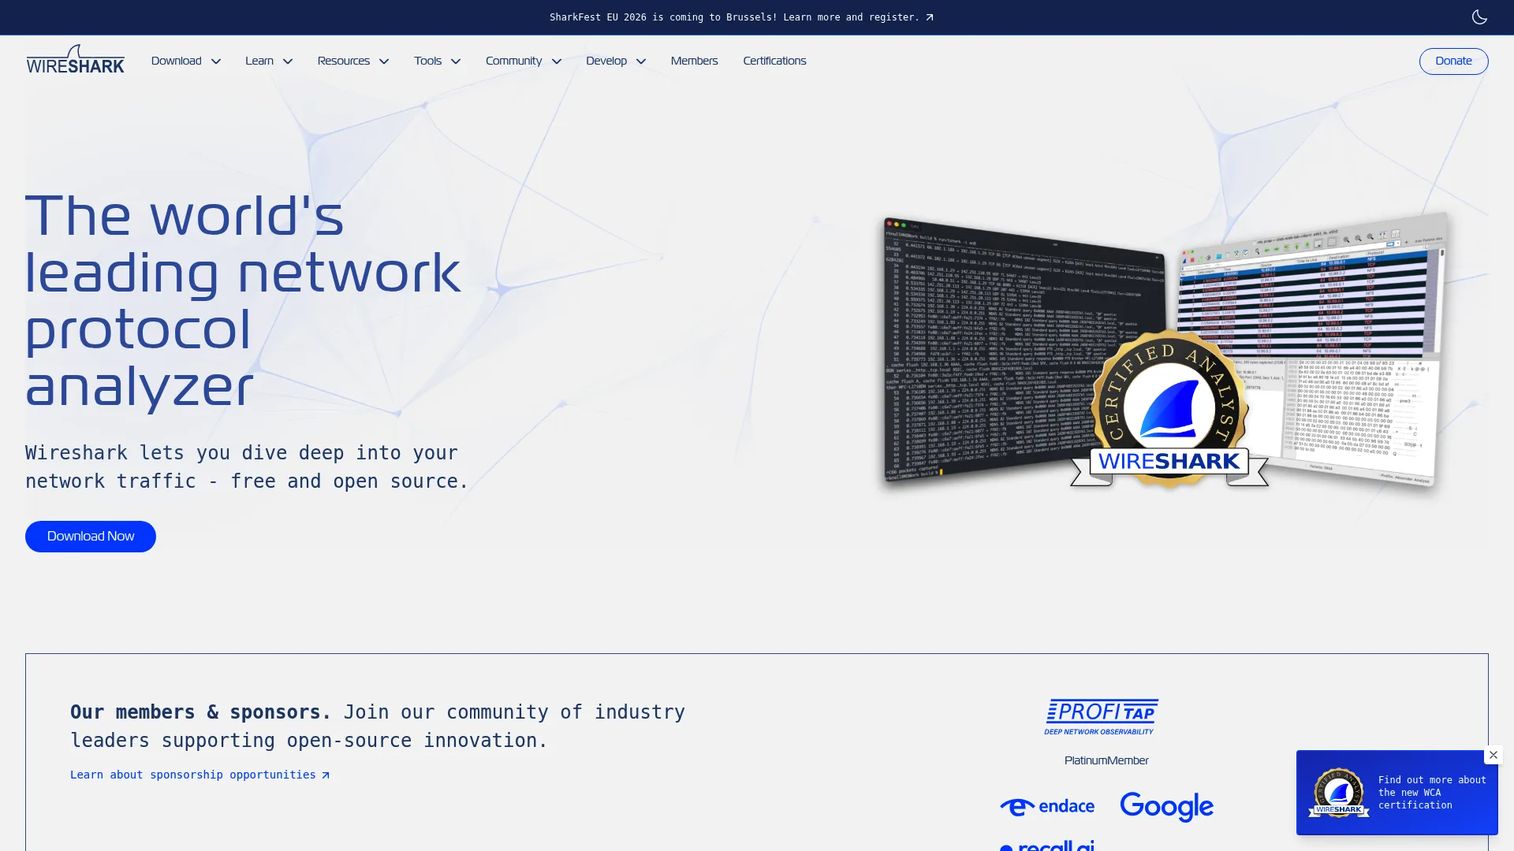
Wireshark is the reference tool for packet-level network analysis. Free, open-source, and available on Windows, macOS, and Linux, it captures live traffic and reads saved capture files with support for hundreds of protocols. Network engineers, security analysts, and developers have used it for decades to diagnose performance problems, investigate security incidents, and understand protocol behavior.
Best for: Network engineers and security analysts who need free, deep packet inspection with no licensing constraints.
Key features
- Deep inspection across hundreds of protocols
- Live capture and offline pcap file analysis
- Powerful display filter language for targeted investigation
- Packet coloring rules for visual pattern recognition
- Protocol decryption support for supported ciphers
Why choose Wireshark: Wireshark is unmatched for protocol-level depth and community maturity. If your question is "what exactly happened in that TCP session," Wireshark gives you the answer. It is not a flow dashboard and does not replace long-term bandwidth reporting, so pair it with a flow tool for larger environments.
Wireshark pricing: Wireshark is free software distributed under the GNU General Public License version 2. There is no license fee.
G2 rating: 4.7/5
2. SolarWinds NetFlow Traffic Analyzer
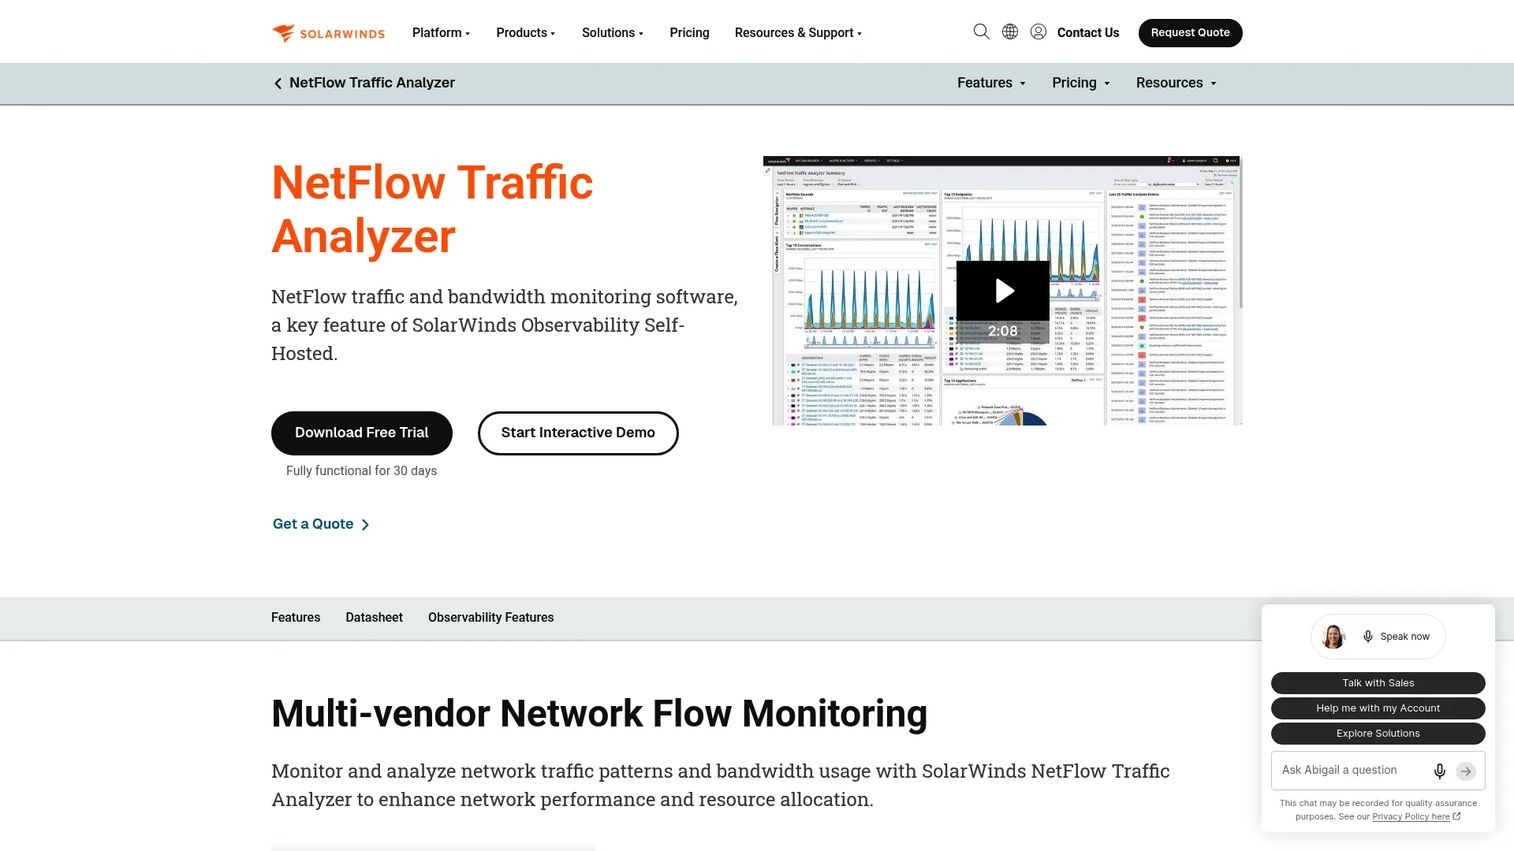
SolarWinds NetFlow Traffic Analyzer is a commercial flow-based traffic monitoring platform for bandwidth visibility and congestion troubleshooting. It collects flow data from network devices using NetFlow, sFlow, J-Flow, IPFIX, and several other flow protocols, then presents that data through dashboards, top-talker views, custom reports, and threshold-based alerts. IT operations teams use it to identify bandwidth-heavy applications, plan capacity, and document historical usage trends.
Best for: IT operations teams that need multi-vendor flow monitoring and enterprise-grade bandwidth visibility across a managed network.
Key features
- Multi-vendor flow collection: NetFlow, sFlow, J-Flow, IPFIX, and more
- Top-talker analysis by application, protocol, endpoint, and IP group
- Custom traffic dashboards and scheduled report delivery
- Threshold alerts for congestion and usage spikes
- Historical traffic data for capacity planning
Why choose SolarWinds NetFlow Traffic Analyzer: The tool fits teams that need ongoing bandwidth visibility at scale, not one-time packet forensics. Packet-level investigation still belongs to a dedicated capture tool. SolarWinds gives you the summary layer; Wireshark or Tshark gives you the detail when a specific session needs examination. These layers are complementary, not redundant. Presales teams supporting application security testing or infrastructure evaluations will find its traffic-mapping reports useful for buyer validation conversations.
SolarWinds NetFlow Traffic Analyzer pricing: Pricing runs through sales and requires a custom quote. A fully functional 30-day trial is available on the product page.
3. Tshark
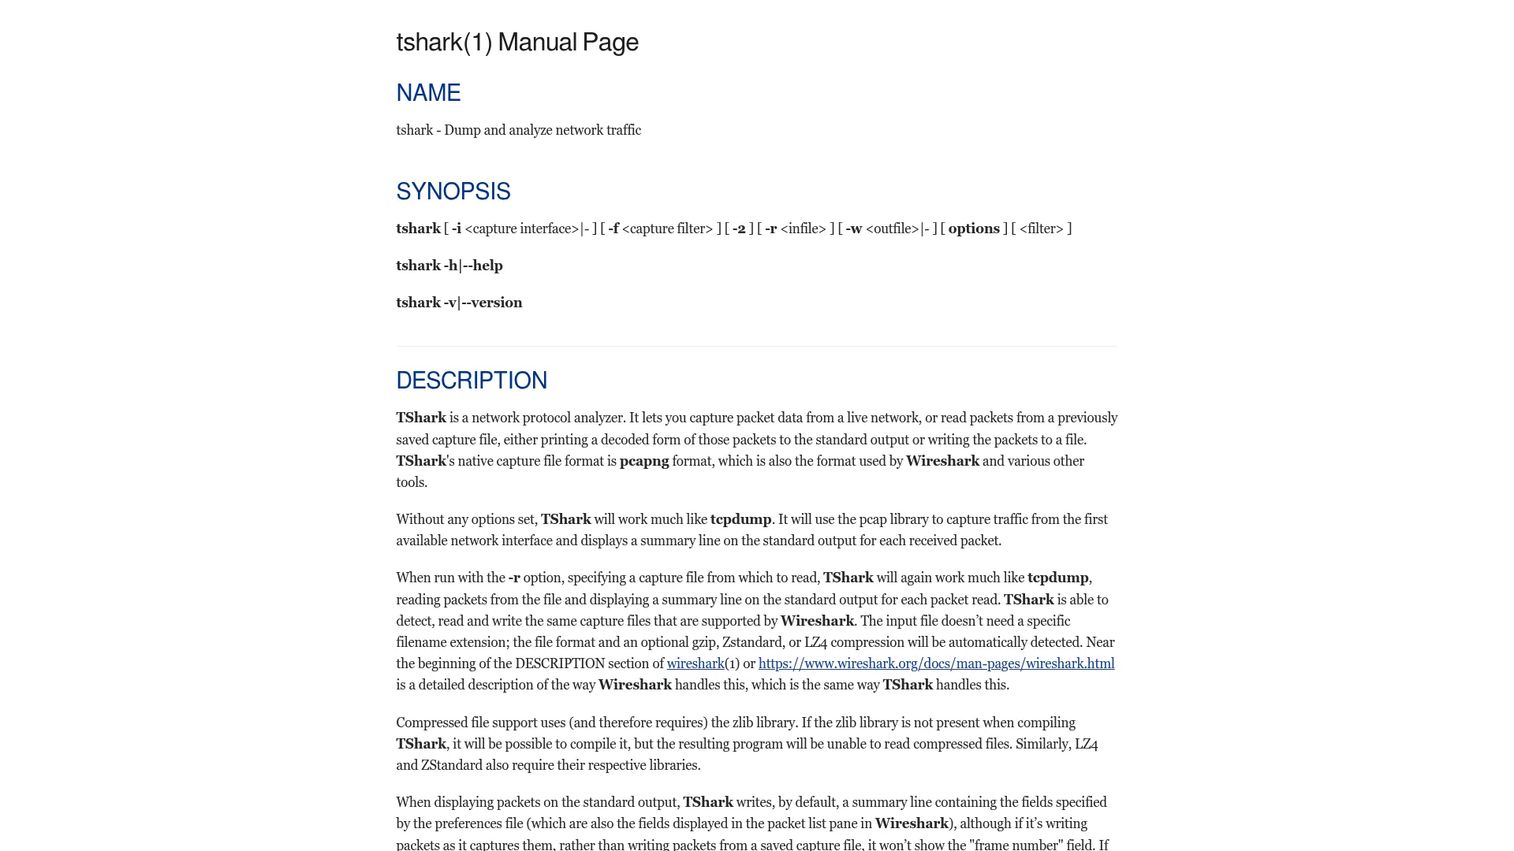
Tshark is Wireshark's terminal-based network protocol analyzer. Part of the Wireshark project, it captures and analyzes traffic from the command line without requiring a graphical interface. Engineers use it on remote servers, in automated scripts, and in headless environments where a GUI is impractical. Tshark reads and writes the same pcap and pcapng formats Wireshark uses, so captures transfer between the two without conversion.
Best for: Engineers who need Wireshark-grade protocol analysis in terminal sessions, automation pipelines, or remote server environments.
Key features
- Live network capture from the command line
- Full protocol decoding matching Wireshark's dissector library
- Scriptable output for automated analysis workflows
- Capture file reading and writing in pcap/pcapng formats
- Display filter support for targeted field extraction
Why choose Tshark: Tshark fits teams that are comfortable in the CLI and need packet analysis baked into scripts or CI/CD pipelines. It covers the same protocol depth as Wireshark without the GUI overhead. Teams using API monitoring tools alongside traffic analysis will find Tshark useful for correlating application-layer calls with raw network behavior.
Tshark pricing: Free, distributed as part of the Wireshark project under the same open-source license.
4. Tcpdump
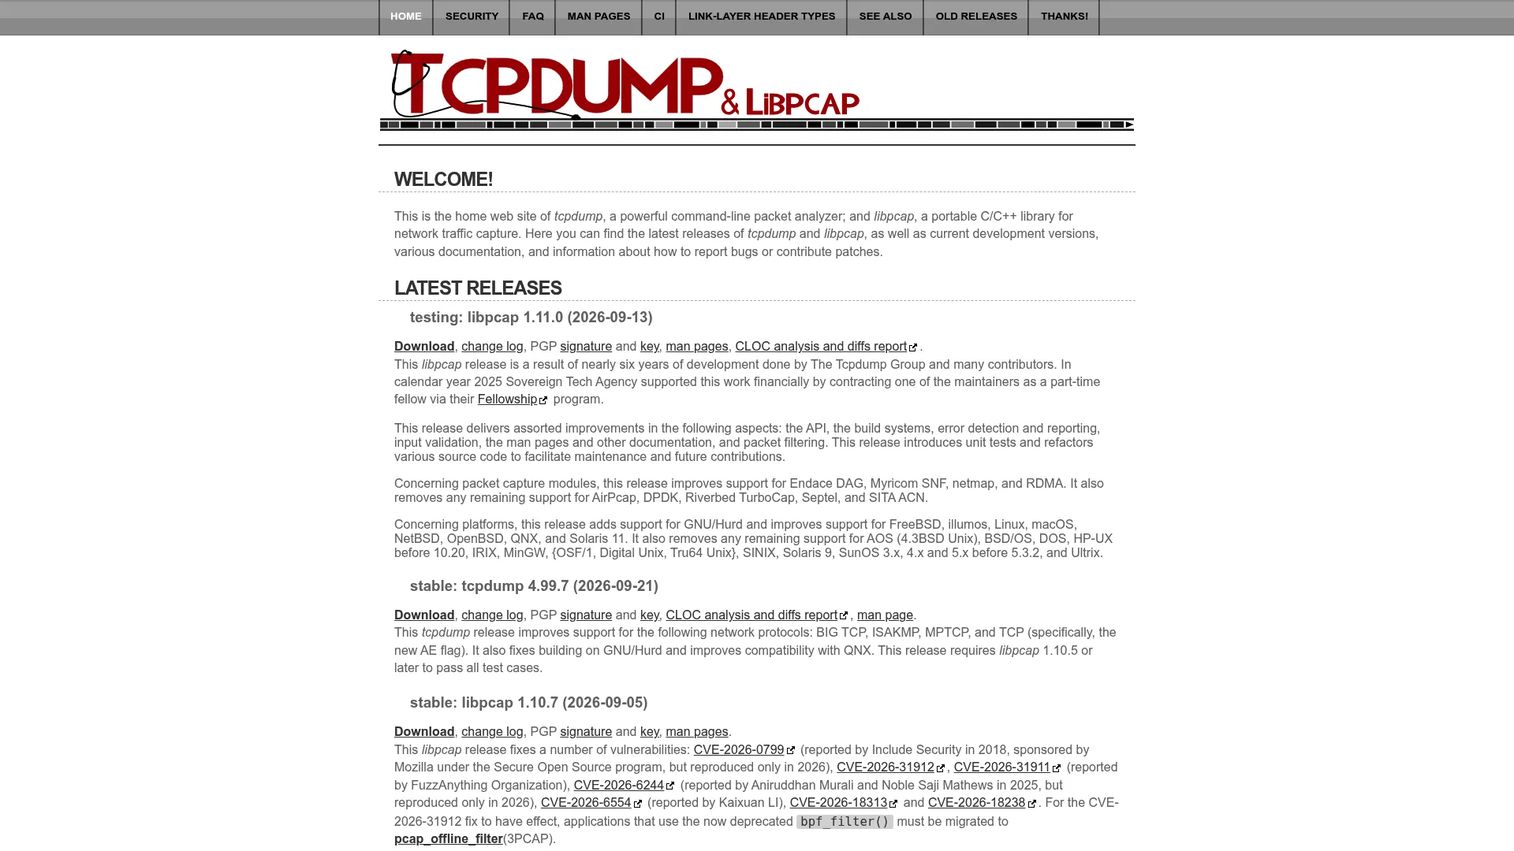
Tcpdump is the classic command-line packet capture utility available on virtually every Unix-like operating system. It captures packets on a network interface, applies Berkeley Packet Filter expressions to narrow the capture, and prints packet summaries to the terminal or writes them to a pcap file for later analysis. Many engineers reach for it first during remote diagnostics because it is almost always present without additional installation.
Best for: Fast packet capture on servers, appliances, and remote systems where speed and availability matter more than a full analysis environment.
Key features
- Packet capture on any available network interface
- BPF filter expressions for precise traffic selection
- pcap output compatible with Wireshark and Tshark
- Lightweight footprint with no GUI dependency
- Widely available on Linux, macOS, BSD, and embedded systems
Why choose Tcpdump: Tcpdump excels at rapid evidence collection. You run it, grab the pcap, and carry the file to Wireshark for detailed inspection. For presales teams demonstrating observability or bot detection product capabilities, Tcpdump output serves as credible raw evidence during technical validation sessions.
Tcpdump pricing: Free and open-source under the BSD license.
5. Tcpick
Tcpick is a text-mode, libpcap-based TCP stream sniffer focused on tracking and reconstructing TCP connections from captured traffic. Where Wireshark and Tcpdump capture everything, Tcpick narrows attention to TCP stream content, printing sessions in hexdump, printable-character, or raw mode. It reads live interfaces or existing pcap files.
Best for: Analysts who need TCP stream reconstruction during targeted packet investigations without loading a full protocol analyzer.
Key features
- TCP connection tracking across a capture session
- Stream reconstruction in hex, printable text, or raw formats
- pcap file reading for offline analysis
- Lightweight CLI workflow with no GUI required
- Output saved to separate per-connection files
Why choose Tcpick: Tcpick is a specialist tool. Use it when you need to follow a specific TCP session end to end and extract content, alongside a broader capture tool like Tcpdump. It handles the extraction step so you do not have to dig through raw hex manually.
Tcpick pricing: Free software distributed under the GNU General Public License.
6. NGrep
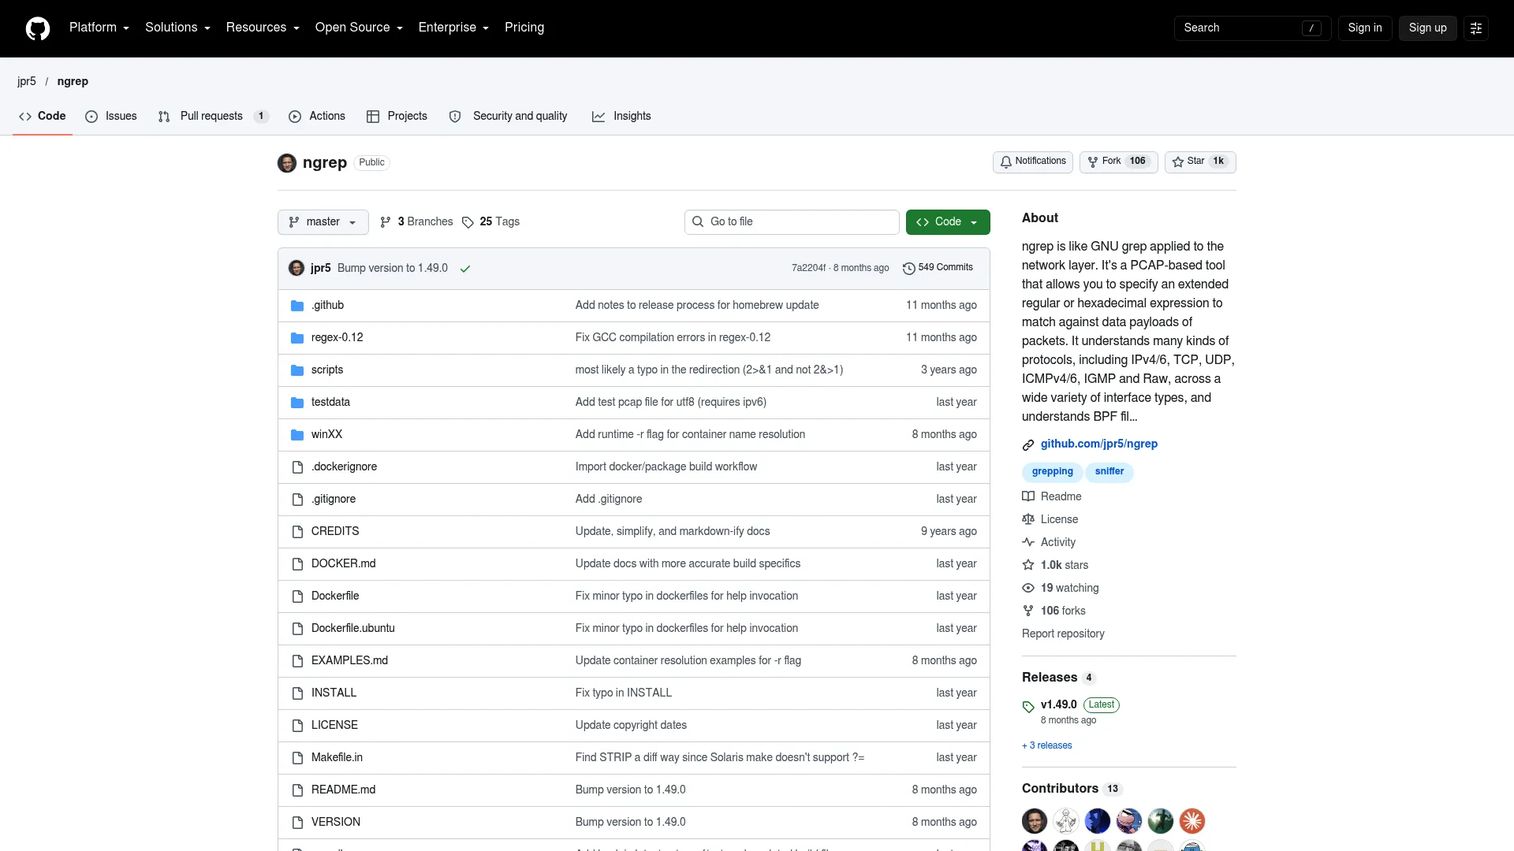
NGrep applies grep-like pattern matching to network traffic. It accepts extended regular expressions and hexadecimal patterns and matches them against packet payloads in real time or from pcap files. Engineers use it for quick protocol checks, payload searches, and rapid identification of specific strings or patterns moving across the wire. BPF filter support means you can narrow the scope before the regex runs.
Best for: Engineers who need to search packet streams for specific payload content or patterns quickly, without loading a full packet analyzer.
Key features
- Extended regular expression matching against packet payloads
- Hexadecimal payload matching for binary protocols
- BPF filter support for scope control before matching
- Reads from live interfaces and pcap dump files
- Supports TCP, UDP, ICMP, and IPv4/IPv6 traffic
Why choose NGrep: NGrep is fast and targeted. When you know what you are looking for and need to find it quickly, NGrep cuts search time compared to loading a full pcap into Wireshark. Its scope is narrow by design: It is not a dashboard, not a flow platform, and it cannot see inside encrypted payloads. Use it for plaintext protocol investigation and incident scoping.
NGrep pricing: Open-source; verify current license terms at the project repository before deployment.
7. Elastic Packetbeat
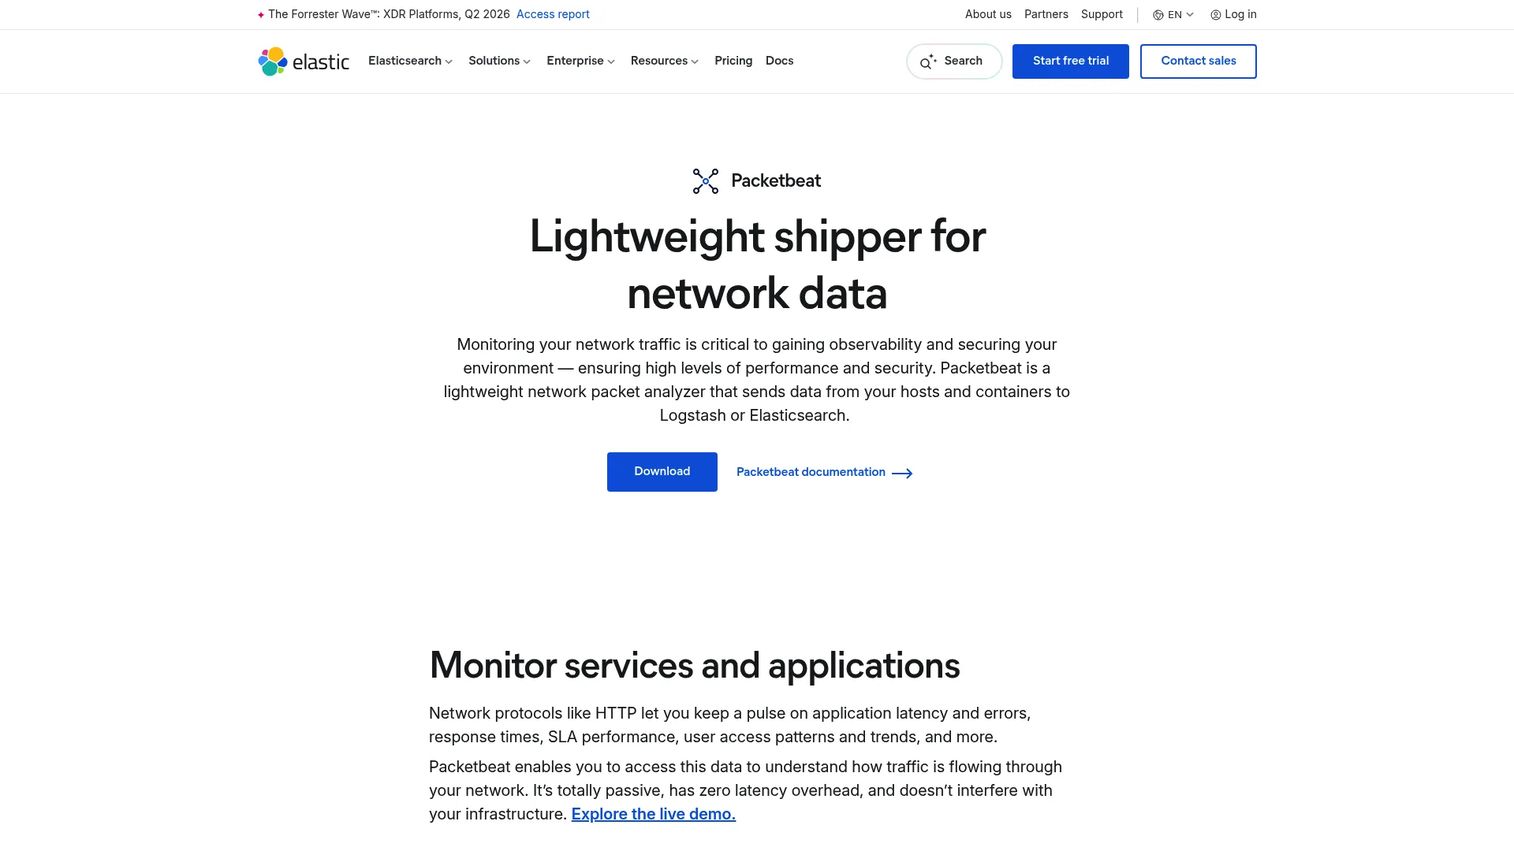
Elastic Packetbeat is a lightweight network packet analyzer that passively monitors traffic and ships application-layer transaction data to Elasticsearch or Logstash. Instead of storing raw packets, Packetbeat decodes protocols such as HTTP, DNS, MySQL, Redis, and others at the transaction level, recording request/response pairs, latency, status codes, and error rates. Teams already running the Elastic Stack use it to add network-layer context to their observability and security workflows.
Best for: Teams using the Elastic Stack who want application-layer network visibility without storing full pcap data.
Key features
- Passive capture with no latency added to production traffic
- Application-layer protocol decoding: HTTP, DNS, MySQL, Redis, and others
- Transaction-level data shipped to Elasticsearch or Logstash
- Elastic Common Schema output for consistent field naming
- Local disk spooling during downstream outages to prevent data loss
Why choose Elastic Packetbeat: Packetbeat fits environments where the Elastic Stack is already the central observability platform. It bridges the gap between network behavior and application performance without requiring separate packet storage infrastructure. Presales teams selling observability platforms will recognize its relevance to business activity monitoring conversations, where buyers want to connect network events to service-level outcomes.
Elastic Packetbeat pricing: Packetbeat itself is open and free to use. Deploying it into an Elastic Cloud environment runs on usage-based pricing; the Elastic Cloud hosted plans start at $99 per month for a Standard configuration.
8. Network TAPs

A network TAP (test access point) is a hardware device that sits inline on a network link and passes a full-duplex copy of all traffic to one or more monitoring tools, without interrupting the live network path. TAPs are the preferred traffic access method for serious packet capture and monitoring deployments because they copy every frame regardless of load, unlike switch mirroring which can drop packets under congestion.
Garland Technology, one of the reference vendors in this category, offers copper, fiber, and virtual TAP configurations across a range of port speeds and deployment scenarios.
Best for: Network and security teams that need reliable, unfiltered packet access for continuous monitoring, forensic capture, or tool-feeding in production environments.
Key features
- Full-duplex passive traffic copy with no packet loss under load
- Copper, fiber, SFP/SFP+, and virtual TAP form factors
- Aggregation, regeneration, bypass, and filtering modes
- Out-of-band visibility: Monitoring tools sit off the live path
- No active network equipment that could introduce latency or failure
Why choose Network TAPs: TAPs give you guaranteed packet visibility. SPAN ports are convenient but can drop traffic under load and do not always capture all frame types. When the investigation demands complete evidence, a TAP is the right access method. Hardware planning and physical placement are required, which makes TAPs a deliberate infrastructure decision rather than a quick fix.
Network TAPs pricing: Hardware costs vary by vendor, port speed, media type (fiber versus copper), and redundancy requirements. Garland Technology states it does not charge license or port fees; contact the vendor for a hardware quote.
9. SPAN Ports
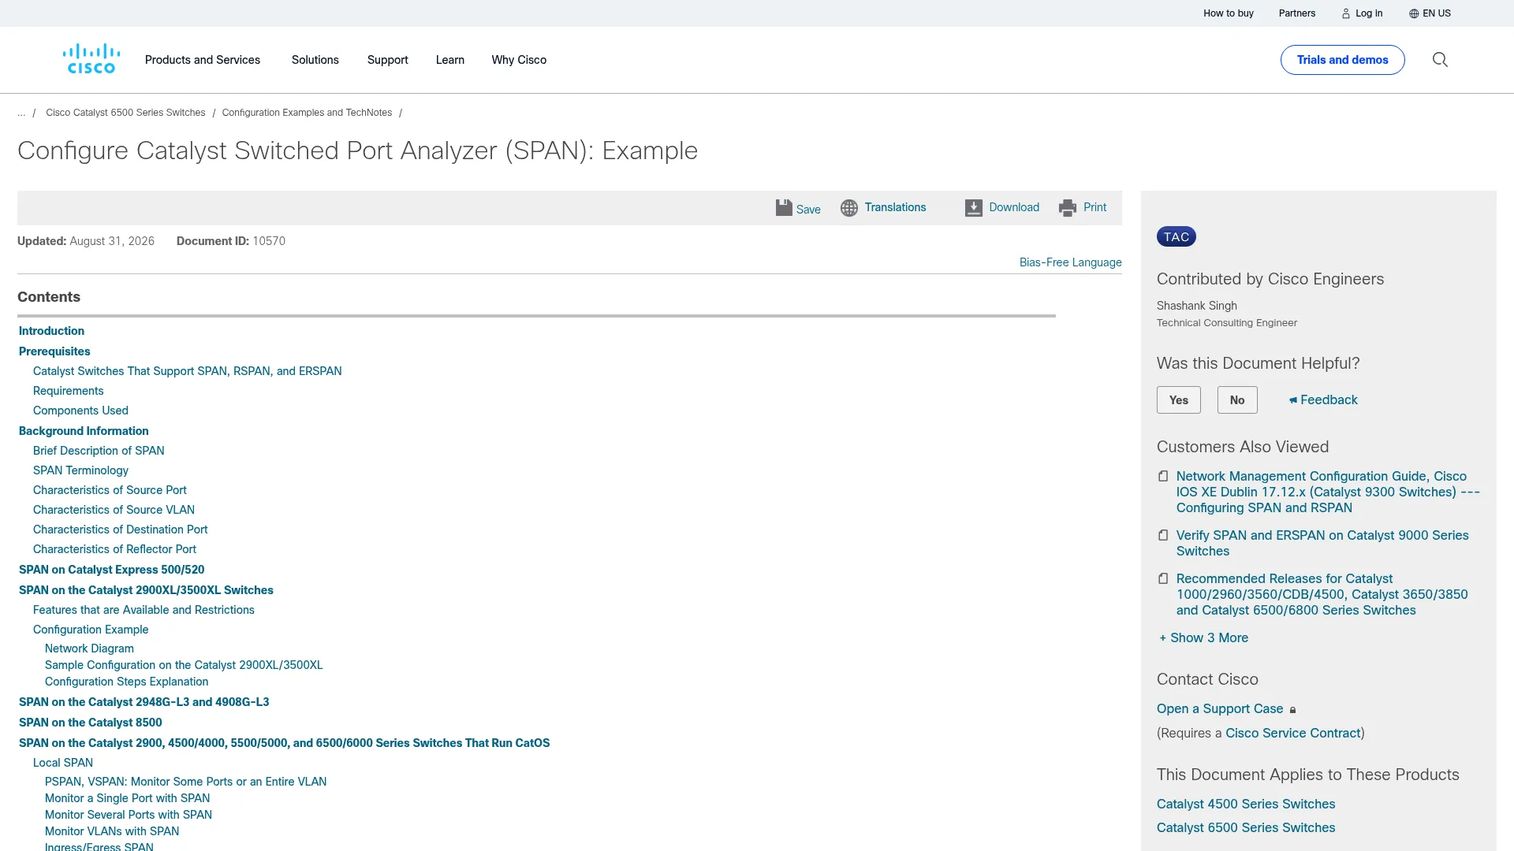
A SPAN port (Switched Port Analyzer) is a switch-based feature that mirrors traffic from selected source ports or VLANs to a designated monitoring port. Most managed switches support local SPAN and many support Remote SPAN (RSPAN) to send mirrored traffic across the network to a centralized monitoring system. SPAN is the most accessible form of traffic access because it requires no additional hardware.
Best for: Network teams that need quick mirrored traffic access using existing switch capabilities for testing, monitoring, or short-term investigation.
Key features
- Local SPAN for single-switch mirroring to a monitoring port
- Remote SPAN (RSPAN) for cross-switch traffic delivery
- Source selection by port, VLAN, or ingress/egress direction
- Multiple simultaneous SPAN sessions on supported switches
- No additional capture hardware needed
Why choose SPAN Ports: SPAN is the fastest way to feed traffic to an analyzer when you already have a managed switch. The trade-off is fidelity: SPAN traffic can be dropped when the switch is under load, and some frame types may not be mirrored. For short-term troubleshooting or testing environments, SPAN works well. For continuous high-fidelity monitoring, a dedicated TAP handles the job more reliably.
SPAN Ports pricing: Built into the switch operating system on most managed switches. Some vendors charge for advanced mirroring licenses on specific platforms; check your switch vendor's documentation.
10. Elasticsearch

Elasticsearch is a distributed, RESTful search and analytics engine used to store, index, and query large volumes of structured and unstructured data. In network traffic workflows, it typically sits downstream of tools like Packetbeat, receiving transaction records, log events, and telemetry, then making that data searchable and available for dashboards in Kibana. Elasticsearch is not a packet capture tool.
Best for: Teams that need scalable, searchable storage for high-volume network telemetry, logs, and security events across an observability pipeline.
Key features
- Full-text and structured field search across large datasets
- Time-series indexing for event-driven telemetry
- Distributed clustering for horizontal scaling and high availability
- REST APIs and Query DSL for programmatic access
- Machine learning and anomaly detection capabilities
- Role-based access control at the field and document level
Why choose Elasticsearch: Elasticsearch makes traffic telemetry searchable at a scale that packet files cannot match. Once Packetbeat or a similar shipper feeds data in, security and operations teams can investigate incidents, build correlation rules, and run historical queries without loading pcap files manually. It works best as part of a broader observability or AI security posture management pipeline rather than as a standalone tool.
Elasticsearch pricing: Available as Serverless (usage-based, pay-as-you-go), Hosted on Elastic Cloud (resource-based, usage pricing), or self-managed. The official pricing page does not display fixed numeric tiers; contact Elastic for a quote that matches your deployment size.
11. Kibana
Kibana is the visualization and investigation layer for data stored in Elasticsearch. Teams use it to build dashboards for network traffic patterns, create alerting views for anomaly detection, explore security telemetry, and run ad hoc queries across indexed data. Kibana does not capture packets; it displays what Elasticsearch holds.
Best for: Teams that need dashboards and visual investigations on top of Elasticsearch-indexed network and security telemetry.
Key features
- Interactive dashboards with Lens, Charts, and Maps visualizations
- Data exploration with Discover for ad hoc investigation
- Alerting and notification views based on indexed data
- Machine learning integration for anomaly detection and forecasting
- Role-based access control and SSO support
Why choose Kibana: Kibana is the natural visualization layer when the stack already includes Packetbeat and Elasticsearch. It lets security analysts explore traffic patterns without writing raw queries, and it lets operations teams build persistent dashboards for ongoing monitoring. Kibana depends entirely on data in Elasticsearch; without that source, it has nothing to display.
Kibana pricing: Included in Elastic's self-managed Free and open offering. On Elastic Cloud Hosted, the Standard plan starts at $99 per month, with Gold at $114, Platinum at $131, and Enterprise at $184 per month. All figures are usage-based starting points.
G2 rating: 4.5/5
12. VMware NSX
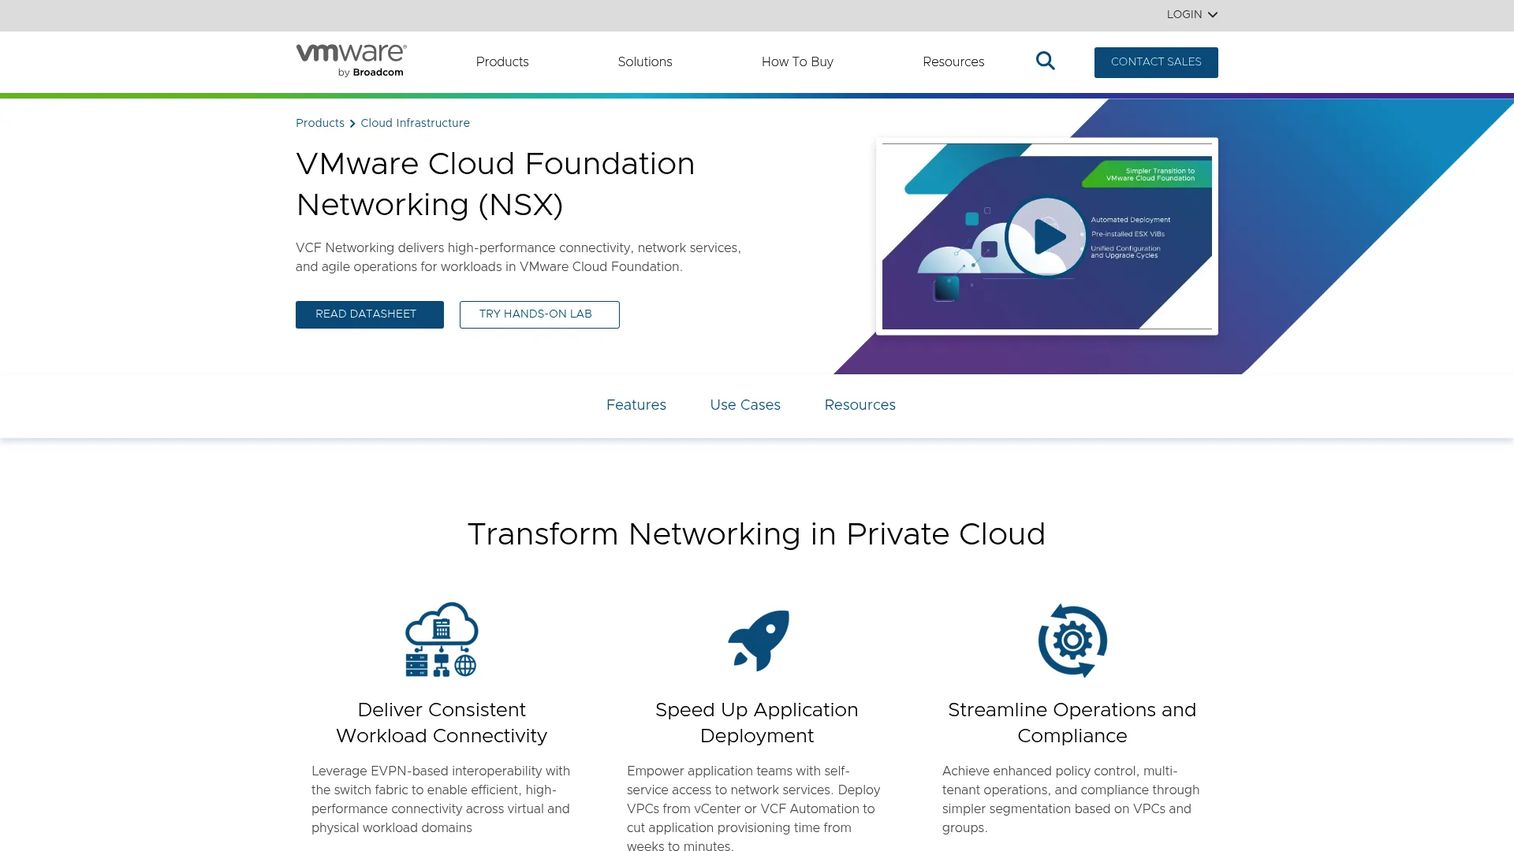
VMware NSX is a software-defined networking and security platform for VMware Cloud Foundation environments. It provides logical switching and routing, distributed firewalling, microsegmentation, and centralized policy management across private and hybrid cloud infrastructure. Network visibility in NSX is workload-aware: The platform understands which virtual machine is generating which traffic, giving security teams context that a traditional packet capture cannot provide.
Best for: Large enterprises running VMware Cloud Foundation that need software-defined network visibility, workload-level security controls, and microsegmentation at scale.
Key features
- Logical switching, routing, and VPN within virtualized environments
- Distributed firewall and microsegmentation by workload identity
- Multi-cloud networking and centralized policy management
- Network monitoring and observability across virtual infrastructure
- Integration with VMware Cloud Foundation management
Why choose VMware NSX: NSX fits environments where the network and the workloads are both virtualized and managed by VMware. Traditional packet capture tools do not see workload identity; NSX does. It is a platform-level infrastructure decision, not a lightweight analyzer for quick troubleshooting. Presales teams selling into enterprises with VMware-centric data centers will encounter NSX visibility as a validation requirement during proof-of-concept stages.
VMware NSX pricing: Pricing runs through Broadcom's sales team and requires a quote. No numeric pricing is posted on the product page.
G2 rating: 4.4/5
13. VMware vDefend Advanced Threat Prevention
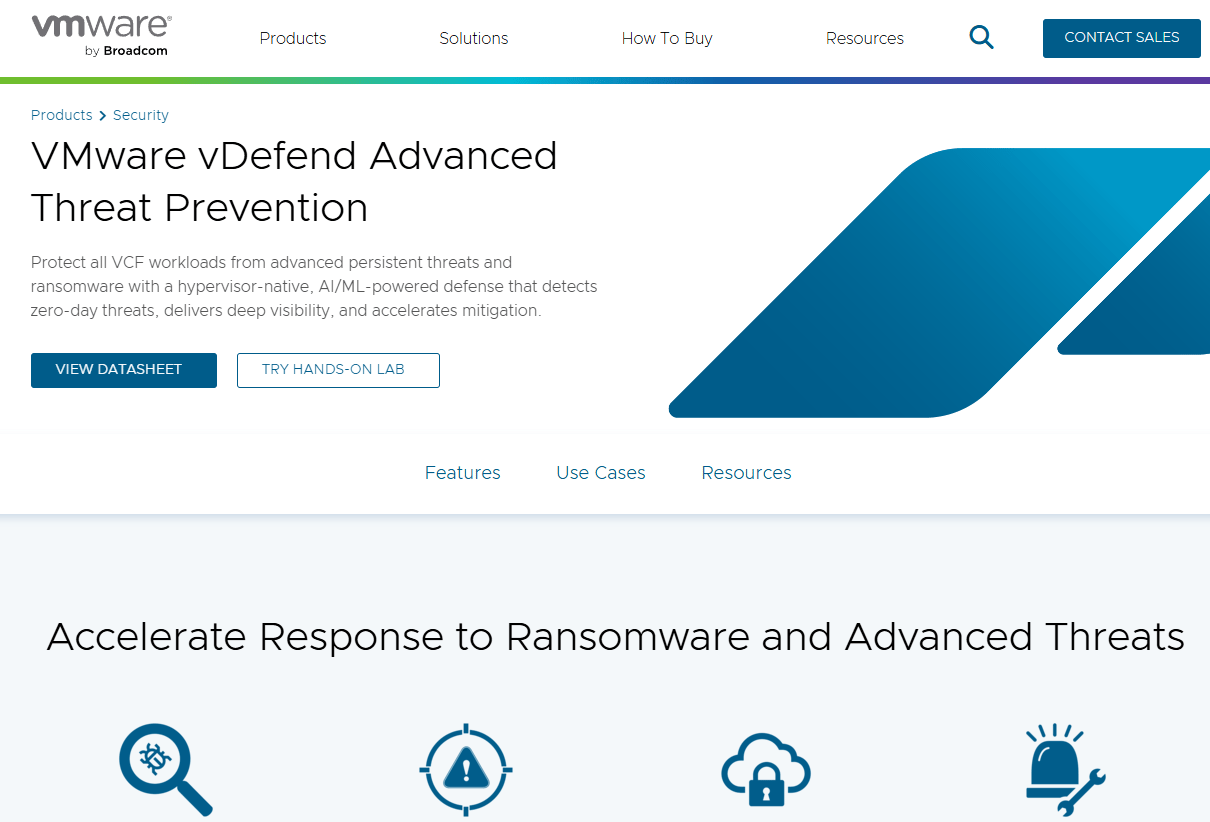
VMware vDefend Advanced Threat Prevention is a VMware Cloud Foundation security product focused on detecting and preventing ransomware, zero-day malware, and lateral attack traffic within virtualized environments. Its capabilities include distributed IDS/IPS with Turbo-mode inspection, VM-aware malware detection using static and dynamic analysis, network traffic analysis for behavior-based anomaly detection, and network detection and response with MITRE ATT&CK-mapped context.
Best for: Security operations teams in VMware Cloud Foundation environments that need workload-level threat detection, lateral movement prevention, and correlated attack investigation.
Key features
- Distributed IDS/IPS with custom signature support and Turbo-mode throughput
- VM-aware malware detection using machine learning, static, and dynamic analysis
- Network traffic analysis (NTA) for behavior-based anomaly detection
- Network detection and response (NDR) with MITRE ATT&CK context mapping
- GenAI-powered investigation assistance for threat response
Why choose VMware vDefend Advanced Threat Prevention: This tool belongs to security operations teams, not general network troubleshooting workflows. If the environment runs VMware Cloud Foundation and the threat model includes ransomware and lateral movement, vDefend provides security-specific traffic analysis that generic packet capture tools do not. For bandwidth or performance troubleshooting, lighter packet or flow tools are the faster path.
VMware vDefend Advanced Threat Prevention pricing: Pricing runs through Broadcom's sales team and requires a quote. The product page does not display numeric tiers.
G2 rating: 4.5/5
Considerations when choosing network traffic analysis tools
Start with the traffic question
"Analyze traffic" covers too much ground to pick a tool. Name the specific question first. Do you need packet-level evidence for a support escalation, bandwidth trends for a capacity review, application-layer transaction data for an observability pipeline, or threat context for a security incident? Each question points to a different tool type, and buying the wrong layer means rebuilding later.
Match packet capture and flow analysis to the job
Packet capture gives depth; flow analysis gives scale. A single Tcpdump session shows you exactly what happened in a TCP connection. NetFlow data from the same period tells you which host generated the most traffic across the entire network. Most mature teams run both. If budget forces a choice, start with flow analysis for ongoing operations and add packet capture for incident response.
Plan how you will access the traffic first
The best analyzer in the world fails if it cannot see the right traffic. TAPs provide reliable out-of-band access for production monitoring. SPAN ports work for testing and short-term investigation but can drop packets under load. Cloud environments use virtual TAPs, VPC flow logs, or cloud-native mirroring. Agents like Packetbeat run on the host and capture locally. Decide the access method before selecting the analysis tool, not after.
Check storage, retention, and search requirements
Traffic data grows fast. Raw packet captures from a 1Gbps link fill storage quickly. Flow records are smaller but still accumulate. Indexed transaction data in Elasticsearch scales horizontally but requires infrastructure planning. Decide what needs full packet retention, what can be summarized as flows, and what needs searchable indexing for security investigations. Storage cost often shapes the architecture more than tool preference does.
Validate integration and team skill fit
A tool that requires deep CLI expertise will not be adopted by a team that works primarily in dashboards. Similarly, a commercial platform with a polished GUI adds no value if the team's workflow is script-driven. Check integration with your SIEM, observability stack, and ticketing system. Verify that encrypted traffic handling, compliance requirements, and deployment permissions are addressed before committing to a deployment model.
Conclusion
Choose Wireshark when you need free, deep packet inspection and you can read a protocol dissection. Choose Tcpdump or Tshark when you need packet capture from the command line, on a server that lacks a GUI, or inside an automation script. Choose SolarWinds NetFlow Traffic Analyzer when the question is bandwidth usage, top talkers, or capacity trends across an enterprise network.
For Elastic-native environments, Packetbeat feeds transaction-level data to Elasticsearch, and Kibana turns it into dashboards. For production environments where traffic access itself is the first problem, a network TAP provides reliable out-of-band visibility; a SPAN port handles quick access when a TAP is not practical. For VMware Cloud Foundation deployments, NSX provides workload-aware network visibility, and vDefend Advanced Threat Prevention adds security-focused traffic inspection for ransomware and lateral movement detection.
Start by naming the question you need traffic data to answer. Then pick the tool type that gives you the right level of evidence. The category is wide, but the decision becomes straightforward once the question is specific.
FAQs
Network traffic analysis tools capture, summarize, and interpret data moving across a network to support troubleshooting, security investigation, and capacity planning. The category spans packet analyzers that record raw frames, flow collectors that summarize conversations at scale, and security platforms that flag anomalous behavior. The right tool depends on whether you need packet-level detail or traffic-pattern summaries.
Packet capture records every byte of every frame, giving you full protocol detail, payload content, and timing. Flow analysis records metadata about conversations: Who talked to whom, on which port, for how long, and how many bytes moved. Packet capture answers "what exactly happened in that session." Flow analysis answers "who talked to whom and how much, across the whole network."
Wireshark is excellent for packet-level inspection and protocol forensics. It does not replace flow dashboards, long-term bandwidth reporting, or enterprise alerting. For larger environments, pair Wireshark with a flow monitoring platform to handle ongoing visibility and use Wireshark for targeted investigation when a specific session needs examination.
Wireshark is the strongest free GUI packet analyzer for detailed protocol inspection. Tcpdump and Tshark are the primary free command-line options. Tcpdump is faster for quick capture on remote systems; Tshark adds Wireshark's full protocol library in terminal form. The right choice depends on whether you need a visual interface, remote capture, or scriptable output.
Use NetFlow or similar flow data when you need bandwidth trends, top-talker identification, application traffic summaries, or long-term usage reporting. Use packet capture when you need payload content, retransmission details, or protocol-level evidence for a specific session. Privacy concerns and storage costs often tip decisions toward flow analysis for operational monitoring, reserving packet capture for incident investigation.
A network TAP is a dedicated hardware device that passively copies all traffic on a link to monitoring tools without touching the live path. A SPAN port is a switch software feature that mirrors selected ports or VLANs to a monitoring port. TAPs capture every packet regardless of switch load; SPAN ports can drop mirrored traffic under congestion. For continuous, high-fidelity monitoring, TAPs are more reliable. For quick access in test environments, SPAN is faster to configure.
Traffic analysis tools can surface suspicious behavior including anomalous connection patterns, unexpected destinations, lateral movement indicators, and policy violations. Detection quality depends on visibility scope, baselining, defined rules, and integration with security workflows. Traffic analysis does not replace endpoint security, identity controls, or SIEM platforms; it provides the network-layer evidence that complements those controls. Products like VMware vDefend Advanced Threat Prevention specifically combine traffic analysis with threat detection logic for workload-level security.
Start with the operational question you need to answer. If you need packet-level detail for troubleshooting or forensics, pick a packet capture tool. If you need bandwidth summaries and traffic trends, pick a flow analysis platform. If traffic access is the bottleneck, address that with a TAP or SPAN port first. Then evaluate deployment model, storage requirements, team skill level, and integration with your existing change data capture or observability infrastructure before committing to a specific product.