A request slows down. A customer complains. You open your logs and start reading.
The request touched five services and three teams. The API gateway looks fine. The auth service looks fine. The database looks fine. Each log line tells you what happened inside one service, but none of them tells you where the 900 milliseconds went. You are grepping timestamps across services, trying to reconstruct a single request from scattered evidence. Two hours later you find it: a retry loop in a downstream call that nobody owns.
This is the exact gap distributed tracing software closes. Logs answer "what happened here." Metrics answer "how much, how often." Tracing answers the question that actually matters when a request fans out across a distributed system: where did the time go, and which service caused it? A trace stitches together every hop of a single request into one timeline, so root cause analysis stops being archaeology.
The market reflects how central this has become. IT observability platforms hit roughly USD 3.36B in 2026 and are growing at a 15.58% CAGR through 2031, per Mordor Intelligence (2026). The distributed tracing tool segment alone is projected to exceed USD 2.5B by 2032, per Dataintelo (2025). More teams are instrumenting more services, and the tooling is consolidating around open standards like OpenTelemetry.
If you have spent time evaluating observability vendors, you already know the concept. What you need is a clean comparison of the tools that actually deliver on trace depth, instrumentation effort, and workflow fit. Teams comparing platforms often build the same evaluation muscle they use for analytics platforms that drive ROI and agentic analytics software, where data quality and integration depth decide the winner.
What's inside
This guide is for engineering and presales teams evaluating distributed tracing software for microservices and distributed systems. It is a buyer's comparison, not a concept explainer, though you will find enough definition to judge fit.
We built the shortlist around five criteria that matter in real evaluations: tracing depth and trace analytics quality, OpenTelemetry support, visualization quality (flame graphs, service maps), ease of instrumentation, and enterprise readiness. Pricing and G2 ratings reflect verified vendor and G2 sources at publication. Each tool section notes who it fits best and what to watch during a proof of concept.
TL;DR
- Best overall observability platform for large-scale tracing: Datadog, for teams that want traces tied to logs, metrics, dashboards, and alerts in one place.
- Best for high-cardinality debugging and fast investigation: Honeycomb, for engineering teams that want to ask questions and dig into trace data quickly.
- Best for teams already invested in cloud observability: New Relic, for full-stack telemetry across apps, infra, logs, and traces.
- Best for open, dashboard-heavy workflows: Grafana Cloud, for teams standardized on Grafana and open standards.
- Best for enterprises needing broad platform coverage: Dynatrace, for complex environments wanting AI-assisted root cause analysis.
- Best for frontend-to-backend error correlation: Sentry, for developer teams connecting app errors to backend requests.
Teams that lean on marketing analytics software or a customer data platform will recognize the pattern: the right tool is the one that fits your existing stack, not the one with the longest feature list.
What is distributed tracing software?
Distributed tracing software records the full path of a single request as it moves service to service across a distributed system, capturing each step as a span, linking spans together with a shared trace ID, and visualizing the whole journey as one end-to-end timeline.
Here is what that gives you in practice:
- What tracing shows: the complete lifecycle of one request, including which services it touched, how long each hop took, and where errors or latency occurred.
- How it differs from logs: logs are discrete events inside one service. A trace connects events across services into a single causal chain, so you see the request, not just the fragments.
- How it differs from metrics: metrics aggregate behavior (p95 latency, error rate) but cannot tell you why a specific slow request was slow. A trace can.
- Why it matters for microservices: in a monolith, a stack trace is enough. In microservices, one user action triggers dozens of internal calls. Request tracing is the only way to follow that action across process boundaries.
The mechanics are straightforward. Each unit of work is a span. Spans carry a trace ID so they can be grouped, and context propagation passes that trace ID across service boundaries (usually via HTTP headers). Sampling decides which traces you keep, since storing every trace at scale gets expensive. Most modern distributed tracing tools now standardize on OpenTelemetry for instrumentation, which decouples how you collect data from where you send it.
When to use distributed tracing
Debugging cross-service latency
Tracing earns its keep the moment a request slows down somewhere between the edge and your downstream services. Instead of guessing which of ten services added the delay, you open the trace and read the flame graph. The longest span is your suspect. This is the single most common reason teams adopt end-to-end tracing, and it is where the time savings show up first.
Finding root cause in complex user journeys
When a checkout fails or a page hangs, the failure often lives several calls deep. Tracing lets you isolate exactly which service, dependency, or call path broke. You follow the trace ID from the user's request down to the failing span, see the error attached to it, and skip the cross-team guessing game. Root cause analysis goes from hours to minutes.
Evaluating observability maturity
If your team still debugs production with logs alone, adding trace context tied to metrics and alerts is the natural next step. Tracing connects your telemetry: an alert fires, you jump to the trace, you see the log lines attached to the exact span. This is the shift from monitoring to observability, and it is usually triggered when microservices debugging with logs alone stops scaling.
Comparison table
The table below sorts the seven tools by relevance to distributed tracing software buyers. Pricing reflects entry tiers or lowest public rates; usage-based models vary with volume, so validate against current volume during a proof of concept. G2 ratings are from each product's live G2 listing.
| # | Product | Intent | Key use case | Pricing | G2 rating |
|---|---|---|---|---|---|
| 1 | Datadog | Unified observability at scale | Traces tied to logs, metrics, and alerts | From $15/host/mo (annual) | 4.4/5 |
| 2 | Honeycomb | High-cardinality investigation | Fast debugging and exploratory analysis | Free; Pro from $130/mo | 4.7/5 |
| 3 | New Relic | Full-stack observability | Apps, infra, logs, and traces together | Free tier; usage from $0.40/GB | 4.4/5 |
| 4 | Grafana Cloud | Open, composable observability | Metrics, logs, traces with Grafana dashboards | Free; Pro from $19/mo + usage | 4.5/5 |
| 5 | Dynatrace | Enterprise automated observability | AI-assisted root cause across complex environments | From $1.40/mo per pod (usage) | 4.5/5 |
| 6 | Elastic Observability | Search-driven observability | Unified logs, metrics, traces with OTel ingest | From $0.07/GB ingested | 4.2/5 |
| 7 | Sentry | Developer-centric debugging | Frontend-to-backend error correlation | Free; Team from $26 | 4.5/5 |
1. Datadog
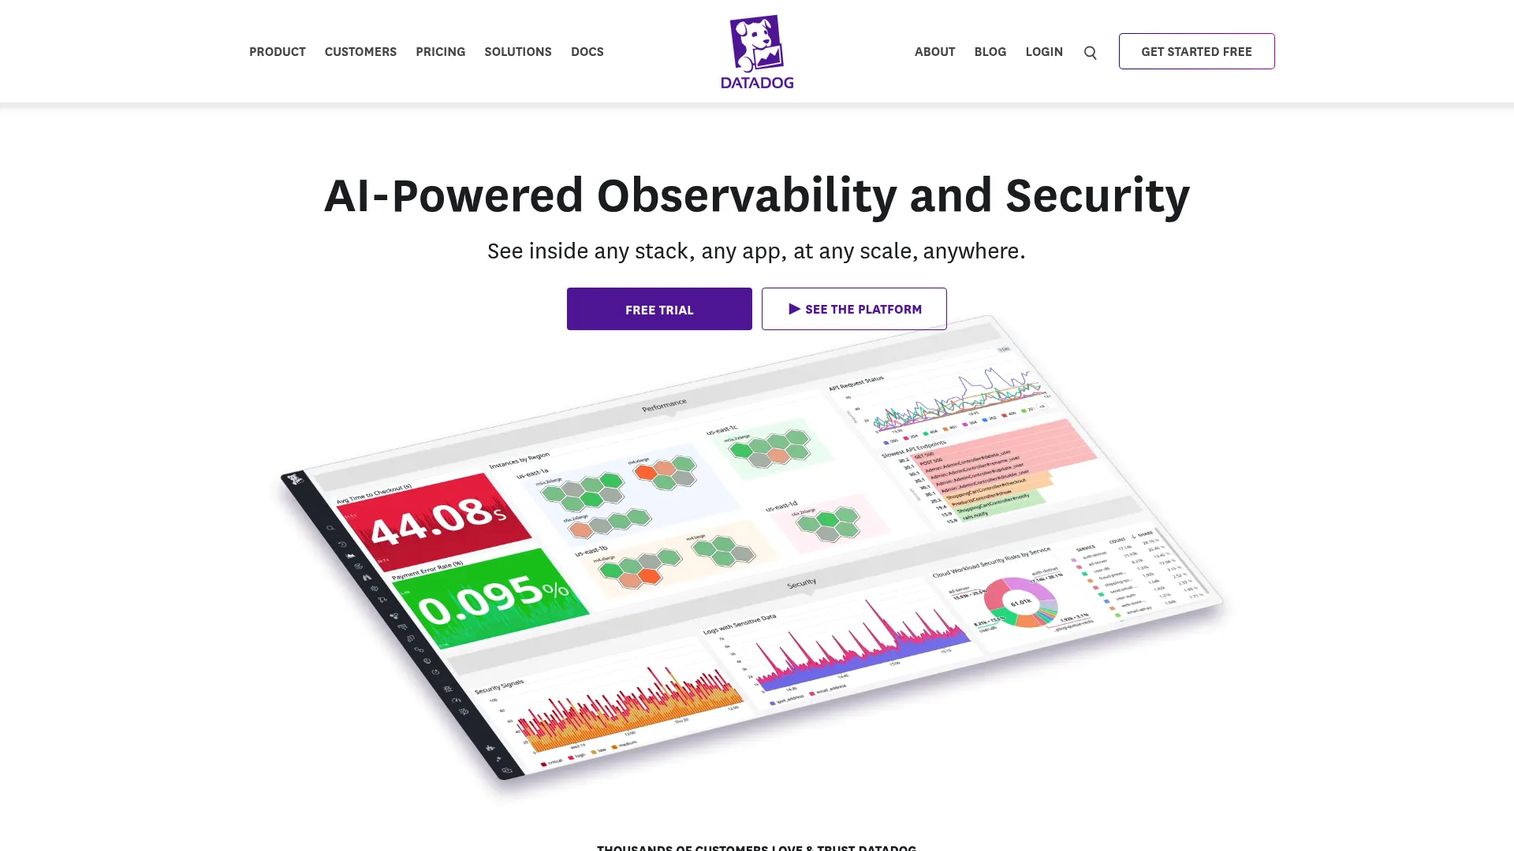
Datadog is the broad observability platform where distributed tracing lives inside a much larger APM and monitoring stack. You get traces, but you also get infrastructure monitoring, log management, real user monitoring, synthetics, and security, all correlated in one place. For teams that want to click from an alert to a metric to a trace to the underlying log without switching tools, that unified surface is the whole point.
Best for: Teams that want distributed tracing as one part of a single observability and security platform at scale.
Key strengths
- Unified telemetry: Traces connect directly to logs, metrics, and dashboards, so root cause analysis stays in one workflow.
- Broad instrumentation: OpenTelemetry support plus native agents cover most languages and runtimes.
- APM depth: Flame graphs, service maps, and trace search make cross-service latency easy to isolate.
Why choose Datadog: The trade-off worth naming is that you are usually adopting more than just tracing. Datadog shines when tracing is part of a wider telemetry strategy, and the correlation across signals is what justifies the platform. Teams that only want tracing may find the surface area larger than they need, but teams consolidating observability get real leverage.
Datadog pricing: Datadog uses product-specific, usage-based pricing. Infrastructure Monitoring has a Free tier for up to 5 hosts, a Pro plan from $15 per host per month billed annually, and Enterprise from $23 per host per month billed annually. APM and other products are priced separately, so model your full signal mix before committing.
2. Honeycomb
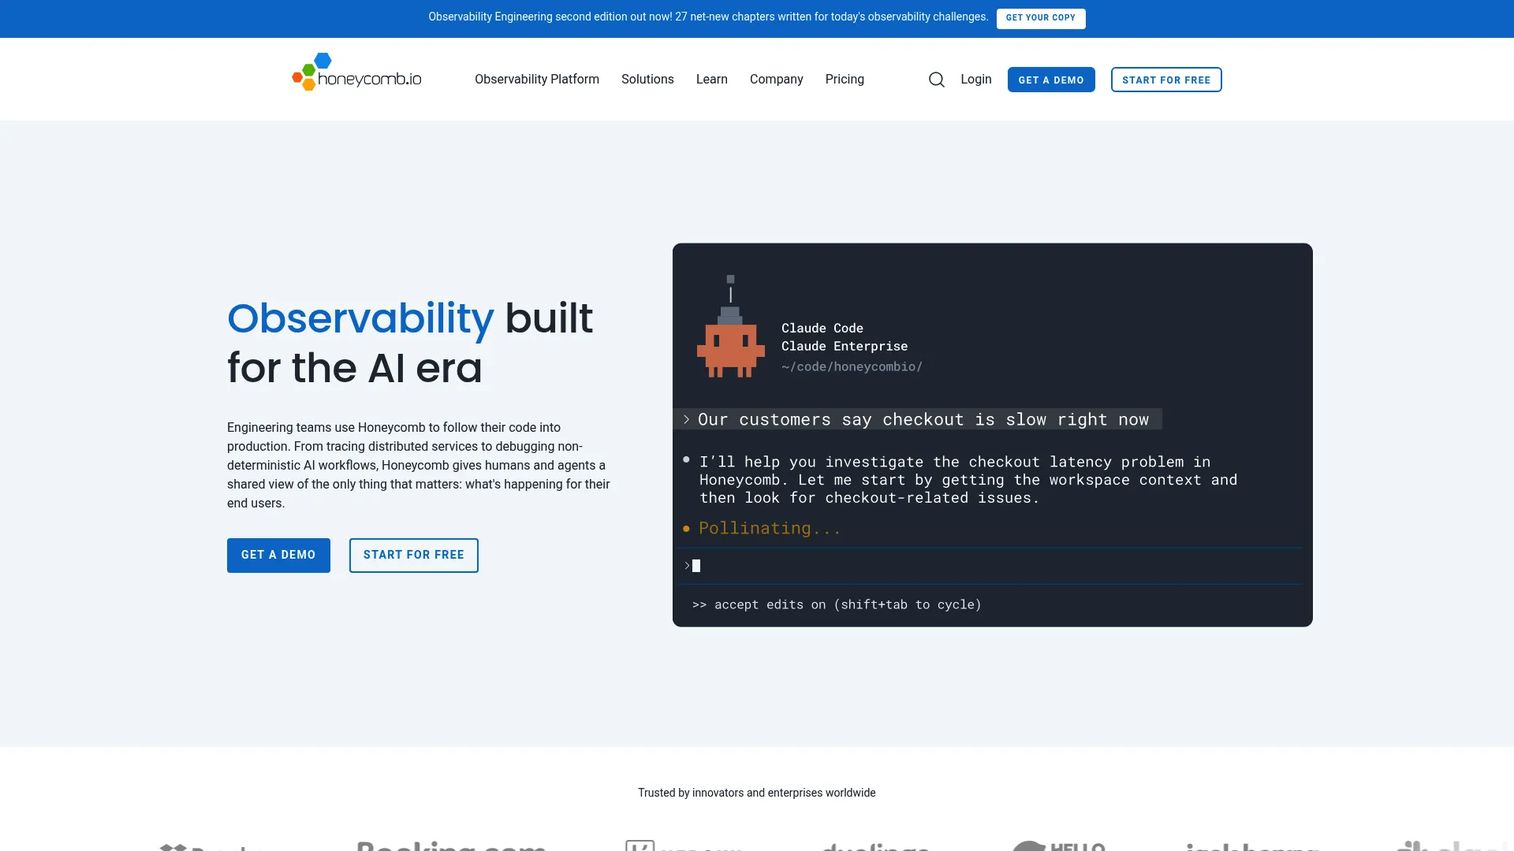
Honeycomb is the investigation-first option for teams that treat debugging as a conversation with their data. Its strength is high-cardinality analysis: you can slice trace data by any dimension (user ID, request path, feature flag) without pre-aggregating, then dig into individual traces. When you do not know the cause yet, Honeycomb is built to help you find it fast.
Best for: Engineering teams that need high-cardinality observability and fast incident investigation.
Key strengths
- BubbleUp outlier analysis: Automatically surfaces what makes slow or failing requests different from the rest.
- High-cardinality querying: Ask arbitrary questions across trace data without predefined dashboards.
- AI-assisted investigation: The Canvas AI copilot and Honeycomb MCP speed up exploratory analysis.
Why choose Honeycomb: Choose Honeycomb when your debugging workflow is exploratory rather than dashboard-driven. Teams that prioritize speed of investigation and asking novel questions of their trace data tend to shortlist it early. It fits observability-heavy engineering cultures especially well.
Honeycomb pricing: Honeycomb offers a Free plan (free forever), a Pro plan starting at $130 per month, and custom Enterprise pricing. Telemetry is priced by event volume, so estimate your span throughput during evaluation to project Pro-tier costs accurately.
3. New Relic
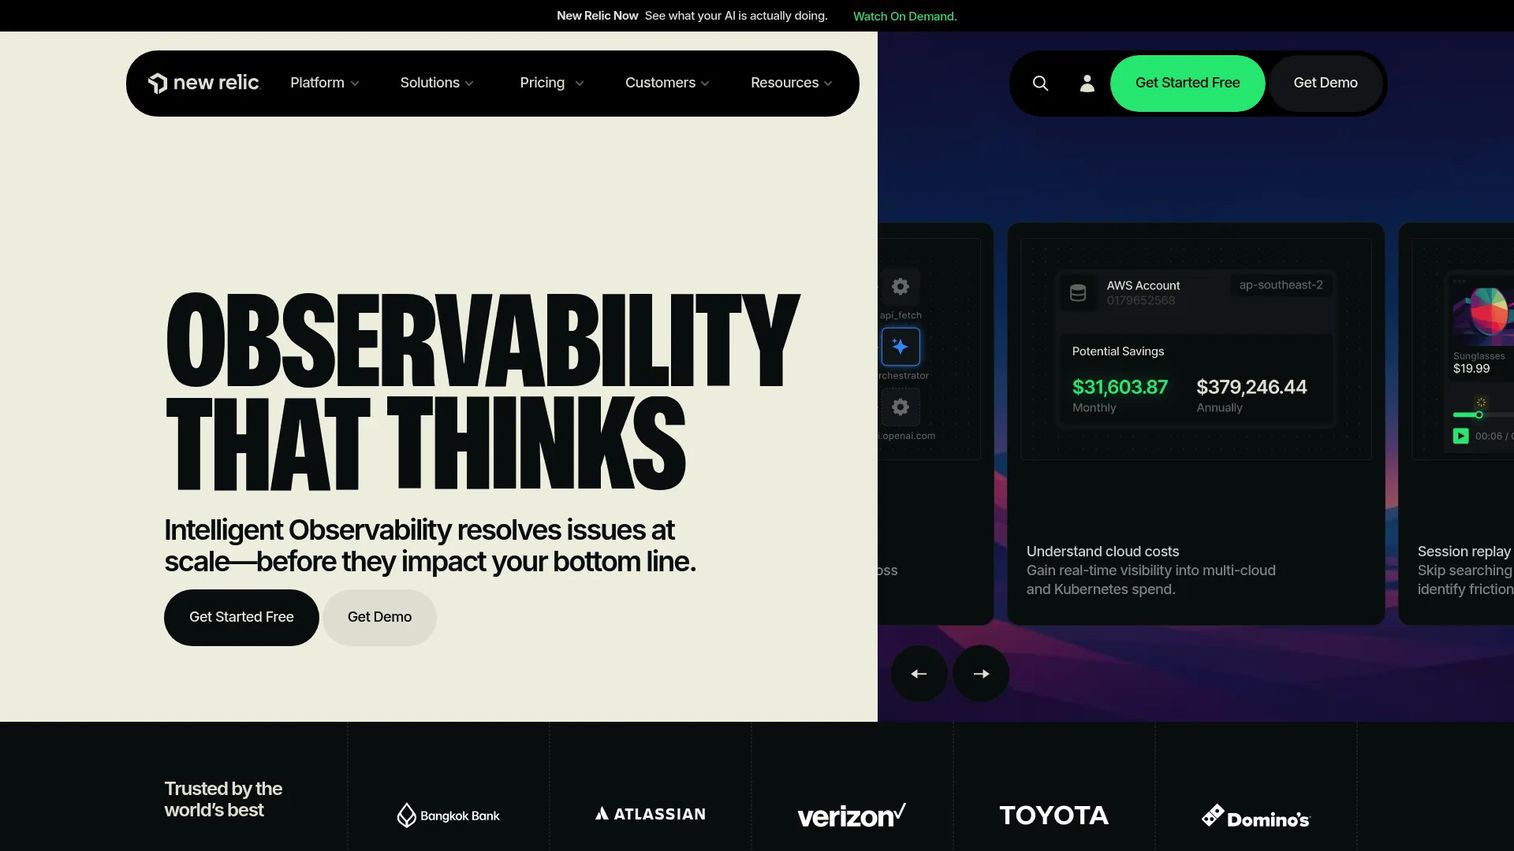
New Relic is the full-stack observability platform teams reach for when they want APM, tracing, and broader monitoring in one product. Distributed tracing fits inside a wider telemetry strategy alongside dashboards, logs, alerts, synthetics, and NRQL, the query language that lets you interrogate all your telemetry directly. For developer-heavy teams that live in query and dashboard workflows, that flexibility is the draw.
Best for: Teams wanting full-stack observability across apps, infrastructure, logs, and traces in one place.
Key strengths
- APM plus tracing: Application performance monitoring and distributed tracing work together across the stack.
- NRQL querying: Query traces, logs, and metrics with one flexible language for custom root cause analysis.
- Broad telemetry coverage: Dashboards, alerts, synthetics, and infrastructure monitoring in a single platform.
Why choose New Relic: New Relic makes sense when you want one platform for the whole telemetry picture rather than a tracing-only tool. The usage-based data model means costs track ingest volume, so it rewards teams that are intentional about what they send. Developers who value querying flexibility get a lot of room to work.
New Relic pricing: New Relic has a Free tier that includes 100 GB of ingest and one full platform user. Paid editions are Standard, Pro, and Enterprise, with usage-based data pricing at $0.40 per GB beyond the free 100 GB, plus user and compute options. Enterprise pricing is quote-based.
4. Grafana Cloud
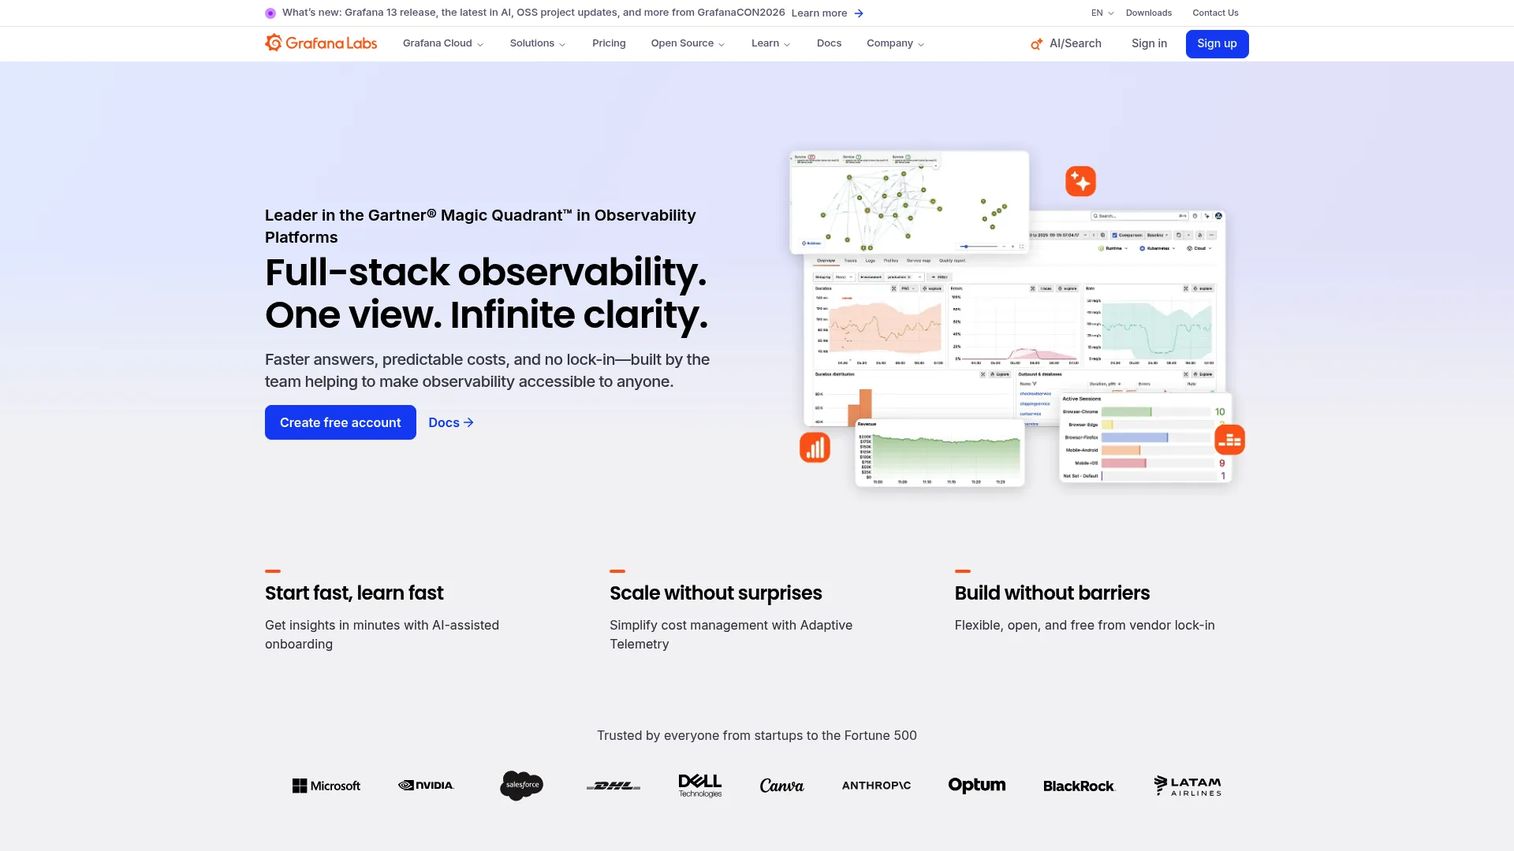
Grafana Cloud is the open observability choice for teams already living in Grafana dashboards. It brings managed metrics, logs, and traces together under one roof, with tracing (via Tempo) sitting alongside the visualization layer engineers already know. If you value open standards and composability over a single closed platform, this is the natural fit.
Best for: Teams wanting a managed, Grafana-based observability stack with a free entry tier and usage-based scaling.
Key strengths
- Managed metrics, logs, and traces: A full observability stack without running the backends yourself.
- Grafana dashboards: Correlate traces with metrics and logs in the visualization layer teams already use.
- OpenTelemetry-friendly: Built around open standards, so instrumentation stays portable.
Why choose Grafana Cloud: Grafana Cloud appeals to teams that want flexibility and to avoid lock-in. If your org already standardized on Grafana, adding managed traces keeps everything in one visualization surface. The usage-based model with a generous free tier makes it easy to start small and scale.
Grafana Cloud pricing: The Free plan is always free with usage limits. Pro starts from $19 per month plus usage, self-serve. Enterprise is full-service and starts at a $25,000 per year spend commit. Because pricing is usage-based across services, model your metrics, logs, and trace volume together.
5. Dynatrace
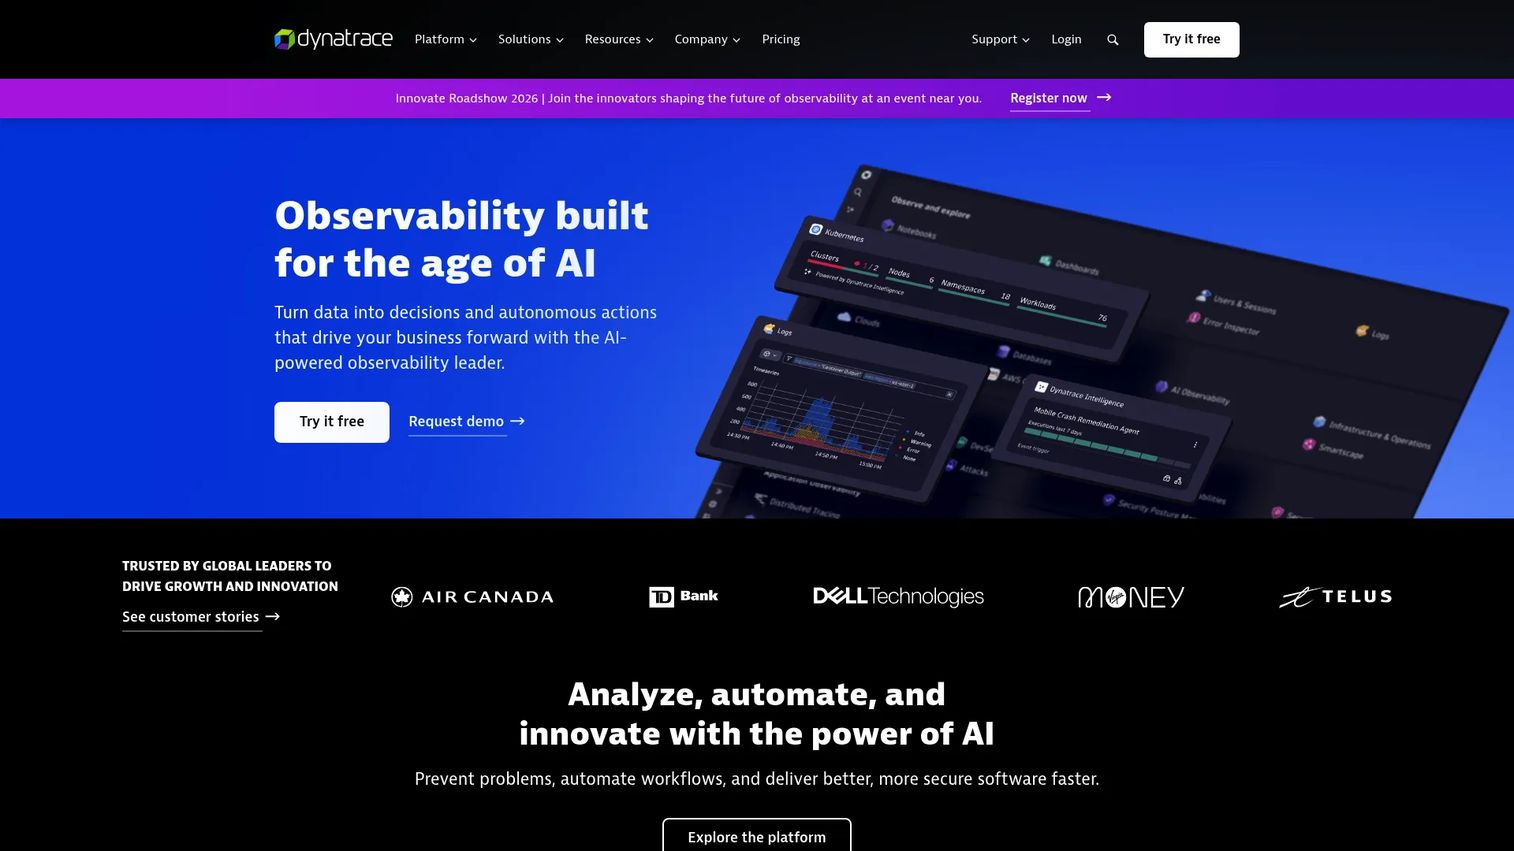
Dynatrace is the enterprise observability platform built for large, complex environments that need automation and deep dependency visibility. Its differentiator is AI-assisted analysis: Dynatrace Intelligence surfaces root cause and impact automatically, rather than leaving you to read every trace by hand. For orgs running sprawling hybrid and cloud estates, that automation is the selling point.
Best for: Enterprises needing full-stack observability with AI-assisted root cause analysis and automation.
Key strengths
- AI root cause analysis: Dynatrace Intelligence pinpoints likely causes and impact across services automatically.
- Unified observability: Coverage spans applications, infrastructure, cloud platforms, and AI workloads.
- Automation and analytics: AutomationEngine and Grail power context, analytics, and remediation at scale.
Why choose Dynatrace: Dynatrace fits larger organizations where the volume of services makes manual trace investigation impractical. The automation reduces the analysis burden, which is exactly what complex environments need. Implementation is a bigger undertaking than a lightweight tracing tool, so it rewards teams committing to a full platform.
Dynatrace pricing: Dynatrace publishes usage-based rate-card pricing across product areas: Foundation and Discovery from $7 per month per host, Infrastructure Monitoring from $29 per month per host, Full-Stack Monitoring from $58 per month per 8 GiB host, Kubernetes Platform Monitoring from $1.40 per month per pod, and Code Monitoring from $3.60 per month per container. Multi-year and volume discounts are noted on the pricing page.
6. Elastic Observability
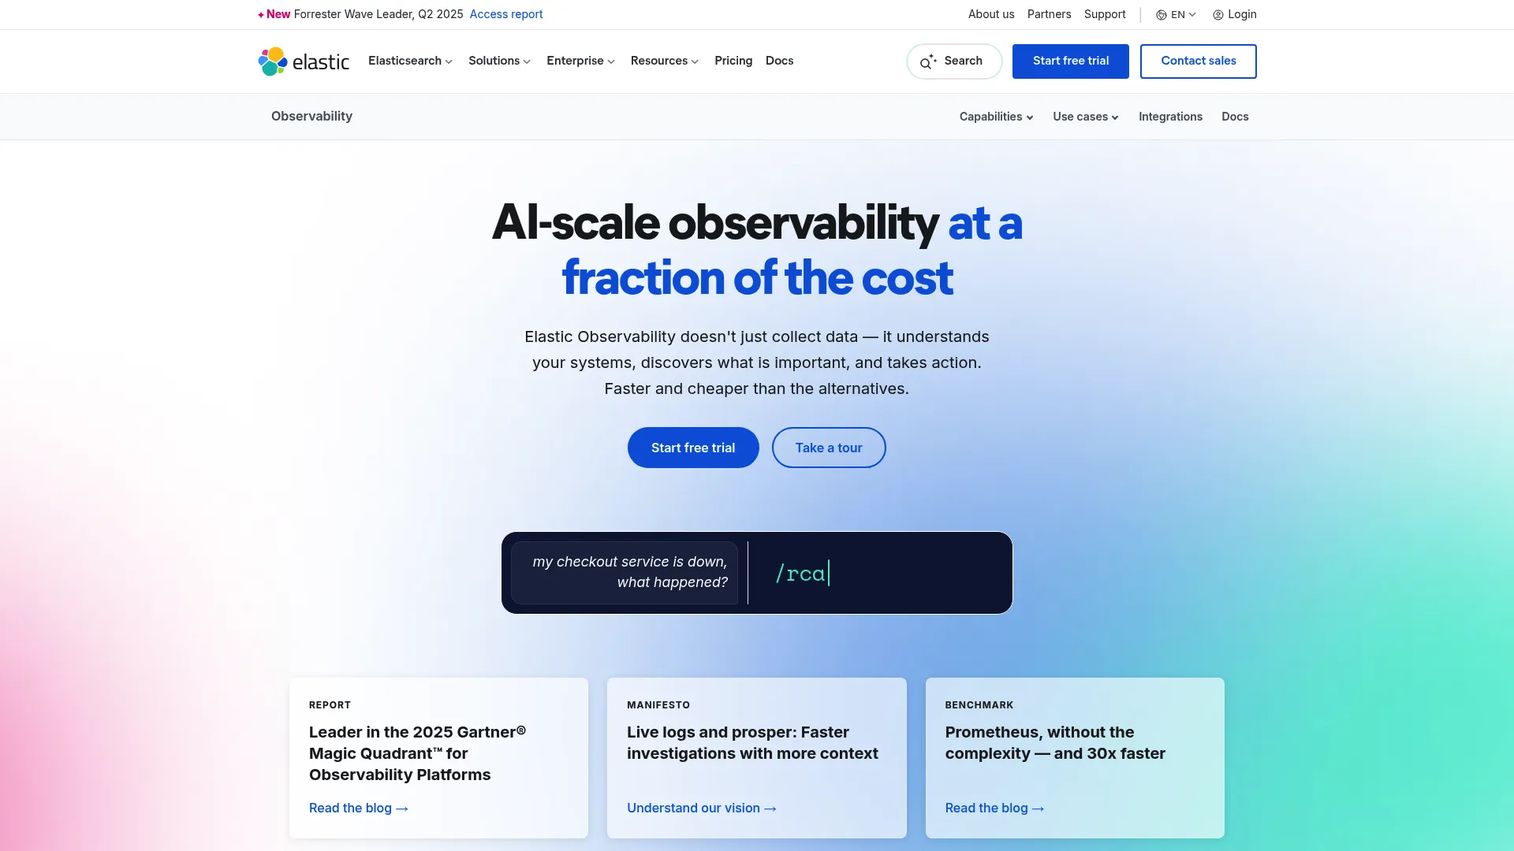
Elastic Observability is the choice for teams already in the Elastic ecosystem or those who want search-driven investigation across logs, metrics, and traces. Distributed tracing sits inside a unified experience powered by the same search engine that made Elastic a standard for log analysis. If you value centralized search and open instrumentation, this fits your workflow.
Best for: Teams wanting an AI-driven, OpenTelemetry-native observability platform with elastic scaling.
Key strengths
- Unified logs, metrics, and traces: One experience for all three signals, backed by Elastic search.
- OpenTelemetry-first and Prometheus-native: Open ingestion keeps instrumentation portable and standards-based.
- AI-assisted investigations: Guided investigations and remediation help isolate root cause faster.
Why choose Elastic Observability: Elastic makes the most sense when your team already relies on Elastic for search or logging and wants tracing in the same place. The search-driven model means you explore trace data the way you explore logs. Its OpenTelemetry-native stance keeps you flexible on instrumentation.
Elastic Observability pricing: Elastic's serverless observability pricing is usage-based. Logs Essentials starts as low as $0.07 per GB ingested, and Complete starts as low as $0.09 per GB ingested. Add-ons include synthetic monitoring at $0.0123 per browser test run and $28.00 per lightweight testing location per month. Hosted and self-managed deployment options are also available.
7. Sentry
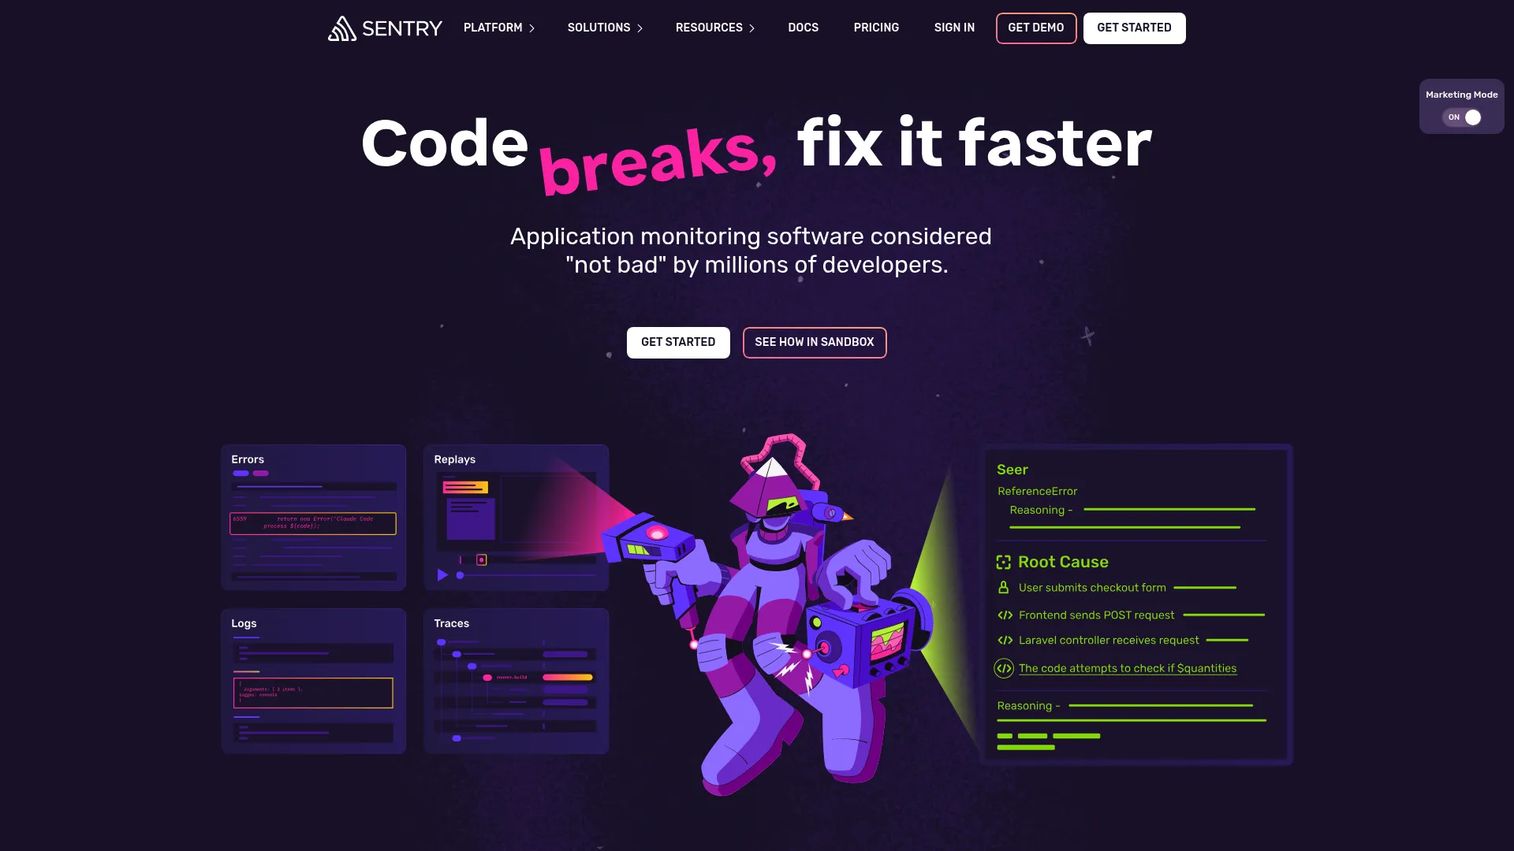
Sentry is the best fit for teams that want frontend-to-backend error correlation and developer-centric debugging. It started in error tracking and now pairs that with performance monitoring and distributed tracing, so an app error connects to the backend request that produced it. When you need to link a user-facing crash to the exact span that failed, Sentry is built for that.
Best for: Engineering teams needing production error monitoring with distributed tracing context.
Key strengths
- Error-to-trace correlation: Connects frontend errors directly to the backend spans and requests behind them.
- Session Replay and logs: See what the user did before an error, alongside the trace and logs.
- AI debugging with Seer: AI-assisted context speeds up finding and fixing the underlying issue.
Why choose Sentry: Sentry fits teams that think about observability from the developer and error-first angle rather than pure infrastructure monitoring. It is often evaluated as part of a developer error workflow, where distributed tracing supports issue investigation instead of standing alone. For frontend-heavy teams, the error correlation is hard to beat.
Sentry pricing: Sentry offers a Developer plan that is free, a Team plan at $26, and a Business plan at $80, per G2's listing. Usage-based event volume affects final cost, so estimate your error and span volume during a trial to project your tier.
Considerations before you buy
The right distributed tracing software depends less on feature checklists and more on how a tool fits your stack, your team, and your debugging habits. Use this checklist to pressure-test any shortlist.
OpenTelemetry support
OpenTelemetry has become the default instrumentation standard, and it decouples data collection from your vendor. Confirm the tool ingests OTel natively so you are not locked into proprietary agents. This protects you if you switch vendors later and keeps context propagation consistent across services.
Instrumentation effort
Ask how long it takes to get a first useful trace. Auto-instrumentation for your language and framework saves weeks over manual span creation. During a proof of concept, instrument one real service and time it end to end.
Sampling and data volume
Sampling controls cost, but aggressive sampling creates blind spots where the trace you need was never stored. Understand each tool's sampling model (head-based, tail-based) and how it affects both bill and coverage. Model your span volume against pricing before you commit.
Visualization and workflow fit
Flame graphs, service maps, and trace search are where you actually do root cause analysis. Evaluate whether the visualization matches how your team debugs, and whether traces correlate cleanly with logs and metrics. The best trace analytics are the ones your engineers will actually open at 2 a.m.
Enterprise readiness
For larger orgs, check SSO, RBAC, data residency, and how pricing scales from SMB to enterprise volume. Teams that evaluate observability the way they evaluate a contract analytics tool or PR analytics software know that governance and integration depth decide long-term fit.
Conclusion
The seven tools here fall into three broad groups. Broad observability platforms (Datadog, New Relic, Dynatrace, Elastic Observability) give you tracing inside a wider telemetry strategy, with logs, metrics, and alerts correlated in one place. Investigation-first tools (Honeycomb) optimize for fast, high-cardinality debugging when you do not yet know the cause. Developer-error workflows (Sentry) connect frontend crashes to backend traces for teams that debug from the error out. Grafana Cloud sits alongside these as the open, dashboard-centric option for teams standardized on Grafana.
The practical recommendation is simple: start with the tool that matches your existing telemetry stack and your team's debugging style. If you already run Grafana, evaluate Grafana Cloud first. If you want everything correlated in one platform, look at Datadog or New Relic. If exploratory investigation is your bottleneck, trial Honeycomb. Instrument one real service, run a real incident through it, and let the flame graph tell you whether it fits.
FAQs
Distributed tracing software follows a single request as it travels across multiple services in a distributed system, recording each step as a span and linking them with a shared trace ID. It visualizes the full request path as one timeline, so you can see where latency or errors occurred. It is the core tool for microservices debugging and root cause analysis.
Logs are discrete events recorded inside one service, useful for understanding what happened locally. A trace connects events across many services into a single causal chain, so you see the entire request rather than isolated fragments. In practice you use both: distributed tracing vs logs is not either-or, since traces show the path and logs add the detail on each span.
You do not strictly need OpenTelemetry, but it has become the default standard because it decouples how you collect trace data from where you send it. OpenTelemetry-native tools let you switch vendors without re-instrumenting your services. Most modern distributed tracing tools support OTel, and adopting it protects your instrumentation investment long term.
The main benefit is following one request across process boundaries. In a monolith a stack trace is enough, but in microservices a single user action triggers dozens of internal calls. Distributed tracing is the only way to see that full path, isolate which service caused a slowdown, and cut root cause analysis from hours to minutes.
A span represents one unit of work, like a database query or an API call. Every span in a request carries the same trace ID, which groups them into a single trace. Context propagation passes that trace ID across service boundaries, usually through HTTP headers, so the tool can reconstruct the complete end-to-end timeline.
Prioritize OpenTelemetry support, instrumentation effort, sampling model, visualization quality, and how well tracing correlates with your existing logs and metrics. Then check enterprise factors like SSO, data residency, and how usage-based pricing scales. The best tool is the one that fits your telemetry stack and your team's debugging workflow, not the one with the most features.
Not exactly. APM (application performance monitoring) is broader and often includes distributed tracing as one component alongside metrics, error tracking, and profiling. Tracing is the mechanism for following requests across services, while APM is the wider discipline of monitoring application health. Many platforms in this list bundle both.
The common challenges are instrumentation effort, sampling blind spots, and controlling data volume. Manual instrumentation takes time, aggressive sampling can drop the exact trace you needed, and high span volume drives cost. The fix is auto-instrumentation where available, a tail-based sampling strategy that keeps interesting traces, and modeling span volume against pricing before you scale.