

Your onboarding completion rate dropped after last week's release. Support tickets climbed. Engineering says the database looks fine. Product says the UI is fine. Meanwhile, users are churning at the step where your checkout query runs.
This is the gap database monitoring software closes. It tells you whether the problem is a slow query, a lock contention event, or a resource ceiling, so your team argues about evidence instead of instinct.
The global database monitoring software market reached $2.7 billion in 2025 and is projected to grow at 13.4% CAGR through 2034, according to Fortune Business Insights (2025). Yet most teams still find out about database incidents after customers report them.
Which database monitoring tool gives your team the right signal without adding operational drag? That depends on your database engines, your infrastructure model, and how much maintenance your team can own. This guide maps 21 tools to those decisions.
What's inside
This guide covers 21 database monitoring tools evaluated for 2026 across commercial, open-source, cloud-native, and SQL Server-specific options.
- Who this is for: PMs, platform teams, DevOps engineers, DBAs, and SRE teams evaluating database performance monitoring tools
- Selection criteria: Database engine coverage, query-level diagnostics, alert quality, deployment model fit
- Pricing and ratings: Verified against vendor pages and G2 listings
- Scope: Tools span full-stack application performance monitoring, SQL Server-specific monitoring, open-source stacks, and cloud-native options
TL;DR
- Best for full-stack database observability: Datadog, New Relic, or Dynatrace, depending on your existing APM stack
- Best for SQL Server estates: Redgate SQL Monitor, SolarWinds Database Performance Analyzer, or IDERA SQL Diagnostic Manager
- Best for open-source teams: Prometheus, Zabbix, Checkmk, Icinga, Netdata, or DBA Dash
- Best for AWS-native stacks: Amazon CloudWatch when your databases run on RDS or Aurora
- Best for Oracle environments: Oracle Enterprise Manager
- Best buying rule: Match engine coverage first. Then evaluate query diagnostics, alert quality, retention, and team maintenance capacity
What is database monitoring software?
Database monitoring software tracks the health, availability, performance, and activity of databases so teams can detect issues, diagnose bottlenecks, and protect user-facing workflows before failures spread.
A green uptime check does not explain slow checkout, onboarding timeouts, or failed reports. Database monitoring goes deeper, surfacing query-level behavior and resource saturation that generic infrastructure tools miss.
Key capability areas:
- Performance monitoring: Query latency, wait events, CPU, memory, I/O, locks, deadlocks
- Availability monitoring: Uptime, failover state, replication lag, backup status, connection saturation
- Query diagnostics: Execution plans, slow query identification, index usage, wait states
- Alerting: Threshold-based alerts, anomaly detection, baseline deviation, escalation routing
- Database observability: Connecting database metrics with application traces, logs, and infrastructure signals
- Activity monitoring: Audit trails, privileged access events, compliance signals
- Capacity planning: Storage growth trends, resource forecasting, saturation projections
Key features to look for:
- Multi-database engine coverage (SQL Server, Oracle, PostgreSQL, MySQL, MongoDB, cloud-managed)
- Query-level diagnostics, not just server health
- Alert noise control via baselines and thresholds
- Historical trend data for root cause analysis
- Cloud and hybrid environment support
- Low production overhead on monitored instances
- Integrations with incident management and DevOps workflows
According to Redgate's 2025 State of the Database Landscape, 56% of surveyed organizations said their database monitoring tools would benefit from multi-platform support. That gap shows up in real teams running mixed stacks and switching between disconnected dashboards. For PMs, the signal matters most when it connects to business activity monitoring that explains activation drop-off or support ticket spikes.
When to use database monitoring tools
Diagnose user-facing slowdowns
When activation drops or a workflow times out, the problem lives somewhere in the stack. Database monitoring helps engineering separate a slow query from a UX friction point, so the team fixes the right thing. PMs get a defensible answer for roadmap prioritization: Performance work versus product investment.
Manage cloud and hybrid database environments
Teams running databases across AWS RDS, Azure SQL, on-premises SQL Server, and Kubernetes need consistent visibility without switching between five dashboards. Database performance monitoring tools centralize that signal, especially when replication lag or connection saturation explains inconsistent user experiences across regions.
Reduce incident response time
Database incidents get expensive when teams learn about them from support tickets. Monitoring tools surface abnormal wait events, deadlocks, or resource exhaustion early, route alerts to the right team, and preserve history for post-incident analysis. For PMs, this means having instrumentation data before an engineering sprint gets redirected to firefighting.
Database monitoring tools comparison
The table below covers all 21 tools in the order they appear in this guide. Pricing and G2 ratings were verified against vendor pages and G2 listings for 2026.
| # | Product | Best for | Key differentiator | Pricing | G2 rating |
|---|---|---|---|---|---|
| 1 | Datadog | Full-stack cloud observability | Database metrics alongside APM and infrastructure | From $9/host/mo | 4.4/5 |
| 2 | New Relic | Unified observability on usage-based pricing | Correlated database, APM, and infrastructure telemetry | Free tier available | 4.4/5 |
| 3 | Dynatrace | Enterprise AI-driven observability | AI root cause analysis across services and databases | From $7/host/mo | 4.5/5 |
| 4 | SolarWinds Database Performance Analyzer | Cross-platform database performance tuning | Wait-time analysis and ML anomaly detection | 14-day trial; quote for pricing | 4.5/5 |
| 5 | Redgate SQL Monitor | SQL Server and hybrid Microsoft estates | SQL Server-first monitoring with multi-platform support | Per server/year; contact for price | 4.5/5 |
| 6 | Quest Foglight for Databases | Multi-platform enterprise database teams | Cross-database diagnostics and workload analytics | Custom pricing | 4.0/5 |
| 7 | Paessler PRTG | Infrastructure teams monitoring databases alongside devices | Sensor-based monitoring across systems | From $200/mo (annual) | N/A |
| 8 | ManageEngine Applications Manager | App teams needing database and application views | APM with database monitoring and 150+ technology support | Free tier; from $395/year | 4.7/5 |
| 9 | Site24x7 | Cloud operations and MSP teams | SaaS monitoring across websites, servers, clouds, and databases | Free tier; from $9/mo | 4.6/5 |
| 10 | Grafana Cloud | Teams building metrics-first observability | Hosted Grafana with Prometheus, logs, and traces | Free tier; Pro from $19/mo | N/A |
| 11 | Prometheus | Open-source metrics collection | Pull-based metrics with database exporters | Free (open source) | 4.5/5 |
| 12 | Zabbix | Self-hosted infrastructure monitoring | Open-source platform with templates and auto-discovery | Free software; support from €245/mo | 4.3/5 |
| 13 | Checkmk | Hybrid infrastructure monitoring | Agent and agentless monitoring with 2,000+ integrations | Free Community edition; Pro from €190/mo | 4.7/5 |
| 14 | Icinga | Open-source alerting frameworks | Flexible monitoring with plugin ecosystem | Free; support from $15,000/year | 4.4/5 |
| 15 | Netdata | Real-time infrastructure visibility | Per-second metrics with auto-detection | Free up to 5 nodes; from $7/node/mo | 4.6/5 |
| 16 | Amazon CloudWatch | AWS-native database monitoring | Native monitoring for RDS, Aurora, DynamoDB, and more | Usage-based; free tier available | 4.3/5 |
| 17 | Elastic Observability | Log-heavy engineering teams | Search-based log, metrics, and APM correlation | From $0.07/GB ingested | 4.3/5 |
| 18 | Splunk Observability Cloud | Enterprise incident response | Metrics, traces, logs, and database monitoring | From $15/host/mo (annual) | 4.3/5 |
| 19 | Oracle Enterprise Manager | Oracle database estates | Deep Oracle lifecycle management | Custom pricing | 4.3/5 |
| 20 | IDERA SQL Diagnostic Manager | SQL Server DBAs | SQL Server diagnostics, waits, deadlocks, and health checks | From $1,247/instance/year | 4.1/5 |
| 21 | DBA Dash | Free SQL Server monitoring | Self-hosted, open-source SQL Server monitoring | Free (open source) | N/A |
Best 21 database monitoring tools for 2026
1. Datadog
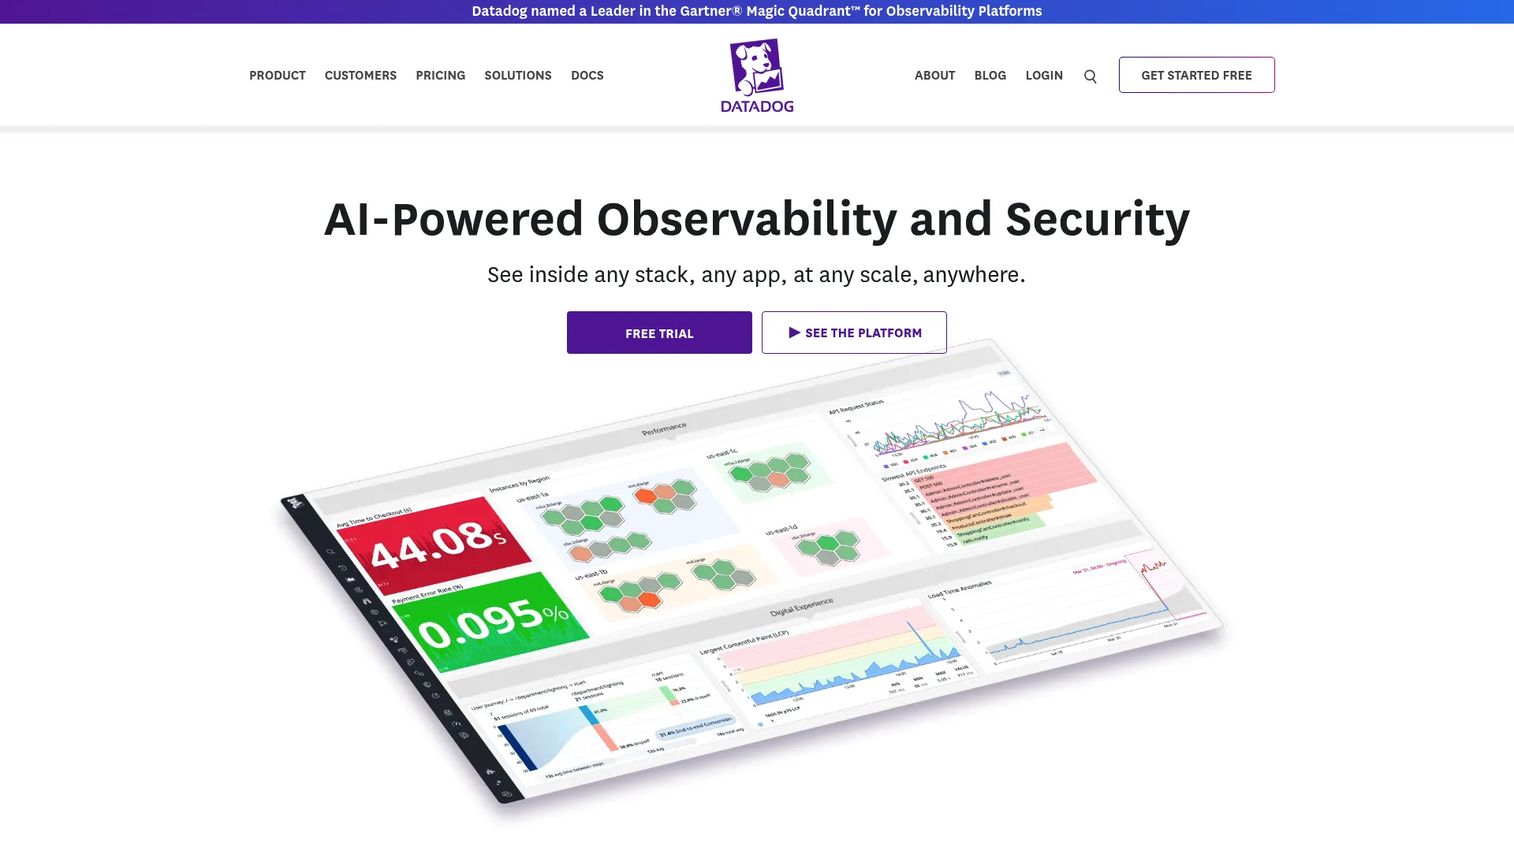
Datadog is an integrated cloud observability platform covering monitoring, security, digital experience, and software delivery. Its Database Monitoring product surfaces query performance, explain plans, wait events, and database health alongside existing APM and infrastructure signals. Supported databases include PostgreSQL, MySQL, SQL Server, Oracle, MongoDB, and ClickHouse, plus cloud-managed database services.
Best for: Engineering, platform, and IT operations teams running cloud-native or hybrid stacks who want database visibility inside the same observability workflow as services and infrastructure.
Key features
- Query performance monitoring with explain plan analysis
- Wait event tracking and database health dashboards
- APM trace correlation connecting database calls to service behavior
- Anomaly-based alerting with configurable thresholds
- 1,000+ integrations including infrastructure, containers, and cloud services
Why choose Datadog: Choose it when database performance needs to live in the same operational view as services and incident workflows. If your team already uses Datadog APM, adding database monitoring avoids context-switching between tools.
Datadog pricing: Infrastructure Monitoring plans start at $15 per host per month (billed annually) or $18 on-demand. APM plans start at $31 per host per month (annual). Database Monitoring is a separate product; check the Datadog pricing page for current rates, as some configurations require contacting sales.
G2 rating: 4.4/5
2. New Relic
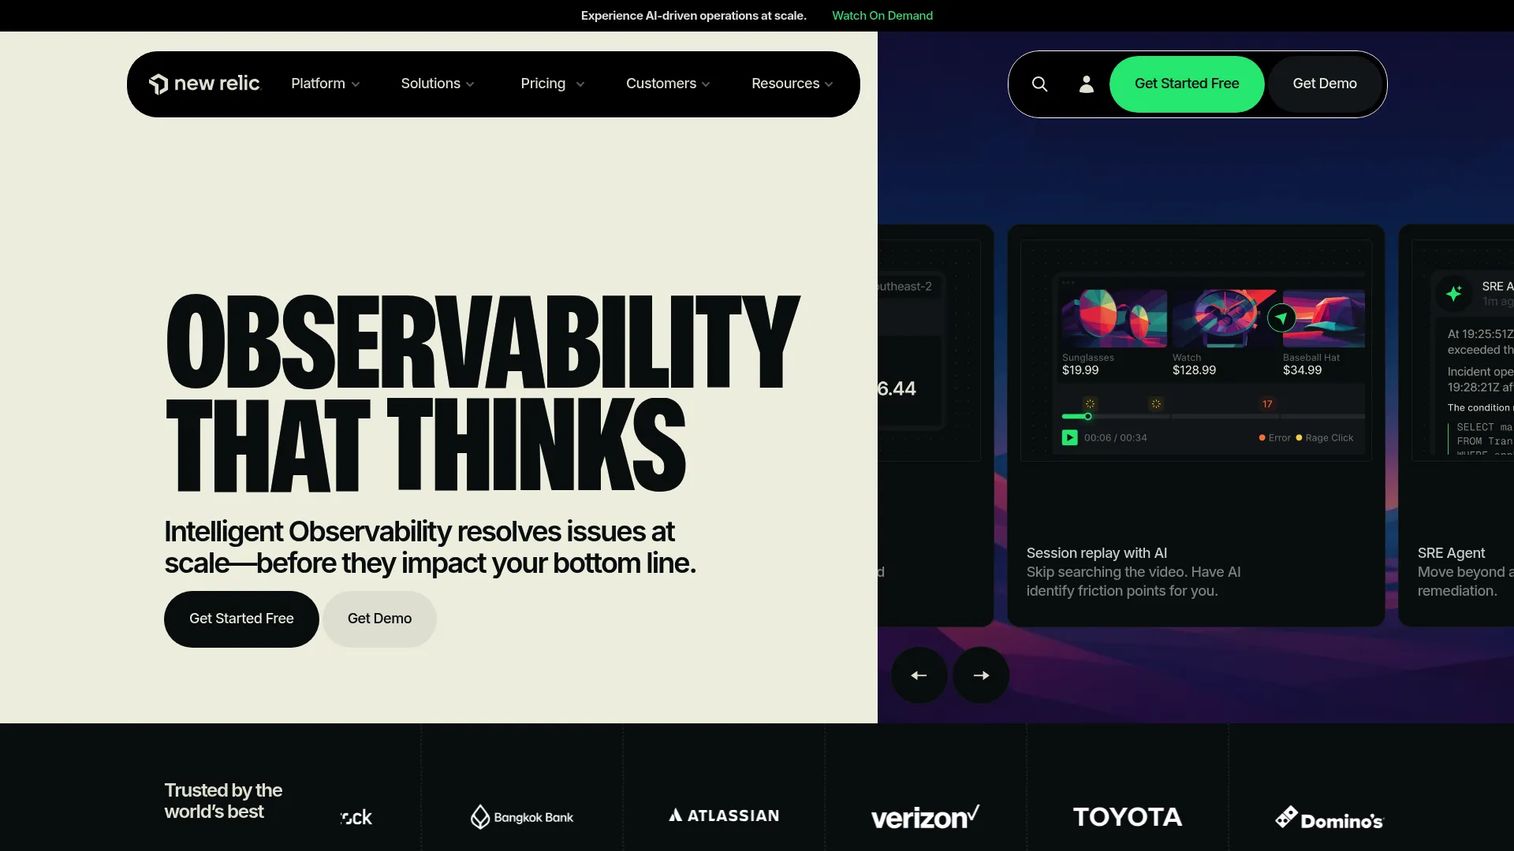
New Relic is an observability platform for correlating telemetry, operational context, and AI monitoring across applications, infrastructure, and databases. Database visibility sits inside the broader platform alongside distributed tracing, log management, browser monitoring, and Kubernetes observability. Teams use it to connect slow pages or workflow failures to specific database calls without opening a separate tool.
Best for: Engineering teams standardizing on a single observability stack who want database, application, and infrastructure signals in one place on usage-based pricing.
Key features
- Database performance views with query-level detail
- APM correlation linking database calls to service spans
- Infrastructure and Kubernetes monitoring
- Log management with logs-in-context
- AI monitoring and intelligent alert grouping
Why choose New Relic: Its usage-based pricing model suits teams with variable workloads, and the free tier lets smaller teams start without a contract. It fits best when database monitoring is one requirement among several observability needs rather than the primary focus.
New Relic pricing: Free tier includes 100 GB monthly data ingest and one full platform user. Standard paid plans start at $10/month for the first full platform user. Pro plans run $349/user/month on annual commitment.
G2 rating: 4.4/5
3. Dynatrace
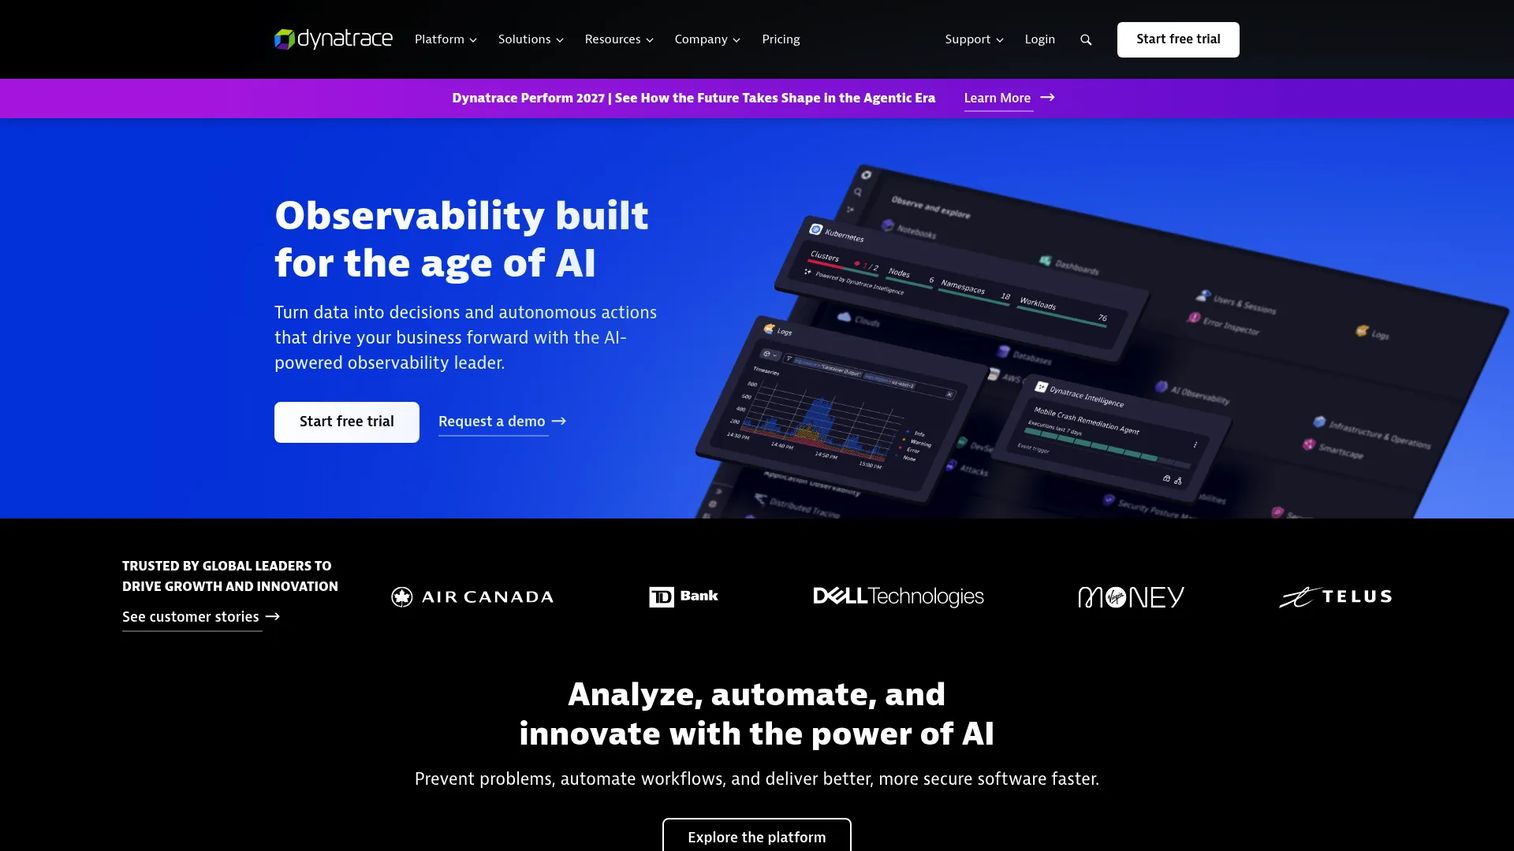
Dynatrace is an agentic AI observability platform built for large, complex environments running across hybrid and multicloud infrastructure. It monitors applications, databases, Kubernetes, services, and infrastructure as an interconnected system, using AI-assisted root cause analysis to identify what changed and why. Database monitoring surfaces within the full topology, so an incident affecting a user-facing workflow traces back through service calls to specific database behavior.
Best for: Large enterprise teams managing complex environments where incidents cross service, database, infrastructure, and network boundaries simultaneously.
Key features
- AI-powered root cause analysis across services and databases
- Full service dependency mapping with database nodes
- Application and infrastructure observability in a unified view
- Kubernetes and container monitoring
- Digital experience monitoring connecting frontend behavior to backend database calls
Why choose Dynatrace: Best for organizations that want automated context around incidents rather than a team manually correlating separate dashboards. The platform's AI layer reduces mean time to detection when problems span multiple systems.
Dynatrace pricing: Foundation and Discovery starts at $7 per host per month. Infrastructure Monitoring runs $29 per host per month. Full-Stack Monitoring is $58 per 8 GiB host per month. All pricing is consumption-based.
G2 rating: 4.5/5
4. SolarWinds Database Performance Analyzer
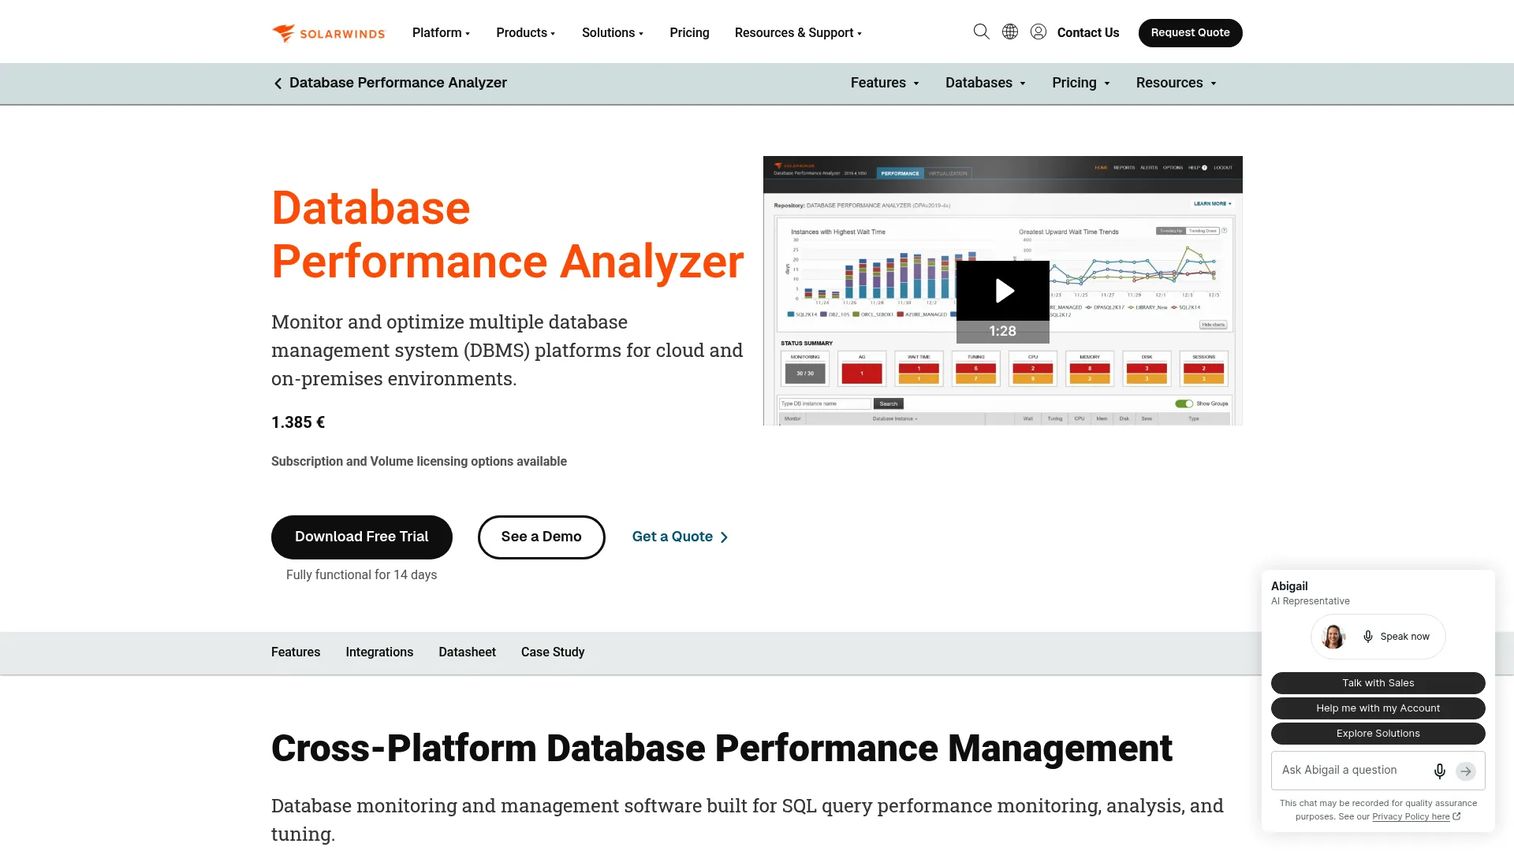
SolarWinds Database Performance Analyzer focuses specifically on database performance diagnostics across hybrid, cloud, and on-premises environments. Its wait-time analysis approach identifies exactly where query time is spent, whether in CPU, I/O, locks, or network, so DBAs can tune the right problem. It supports SQL Server, Oracle, MySQL, PostgreSQL, Db2, and other engines, making it useful for teams with mixed database estates.
Best for: DBA and IT teams focused on query performance tuning and bottleneck analysis across cross-platform database environments.
Key features
- Wait-based analytics and response-time analysis
- Machine-learning anomaly detection for query behavior
- Query and table tuning advisors with specific recommendations
- Blocking and deadlock detection
- Cross-platform database support
Why choose SolarWinds Database Performance Analyzer: Strong fit for teams that need database-specific diagnostics without adopting a full observability platform. If engineering needs evidence to justify performance sprint work, the wait-time analysis gives PMs concrete data for roadmap decisions.
SolarWinds Database Performance Analyzer pricing: A 14-day fully functional trial is available. The vendor prices by quote; contact SolarWinds for current per-instance or subscription pricing.
G2 rating: 4.5/5
5. Redgate SQL Monitor
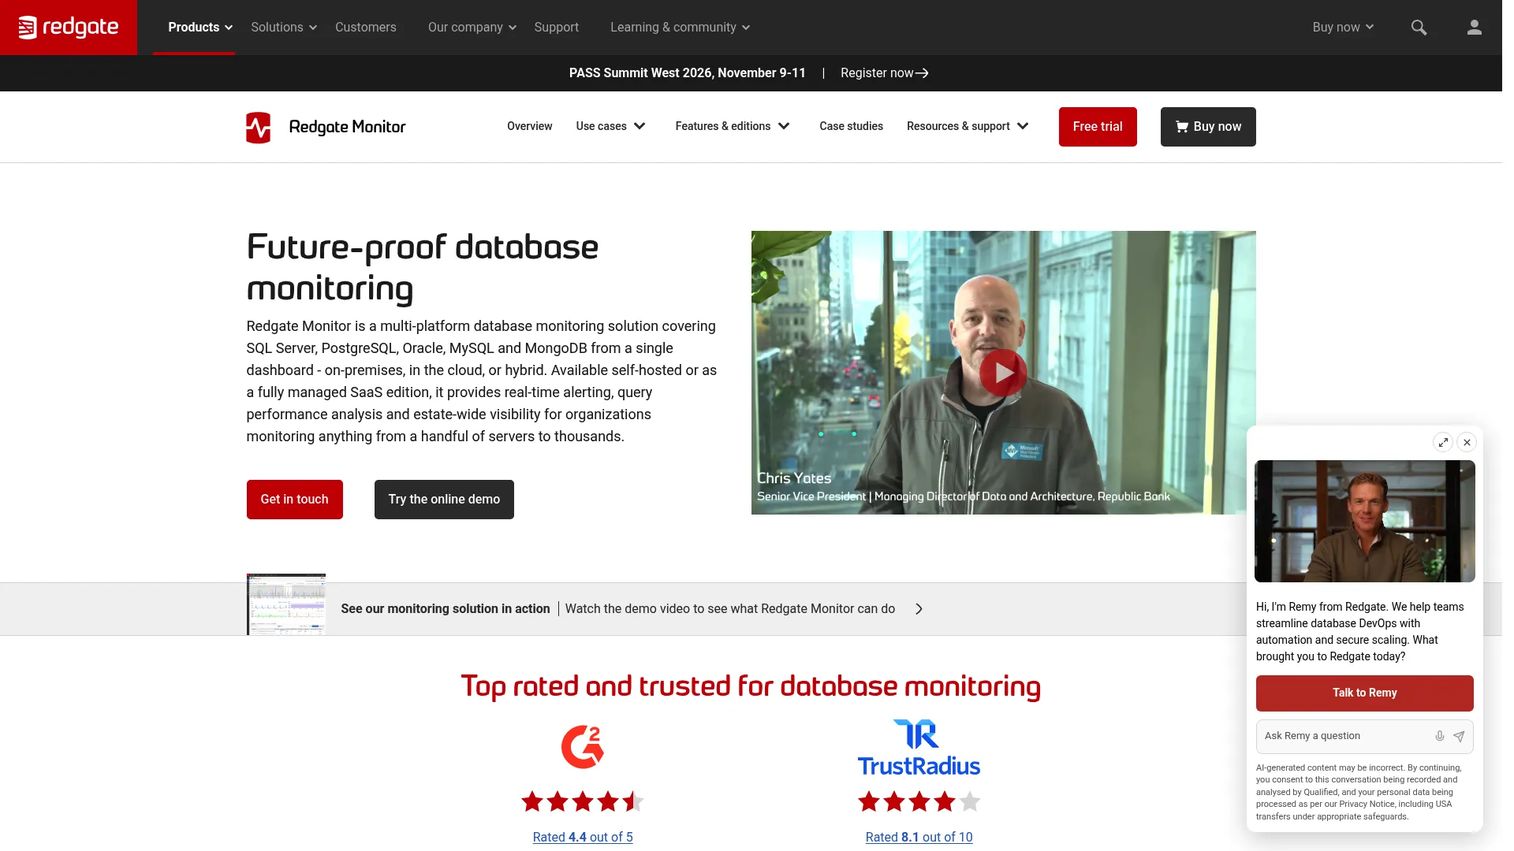
Redgate SQL Monitor is a multi-platform database monitoring tool built with SQL Server teams in mind, now expanded to PostgreSQL, Oracle, MySQL, and MongoDB. It provides a global overview across database instances, availability groups, clusters, and virtual machines alongside query performance analysis, customizable alerting, deployment tracking, and VM cost visibility. The Enterprise tier adds security monitoring, auditing, and high availability architecture.
Best for: DBA and operations teams with heavy SQL Server usage who need deep monitoring, estate-wide visibility, and query impact tracking.
Key features
- Global estate overview across instances, clusters, and availability groups
- Long-running query and blocked process diagnosis
- Customizable alerting with deployment event correlation
- Auditing, reporting, and VM cost visibility
- Security monitoring and sensitive action log on Enterprise
Why choose Redgate SQL Monitor: Best for SQL Server-centric teams that need DBA-grade detail without sacrificing an estate-level view. Its hybrid coverage handles SQL Server, Azure SQL, and Amazon RDS SQL Server in one dashboard.
Redgate SQL Monitor pricing: Standard is priced per server per year; Enterprise requires contacting Redgate for a quote. A 14-day free trial is available for evaluation.
G2 rating: 4.5/5
6. Quest Foglight for Databases
Quest Foglight for Databases provides cross-platform database monitoring and diagnostics for enterprise environments running heterogeneous stacks. It covers SQL Server, Oracle, MySQL, PostgreSQL, MongoDB, SAP, and DB2, among others, with workload analytics, adaptive baselines, root cause diagnostics, and historical performance reporting. Teams use it for query performance investigation and to understand how database behavior shifts under changing workloads.
Best for: Enterprise database and IT teams monitoring multiple database engines across cloud, on-premises, and hybrid environments.
Key features
- Unified monitoring across multiple database platforms
- Real-time diagnostics and historical performance analysis
- Adaptive baselines and intelligent alerting
- Query performance insights and optimization guidance
- Root cause analysis and workload investigation
Why choose Quest Foglight for Databases: Best for large organizations where product reliability depends on many database engines and teams need a single operational view across the estate. Its workload analytics help engineering teams identify whether performance changes correlate with deployment events or usage shifts.
Quest Foglight for Databases pricing: Quest prices by request. Contact the vendor for current quotes.
G2 rating: 4.0/5
7. Paessler PRTG
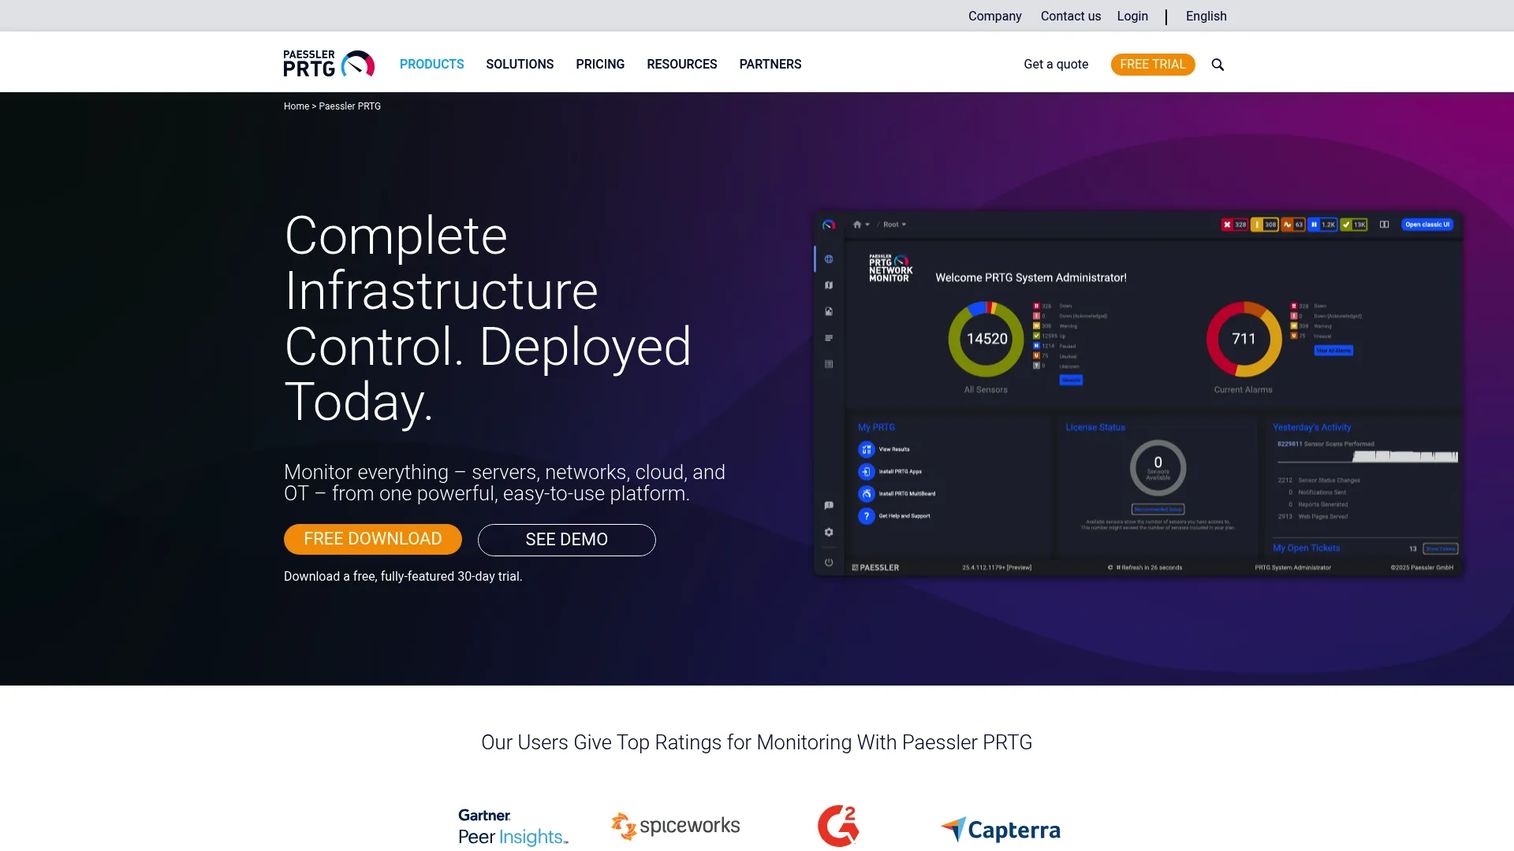
Paessler PRTG is a sensor-based infrastructure monitoring platform covering networks, servers, applications, cloud services, and databases under one dashboard. Database monitoring is one sensor category among many, making it practical for IT teams that need database signals inside a broader infrastructure view rather than a dedicated database tool. PRTG supports on-premises and hosted deployments, with remote probes for distributed environments.
Best for: IT teams and managed service providers that need database checks integrated with server, network, and application monitoring without running separate tools.
Key features
- Sensor-based monitoring across networks, servers, databases, and cloud services
- Customizable alerts via email, push notifications, SMS, and scripts
- Distributed monitoring with remote probes
- Dashboards, maps, and scheduled reporting
- API access and custom sensor support
Why choose Paessler PRTG: Best when database monitoring is one requirement inside a broader infrastructure monitoring need. Teams that already use PRTG for network and server visibility can add database sensors without introducing another tool.
Paessler PRTG pricing: Subscription tiers are based on the number of monitored sensors. PRTG 500 starts at $200 per month (billed annually). PRTG 1000 runs $358 per month. A free freeware edition covers up to 100 sensors.
8. ManageEngine Applications Manager
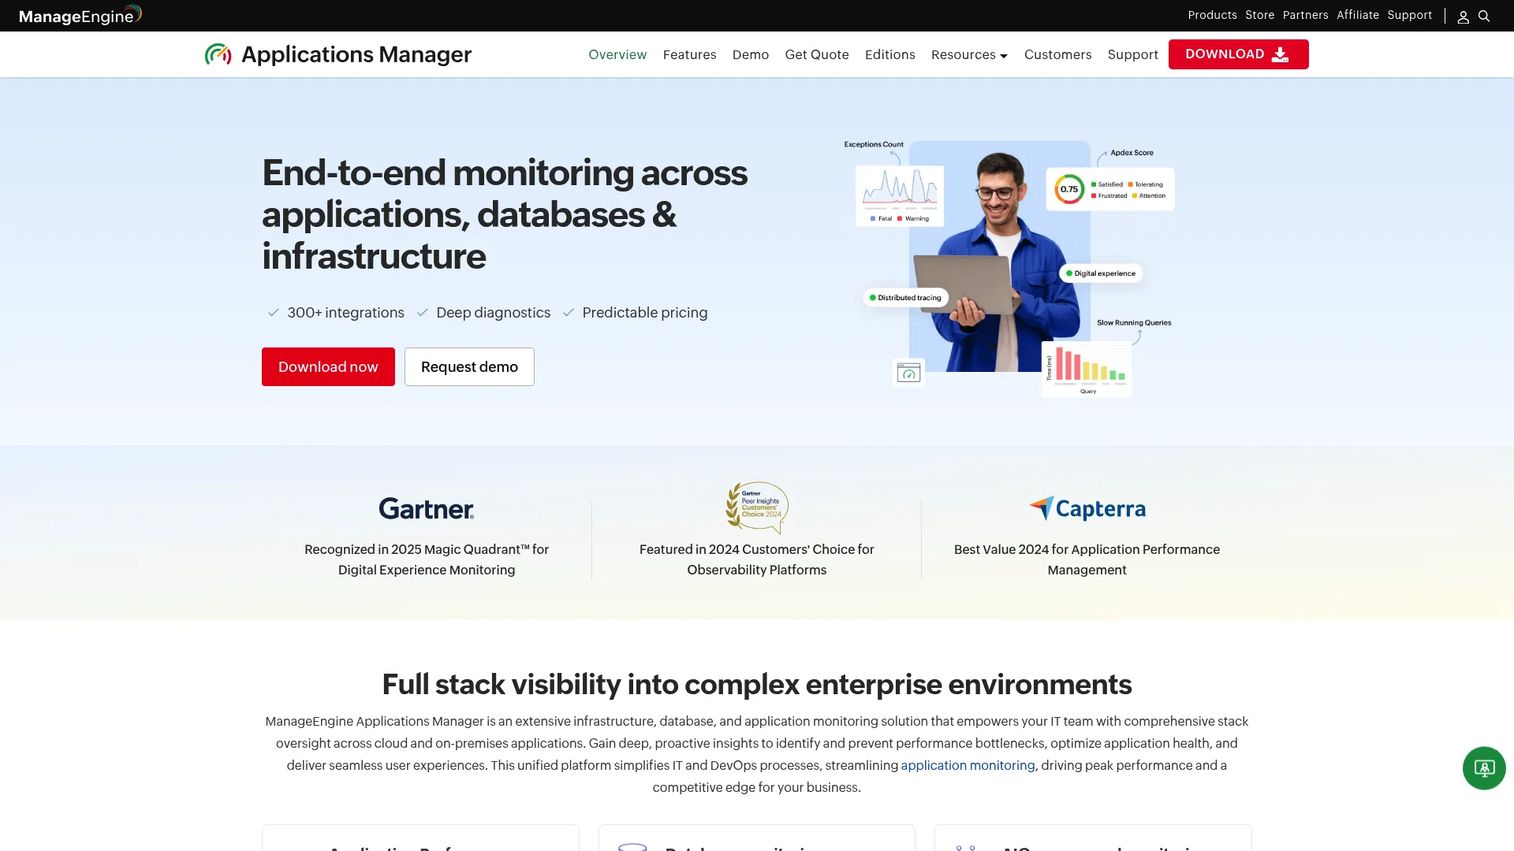
ManageEngine Applications Manager is an application performance monitoring platform that includes database monitoring, server visibility, and digital experience tracking. It supports more than 150 technologies, including Oracle, SQL Server, MySQL, PostgreSQL, MongoDB, Cassandra, Redis, and cloud databases. Teams use it when they need application and database context together rather than isolated database diagnostics.
Best for: IT operations and SRE teams that need application performance and database monitoring in a single platform without adopting a full enterprise observability stack.
Key features
- Application performance monitoring with code-level insights and service maps
- Database performance metrics and slow query identification
- Real user monitoring and digital experience tracking
- Support for 150+ on-premises and cloud technologies
- Alert escalation and REST API integrations
Why choose ManageEngine Applications Manager: Best for app teams where database performance is one variable in a broader application health picture. For PMs, it connects workflow failure data with the underlying database behavior that caused it.
ManageEngine Applications Manager pricing: A free edition covers up to five applications or servers. The Professional Edition starts at $395 per year (10 monitors, 1 user). Enterprise Edition starts at $3,995 per year (100 monitors, 1 user). Perpetual licenses are also available.
G2 rating: 4.7/5
9. Site24x7
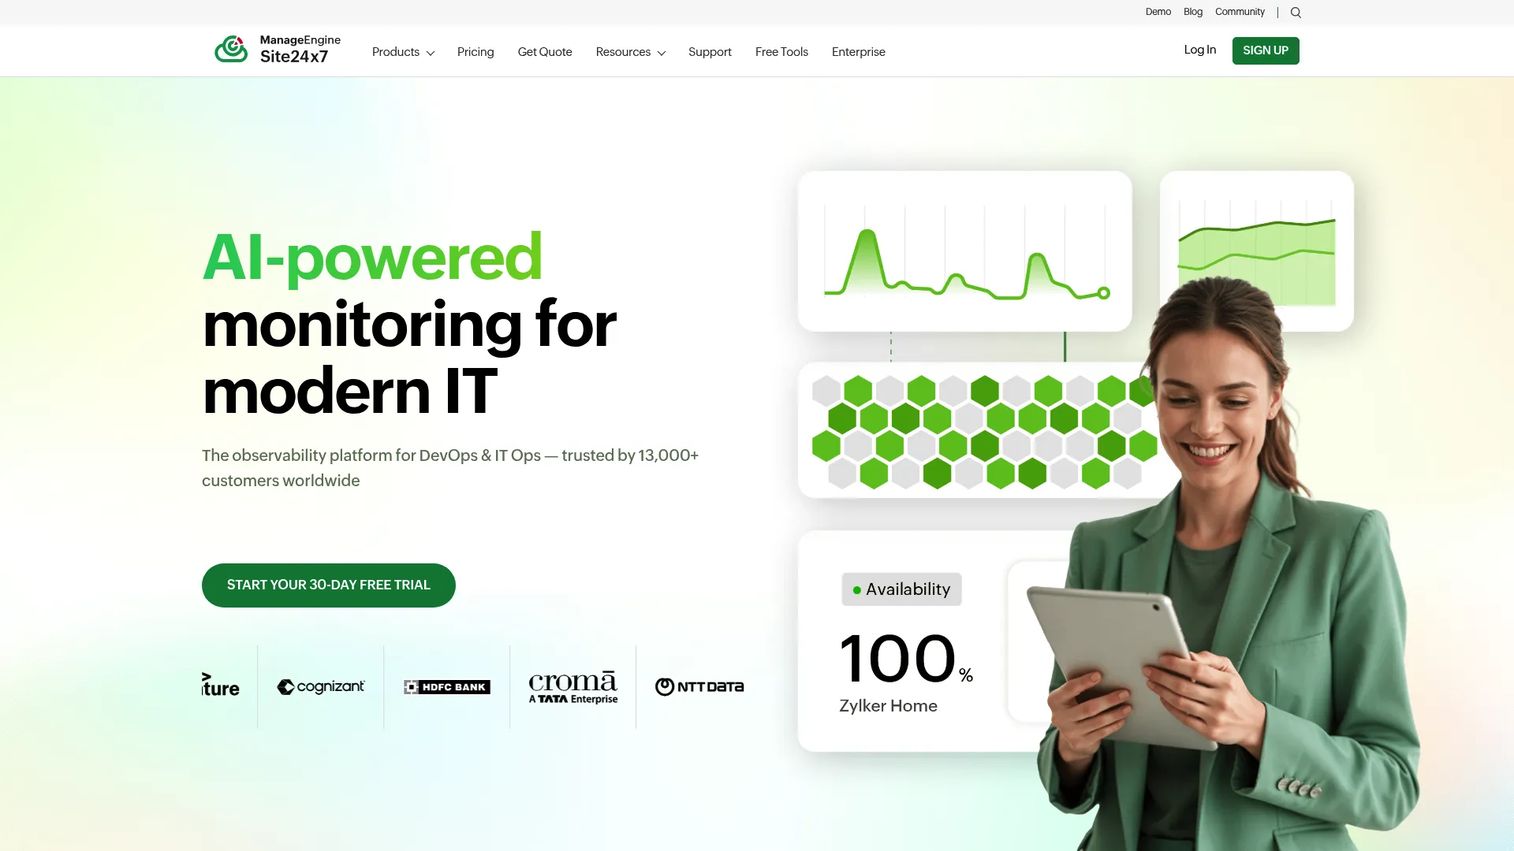
Site24x7 is an AI-powered SaaS monitoring platform covering websites, servers, networks, applications, cloud resources, Kubernetes, and databases. It suits cloud operations teams and MSPs that need broad monitoring coverage without building a custom observability stack. Database monitoring plugs into the same dashboard as synthetic checks, real user monitoring, and log management.
Best for: Cloud operations teams and MSPs that want database monitoring as part of a broad, SaaS-delivered monitoring platform rather than a standalone tool.
Key features
- Database monitoring via plugins integrated with infrastructure and application views
- Website and synthetic transaction monitoring
- Server, cloud, and Kubernetes monitoring
- Real user monitoring and log management
- Alert routing with integrations for incident workflows
Why choose Site24x7: Best for teams that need database signals alongside website availability, server health, and cloud metrics without assembling separate components. Its SaaS delivery reduces setup overhead compared to self-hosted alternatives.
Site24x7 pricing: A free tier is available. The Starter plan runs $9 per month. Plans scale through Pro at $35, Classic at $89, Elite at $225, and Enterprise at $449 per month.
G2 rating: 4.6/5
10. Grafana Cloud
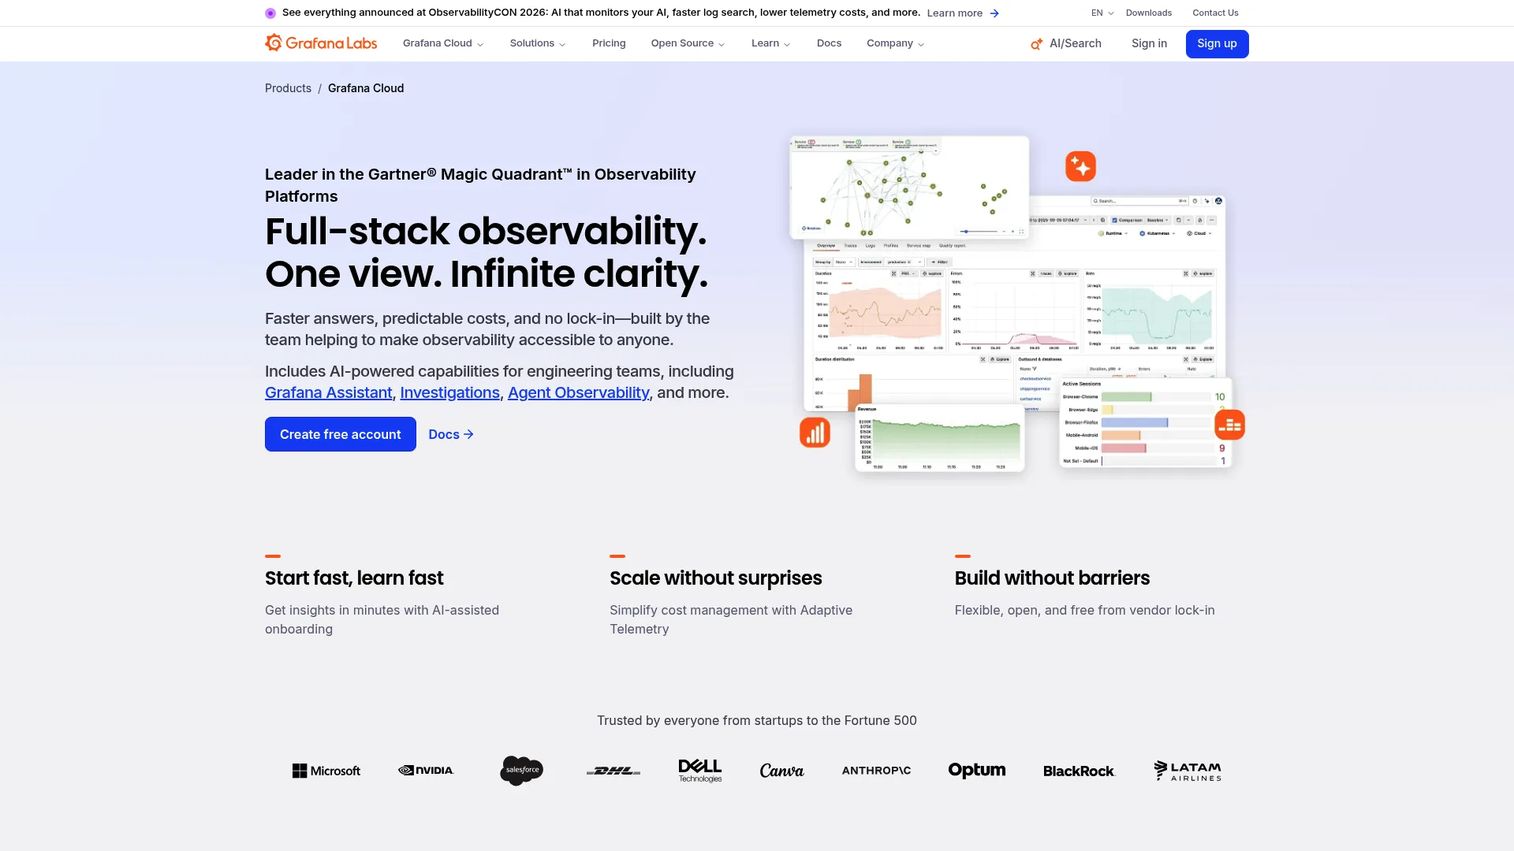
Grafana Cloud is a hosted observability platform built around the Grafana dashboard ecosystem, with native support for Prometheus metrics, logs via Loki, traces via Tempo, and continuous profiling. Database monitoring depends on exporters, integrations, and dashboard configurations. Teams already using Prometheus or the Grafana stack find it familiar; others face a configuration investment to get database dashboards running.
Best for: Engineering teams that want Grafana's dashboard flexibility without hosting the full Grafana stack, and who already use Prometheus-compatible exporters for their databases.
Key features
- Hosted Grafana with Prometheus metrics integration
- Logs, traces, and continuous profiling in one platform
- OpenTelemetry support and 300+ integrations
- Alerting rules with AI-assisted investigation
- Adaptive telemetry for cost optimization
Why choose Grafana Cloud: Best for teams with engineering capacity to configure exporters and dashboards. It suits organizations where observability is a first-class engineering concern and flexibility matters more than out-of-the-box database coverage.
Grafana Cloud pricing: The free tier includes usage-limited access. Pro plans start from $19 per month plus usage-based charges. Enterprise requires a $25,000 per year spend commitment.
11. Prometheus
Prometheus is an open-source monitoring and alerting toolkit that collects time-series metrics through a pull-based scraping model. Database monitoring relies on community-maintained exporters for PostgreSQL, MySQL, Redis, MongoDB, SQL Server, and others. Most teams pair Prometheus with Grafana for dashboards and Alertmanager for escalation routing. It is the foundation for many cloud-native monitoring stacks.
Best for: Infrastructure, Kubernetes, and cloud-native teams that want composable, open-source monitoring and have engineering capacity to manage exporters and configuration.
Key features
- Pull-based metric scraping from instrumented targets and exporters
- Local time-series storage with configurable retention
- PromQL querying for flexible data analysis
- Recording and alerting rules with Alertmanager integration
- Built-in graphing and HTTP API for toolchain integration
Why choose Prometheus: Best for teams with engineering ownership and a preference for composable open-source monitoring. The API monitoring tools ecosystem around Prometheus is mature, but initial configuration and ongoing exporter maintenance require investment.
Prometheus pricing: Prometheus is free and open source. Practical costs come from infrastructure hosting, storage, and engineering time for configuration and maintenance.
G2 rating: 4.5/5
12. Zabbix
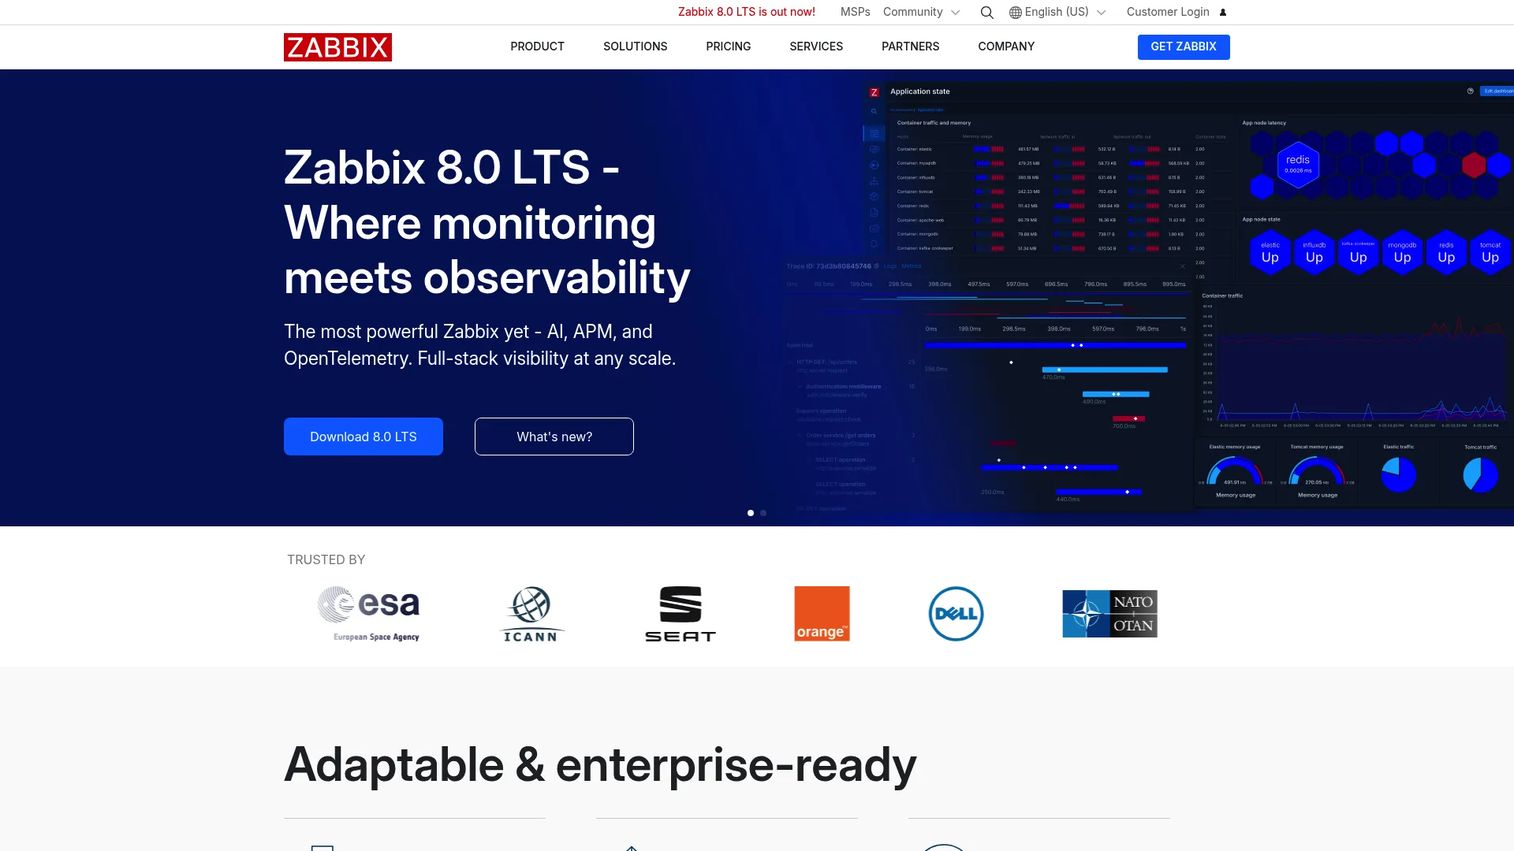
Zabbix is an enterprise-grade open-source monitoring platform for infrastructure, networks, applications, cloud environments, and databases. It uses templates, agents, agentless monitoring, and OpenTelemetry to collect metrics, with alerting, escalation workflows, dashboards, and scheduled reporting built in. Database monitoring is handled through templates and custom checks for supported database services.
Best for: Organizations that need a self-hosted, open-source monitoring system with broad coverage, flexible templates, and no per-instance license cost.
Key features
- OpenTelemetry-based monitoring with event correlation and anomaly detection
- Large-scale data collection using agents, agentless methods, and proxies
- Alerting, escalation workflows, and automated remediation
- Dashboards, maps, and scheduled reporting
- On-premises, cloud, Docker, and cloud-image deployment options
Why choose Zabbix: Best for infrastructure teams that want mature alerting and auto-discovery without a SaaS dependency. The open-source model keeps license costs out of the picture, but engineering ownership of maintenance and upgrades is the tradeoff.
Zabbix pricing: Zabbix software is free to download and use. Support subscriptions start at €245 per month (billed annually) for the Silver tier.
G2 rating: 4.3/5
13. Checkmk
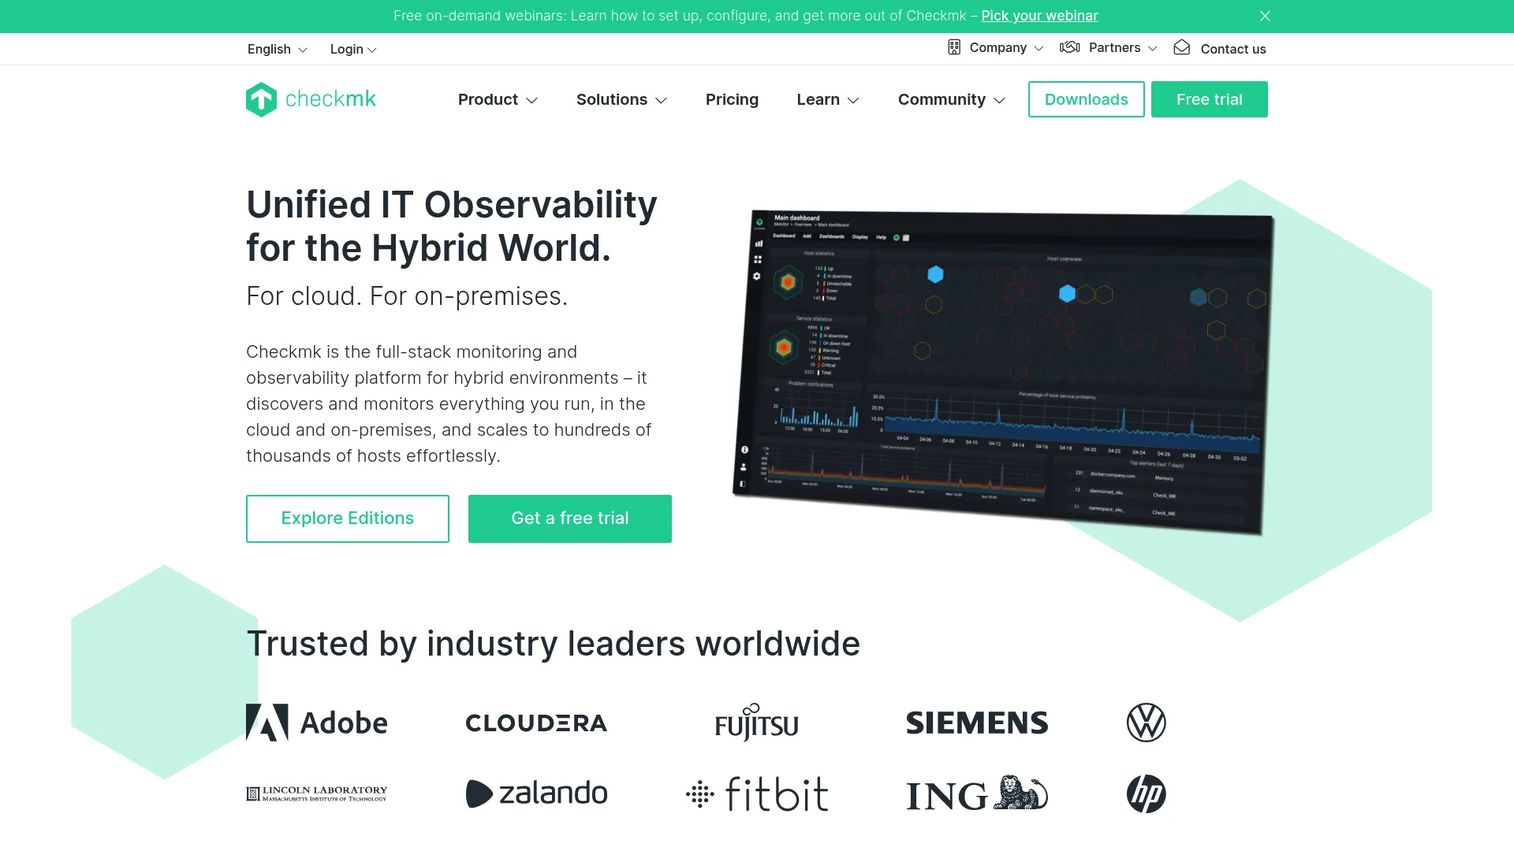
Checkmk is a full-stack monitoring platform for hybrid and cloud-native infrastructure. It combines agent and agentless monitoring with automated host and service discovery, more than 2,000 integrations, and database monitoring through plugins and checks. Teams running complex hybrid environments appreciate its auto-discovery and consistent coverage across physical servers, virtual machines, containers, and cloud services.
Best for: IT operations teams that need broad infrastructure monitoring with database checks included, particularly in hybrid environments with auto-discovery requirements.
Key features
- Automatic host and service discovery with 2,000+ integrations
- Agent and agentless monitoring for hybrid environments
- Database monitoring via plugins and checks
- Synthetic monitoring for web and desktop applications
- OpenTelemetry and Prometheus metric ingestion
Why choose Checkmk: Best for operations teams where database monitoring is one part of a larger hybrid infrastructure monitoring need. Its Community edition gives smaller teams a free starting point before scaling to paid editions.
Checkmk pricing: The Community edition is free. Pro starts at €190 per month (billed annually). Ultimate starts at €275 per month. Cloud AI is available from €240 per month.
G2 rating: 4.7/5
14. Icinga
Icinga is an open-source infrastructure monitoring framework with custom checks, a plugin ecosystem, alert routing, and scalable distributed monitoring. Database monitoring is implemented through plugins and custom check scripts, giving technical teams full control over what gets monitored and how alerts are routed. It suits teams comfortable with configuration rather than point-and-click setup.
Best for: Technical IT teams that want an adaptable monitoring framework they can configure for their specific database environment and alert workflow.
Key features
- Open-source monitoring framework with flexible plugin ecosystem
- Custom check scripts and alert routing
- Real-time infrastructure monitoring and high availability
- Metrics and log integration
- Scalable distributed monitoring for large environments
Why choose Icinga: Best for teams that want control over monitoring logic rather than a packaged SaaS tool. The configuration investment pays off in environments with unusual database setups or complex alert routing requirements.
Icinga pricing: The core software is free and open source. Repository subscriptions run $5,000 per year. Module subscriptions are $2,000 per year. Support subscriptions start at $15,000 per year.
G2 rating: 4.4/5
15. Netdata
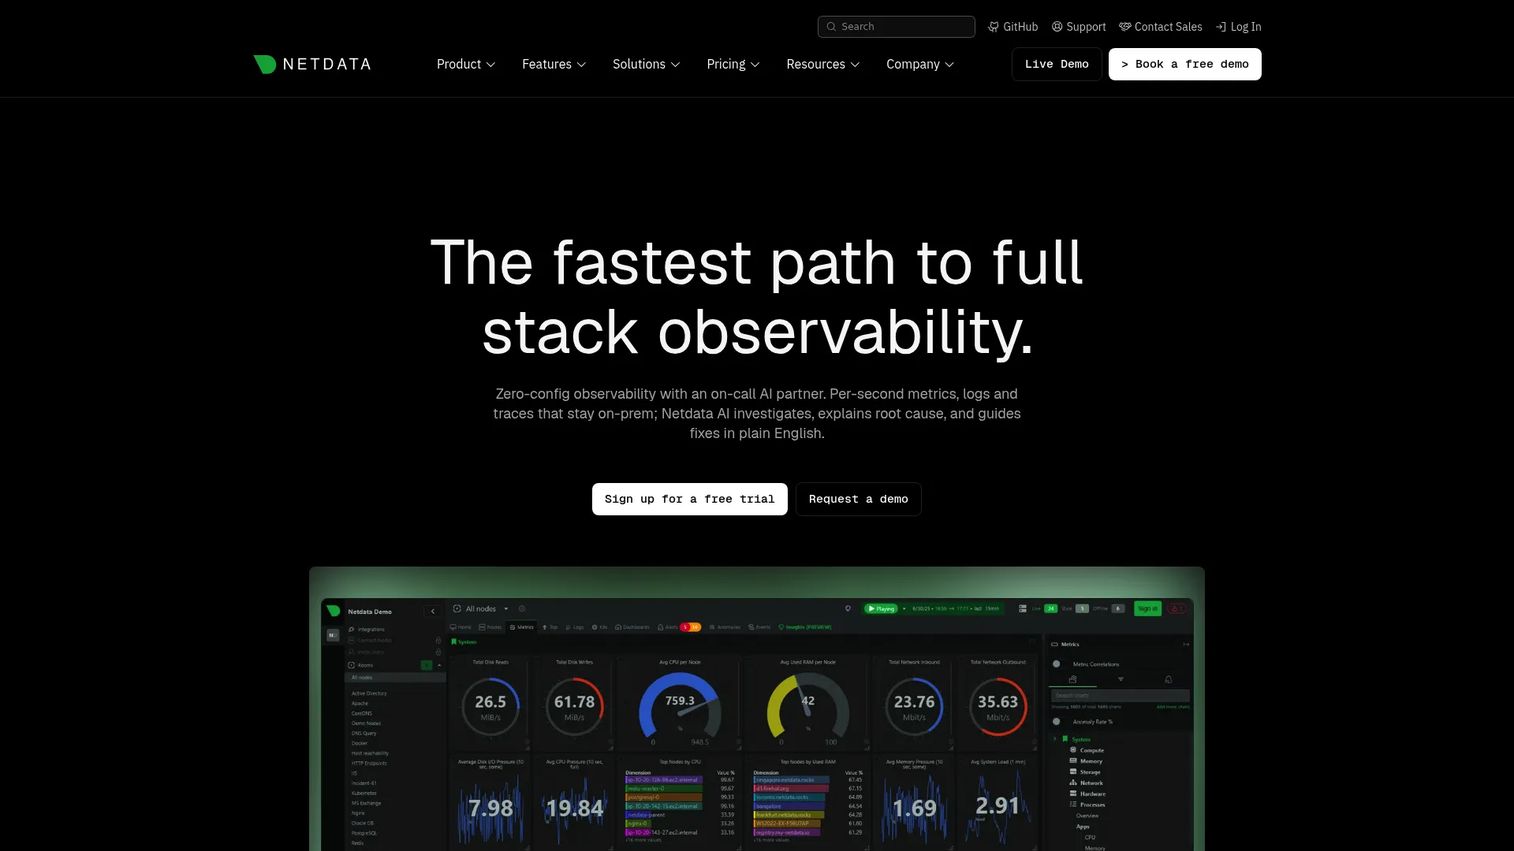
Netdata is a distributed, real-time observability platform that collects per-second metrics from infrastructure, networks, applications, and databases. Its agent-based architecture auto-detects services and databases on installation, minimizing setup time. Teams use it for fast operational visibility during performance regressions or after a deployment that changes database behavior unexpectedly.
Best for: Operations and infrastructure teams that need fast, real-time visibility with minimal dashboard configuration, particularly during active incident investigation.
Key features
- Per-second metrics collection with auto-detection of databases and services
- Anomaly detection and AI-assisted root cause analysis
- Network monitoring with SNMP, NetFlow, and BGP support
- Logs and OpenTelemetry distributed tracing
- MCP integration for AI workflow support
Why choose Netdata: Best for teams that want operational visibility within minutes of deployment without building dashboards from scratch. The free Community tier covers up to five nodes, making it accessible for smaller teams before committing to paid plans.
Netdata pricing: Free for up to five active connected nodes. Business plans start at $7 per node per month (billed annually) or $8.75 per node per month billed monthly. Enterprise uses custom pricing.
G2 rating: 4.6/5
16. Amazon CloudWatch
Amazon CloudWatch is AWS's native monitoring and observability service covering metrics, logs, traces, and operational data for AWS infrastructure and services. For database teams, it provides native monitoring for Amazon RDS, Aurora, DynamoDB, ElastiCache, and DocumentDB, with alarms, dashboards, Contributor Insights, and log analytics built in. For AWS-first teams, it removes the need for a separate database monitoring tool for cloud-managed databases.
Best for: AWS-centric teams running databases on managed AWS services who want database signals inside their existing AWS operations workflow.
Key features
- Native metrics for Amazon RDS, Aurora, DynamoDB, ElastiCache, and DocumentDB
- CloudWatch Alarms including high-resolution and composite alarms
- Log analytics and log-based metric generation
- Application, container, Lambda, and database insights
- Contributor Insights for identifying high-impact database traffic patterns
Why choose Amazon CloudWatch: Best for AWS-native teams where the entire database stack runs on managed AWS services. Teams running multi-cloud or hybrid databases, or those needing deep query-level diagnostics, typically need additional tooling alongside CloudWatch.
Amazon CloudWatch pricing: Pricing is usage-based. Live Tail monitoring starts at $0.01 per minute after 1,800 free minutes per month. A free tier covers basic metrics and alarms. Rates vary by feature and AWS region.
G2 rating: 4.3/5
17. Elastic Observability
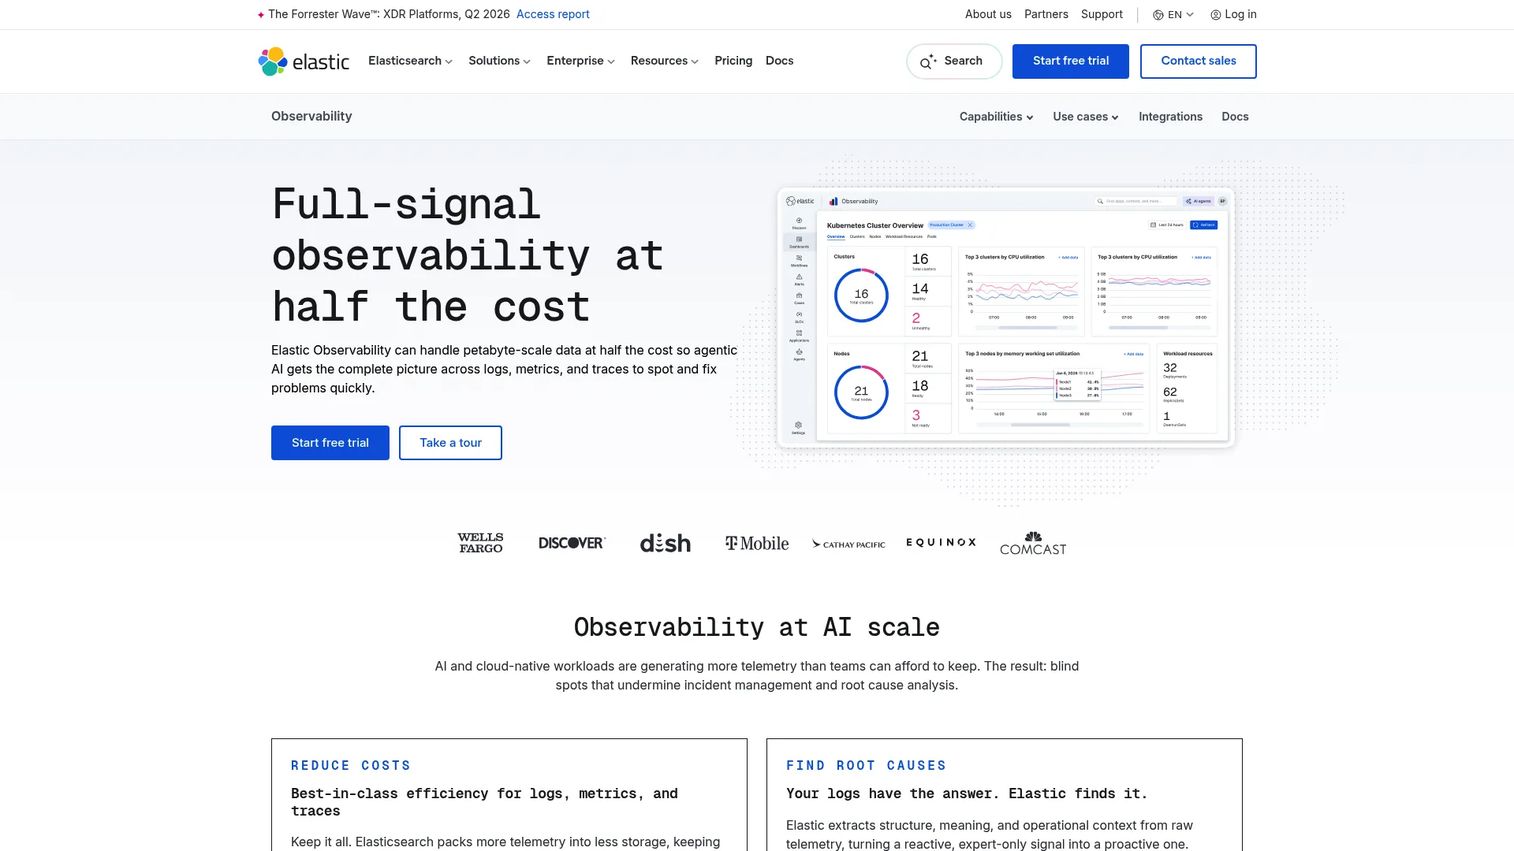
Elastic Observability is a full-stack observability platform built on search, covering logs, metrics, APM traces, infrastructure monitoring, digital experience monitoring, and LLM observability. Database visibility comes through integrations, agents, and ingested telemetry. Teams use it when investigating incidents that require searching and correlating logs alongside database performance signals.
Best for: Log-heavy engineering teams that need flexible search and correlation across database-adjacent telemetry, particularly when incident investigation spans logs, metrics, and traces together.
Key features
- Log analytics with search-based investigation
- Infrastructure monitoring and APM distributed tracing
- Digital experience monitoring
- OpenTelemetry and Prometheus support
- Alerting rules and integration library
Why choose Elastic Observability: Best when incident investigation depends on correlating log data with database signals. Teams whose primary diagnostic workflow starts with log search fit this tool better than teams focused on query-level database diagnostics.
Elastic Observability pricing: Serverless observability uses usage-based pricing. Logs Essentials starts as low as $0.07 per GB ingested. Observability Complete starts at $0.09 per GB ingested.
G2 rating: 4.3/5
18. Splunk Observability Cloud
Splunk Observability Cloud is an OpenTelemetry-native full-stack observability platform for metrics, traces, logs, and incident investigation. It includes a dedicated Database Monitoring component alongside infrastructure, APM, real user, and synthetic monitoring. Enterprise teams with existing Splunk investment find the platform familiar; it also suits organizations where reliability data must feed into formal incident reviews and leadership reporting.
Best for: Enterprise teams with existing Splunk investment or those needing observability tightly integrated with incident response workflows.
Key features
- OpenTelemetry-native data collection and 1,000+ integrations
- Application performance monitoring with full-fidelity tracing
- Database monitoring alongside infrastructure and real user monitoring
- Unified metrics, traces, and logs with dashboards and AI analytics
- Incident workflows and troubleshooting guidance
Why choose Splunk Observability Cloud: Best for organizations where reliability data feeds into formal incident reviews, compliance reporting, or leadership dashboards. Teams without existing Splunk investment may find the per-host pricing model and enterprise focus a higher initial commitment.
Splunk Observability Cloud pricing: Infrastructure plans start at $15 per host per month (billed annually). App and Infrastructure plans run $60 per host per month. End-to-End plans are $75 per host per month. A free trial is available.
G2 rating: 4.3/5
19. Oracle Enterprise Manager
Oracle Enterprise Manager is Oracle's on-premises management and monitoring platform for Oracle database, application, middleware, hardware, and engineered system environments. It provides performance diagnostics, lifecycle management, fleet management, change and configuration management, patching, provisioning, and automatic tuning for Oracle estates. For organizations running substantial Oracle infrastructure, it offers depth that general-purpose monitoring tools cannot match.
Best for: Organizations managing large Oracle database estates where Oracle-native administration, performance diagnostics, and lifecycle management are business-critical requirements.
Key features
- Oracle database monitoring and performance diagnostics
- Fleet management across Oracle database deployments
- Change and configuration management
- Patching, provisioning, testing, and automatic tuning
- Compliance reporting and enterprise monitoring
Why choose Oracle Enterprise Manager: Best for organizations that run Oracle heavily and need Oracle-native controls over performance, compliance, and lifecycle operations. Teams with mixed database stacks will need additional tooling for non-Oracle engines.
Oracle Enterprise Manager pricing: Oracle prices by request. Contact Oracle for current licensing and management pack requirements.
G2 rating: 4.3/5
20. IDERA SQL Diagnostic Manager
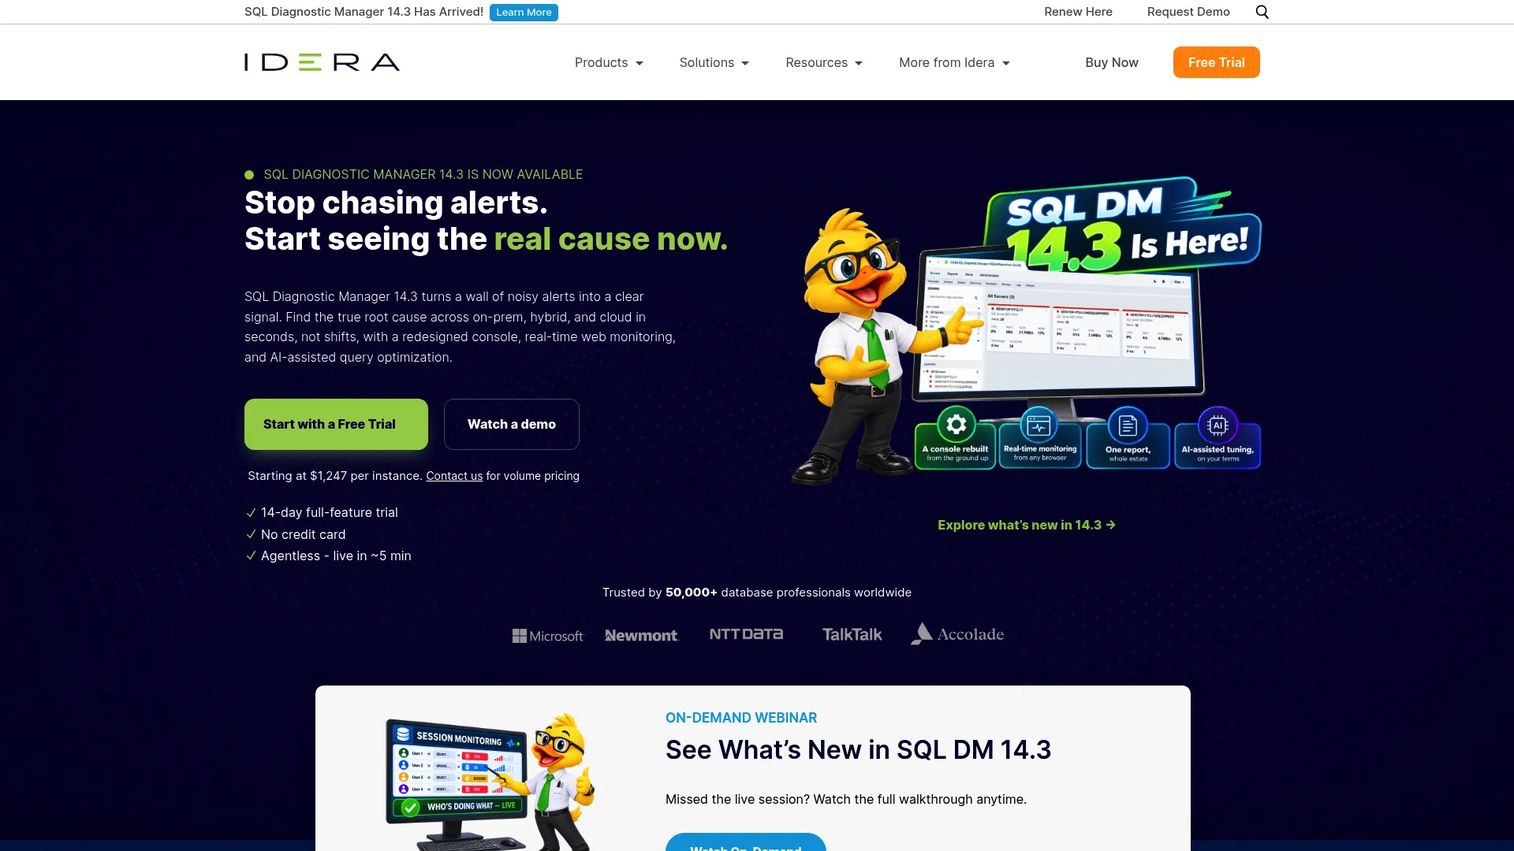
IDERA SQL Diagnostic Manager is a SQL Server performance monitoring and diagnostics tool for physical, virtual, and cloud SQL Server environments. It covers 24x7 performance monitoring, query and query-plan monitoring, deadlock capture, blocking detection, tempdb analysis, capacity planning, and prescriptive recommendations. AI-powered workload and index optimization is included, making it practical for DBAs managing performance issues at scale.
Best for: SQL Server DBA teams that need deep SQL diagnostics, wait statistics, deadlock alerts, and expert recommendations without adopting a broader observability platform.
Key features
- SQL Server performance monitoring with 24x7 alerting
- Query and query-plan monitoring for blocking and deadlocks
- Capacity planning and database growth analysis
- Prescriptive analysis with AI-powered index and workload optimization
- Browser-based console for distributed management
Why choose IDERA SQL Diagnostic Manager: Best for SQL Server-focused teams that need deep diagnostics and actionable recommendations. Its per-instance pricing and SQL Server specialization make it a natural fit for DBA teams rather than broad platform observability buyers.
IDERA SQL Diagnostic Manager pricing: SQL DM Standard costs $1,247 per instance per year (annual license). SQL DM Pro, which includes SQL Workload Analysis and SQL Query Tuner, runs $1,348 per instance per year. A 14-day free trial is available.
G2 rating: 4.1/5
21. DBA Dash
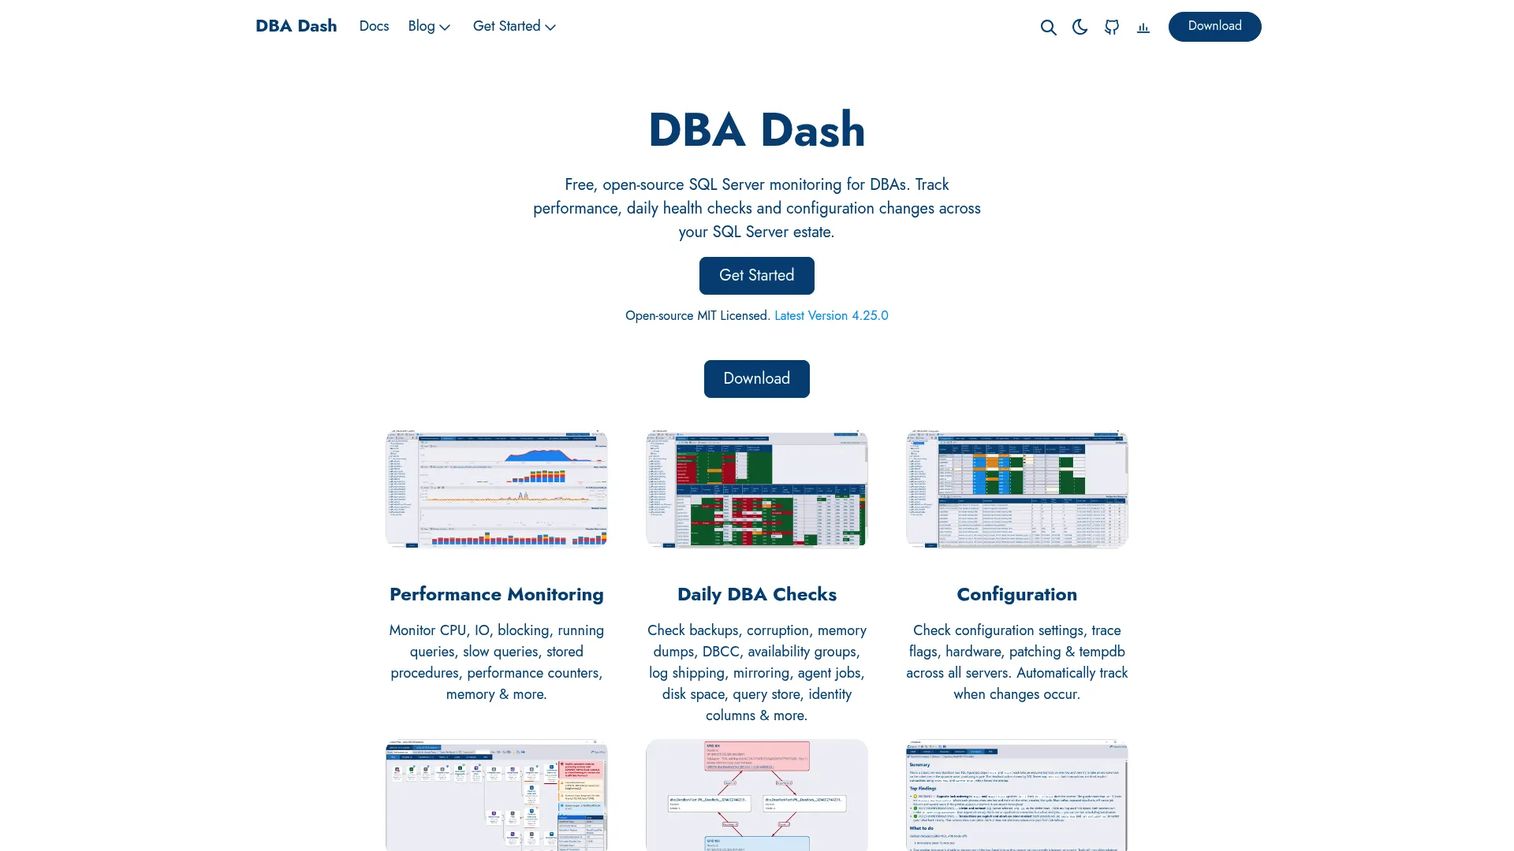
DBA Dash is a free, open-source, MIT-licensed SQL Server monitoring tool for DBAs who need self-hosted visibility without a commercial license. It covers CPU, I/O, blocking, queries, stored procedures, memory, performance counters, daily health checks for backups and availability groups, corruption detection, disk space, Query Store, configuration monitoring, trace flags, deadlock capture, and query plan analysis. Optional AI analysis and MCP server support are included.
Best for: SQL Server database administrators at smaller teams or cost-constrained organizations who want free, self-hosted monitoring before investing in a commercial tool.
Key features
- Performance monitoring for CPU, I/O, blocking, queries, and memory
- Daily DBA health checks for backups, jobs, availability groups, and disk space
- Configuration monitoring with hardware, patch, and tempdb tracking
- Query plan viewer and comparison with operator analysis
- Blocking and deadlock capture with optional AI analysis
Why choose DBA Dash: Best for SQL Server teams that want proven monitoring capability at zero license cost. Infrastructure hosting and DBA time for setup and maintenance are the practical costs to factor into the decision.
DBA Dash pricing: Completely free and open source with no feature or usage limitations. Costs are limited to hosting infrastructure and maintenance time.
Considerations when choosing database monitoring tools
Match the tool to your database engines
Start with engine coverage. A tool with excellent SQL Server depth may be the wrong pick for a team running PostgreSQL, MongoDB, and Redis. Verify that your primary engines are natively supported, not just reachable via generic connectors, before shortlisting.
Check query-level diagnostics, not just uptime
Uptime data tells you the database is running. It does not explain why onboarding times out or why a report query takes 40 seconds. Prioritize tools that expose slow query logs, execution plans, wait events, and lock contention. These signals are what connect database behavior to user-facing activation metrics and support ticket volume.
Understand deployment model and monitoring overhead
Agent-based, agentless, SaaS, self-hosted, and cloud-native tools carry different operational tradeoffs. Monitoring overhead on production databases is a real concern, especially for high-throughput systems. Test any tool in staging first, and configure sampling rates and collection intervals conservatively before enabling full production coverage.
Evaluate alert quality and incident routing
Poor alert configuration trains teams to ignore alerts. Look for tools that support baseline-based alerting, anomaly detection, and integration with your incident management workflow. A database alert that fires into a Slack channel with no routing or escalation policy adds noise, not signal.
Connect monitoring data to product decisions
For PMs, the value of database monitoring is not the dashboard itself. It is the ability to show engineering that query latency increased after a specific release, or that connection pool saturation explains the support ticket spike. Tools that preserve historical baselines and correlate database changes with deployment events make performance work defensible on the roadmap. Pairing database signals with big data analytics software or data visualization tools can help surface those connections for stakeholders.
Conclusion
The 21 tools in this guide map to four distinct buying situations.
For full-stack observability, Datadog, New Relic, and Dynatrace fit teams that want database signals inside the same system as services, infrastructure, and incident workflows. Elastic Observability and Splunk Observability Cloud serve teams where log-based investigation or formal incident review are the primary drivers.
For database-first performance tuning, SolarWinds Database Performance Analyzer, Redgate SQL Monitor, Quest Foglight, Oracle Enterprise Manager, IDERA SQL Diagnostic Manager, and DBA Dash serve teams that need deep database diagnostics without adopting a broader observability platform. The SQL Server-specific tools in that set cover the range from free self-hosted to enterprise commercial.
For open-source or self-hosted stacks, Prometheus, Zabbix, Checkmk, Icinga, Netdata, and Grafana Cloud give teams with engineering capacity a composable alternative to commercial licensing. Each requires more configuration investment than SaaS options, but reduces vendor dependency.
For cloud-native environments, Amazon CloudWatch handles AWS-managed databases natively, and Site24x7 gives MSP and cloud operations teams a SaaS-delivered option with broad coverage.
Your practical next step: Shortlist three tools, one that matches your database engines, one that fits your operating model, and one your engineering team can maintain without adding alert noise.
FAQs
Database monitoring tools are software systems that track the health, availability, performance, and activity of databases in real time. They collect metrics including query latency, CPU and memory usage, I/O throughput, deadlocks, lock waits, replication lag, and slow queries, then alert teams when behavior deviates from normal baselines.
Database monitoring tracks known metrics and fires alerts when thresholds are crossed. Database observability goes further by connecting metrics, logs, traces, and service dependencies so teams can investigate failure modes they did not anticipate. Tools like Datadog, Dynatrace, and New Relic offer both; dedicated database tools like SolarWinds or IDERA focus primarily on monitoring.
No single tool wins across every SQL Server environment. Redgate SQL Monitor suits DBA teams that need estate-wide visibility and hybrid coverage. SolarWinds Database Performance Analyzer excels at wait-time analysis and query tuning. IDERA SQL Diagnostic Manager provides deep SQL diagnostics with AI-powered recommendations. DBA Dash handles smaller teams at no license cost. Evaluate each against your environment size, budget, and self-hosting capacity.
Prometheus is the most widely used open-source option for cloud-native and Kubernetes environments, typically paired with Grafana for dashboards. Zabbix and Checkmk offer broader infrastructure monitoring with database templates. Icinga suits teams that need a configurable alerting framework. Netdata gives fast per-second visibility with minimal configuration. DBA Dash is the standout free option for SQL Server specifically.
PMs should focus on metrics that directly affect users: Query latency on critical workflows, failed transaction rates, lock wait times that delay page loads, connection pool saturation that causes timeouts, and replication lag that creates stale data. These signals connect directly to activation rate, time to first value, early retention, and support ticket volume. If a workflow step consistently generates lock waits after a release, that is a prioritization data point, not just an engineering concern.
Overhead depends on collection method, query frequency, sampling configuration, agent behavior, and the monitoring tool's design. Agent-based tools with high-frequency collection add more overhead than agentless or pull-based approaches. Test any tool in a staging environment before enabling it on production, monitor the monitoring agent's own resource consumption during rollout, and start with conservative collection intervals.
Cloud-native tools like Amazon CloudWatch are sufficient for teams running primarily on managed AWS database services with straightforward monitoring needs. Multi-cloud environments, hybrid on-premises deployments, and query-intensive systems typically need deeper diagnostics or observability correlation that cloud-native tools alone do not cover. The gap shows up most clearly in query plan analysis and cross-service trace correlation.
Start with database engine coverage: Confirm the tool natively supports your primary engines. Then evaluate query-level diagnostics, alert quality, historical retention, and deployment model. Add team maintenance capacity as a decision factor, especially for open-source options. Finally, test against a real incident scenario, whether a slow query event or a connection saturation episode, before committing to a purchase. The best product analytics tools and business intelligence platforms in your stack may also inform which monitoring integrations matter most.
Data monitoring broadly covers data quality, data pipeline health, and data integrity across storage systems and ETL processes. Database monitoring focuses specifically on operational health, performance, and availability of database instances. This guide covers the operational monitoring category: Query performance, wait events, availability, and resource saturation for running database systems.