

Everyone wants a dashboard. Nobody wants to maintain five charting systems after two sprints of "quick chart" work turns into a customer-facing feature users depend on.
The data visualization tools market hit $11.8 billion in 2025, according to Grand View Research, and 24% of organizations plan to triple employee use of advanced analytics within the next 12 months, per the Strategy State of AI+BI Analytics Global 2025 Report. That growth puts real pressure on library decisions. The choice you make now affects release cadence, accessibility, design-system fit, and how much engineering time future instrumentation changes will cost.
A wrong pick at the prototype stage compounds fast. You end up maintaining a bespoke rendering stack nobody on the current team chose, or refactoring a customer-facing analytics page on a sprint where the team had other priorities.
This guide cuts through the noise. Twelve libraries, evaluated by use case, language ecosystem, maintenance burden, and PM-relevant trade-offs, so you can align with engineering and data teams before anyone writes a line of chart code.
What's inside
This guide compares 12 data visualization libraries covering JavaScript, Python, R, and geospatial workflows. Items were selected based on:
- Use case fit: Customer-facing dashboards, internal analytics, notebook exploration, and geographic analysis
- Language ecosystem: JavaScript frameworks, Python scientific stack, R statistical workflows
- Interactivity depth: Hover states, filtering, drilldown, brushing, and reactive layouts
- Maintenance signal: Documentation quality, community activity, and release cadence
The guide is written for PMs working with engineering and data teams who need to choose what to ship, not collect every available library.
TL;DR
- Best for custom web visualization: D3.js gives engineering teams maximum control over every visual and interaction
- Best for interactive analytics in Python-heavy teams: Plotly covers notebooks, dashboards, and production apps across languages
- Best lightweight option for product dashboards: Chart.js ships common chart types with minimal configuration
- Best for broad dashboard requirements: Apache ECharts handles 20-plus chart types with built-in interactivity
- Best for statistical work in R: ggplot2 is the standard for composable, publication-quality analysis charts
- Best for geospatial analysis: QGIS covers desktop GIS workflows without per-seat licensing costs
What is a data visualization library?
A data visualization library is a software package that turns structured data into charts, maps, dashboards, diagrams, or interactive visual interfaces inside code, notebooks, applications, or reports.
For PMs, the distinction between library types matters before choosing one. Reaching for the wrong category adds engineering overhead that compounds across every future metrics iteration.
Libraries are code-first packages you embed in an app or notebook. Examples include D3.js, Chart.js, matplotlib, and ggplot2. They require developers to write code, but they fit neatly into existing build pipelines and design systems.
Frameworks like Shiny go further, letting data scientists build full reactive applications without a dedicated frontend team.
Desktop tools like QGIS solve geospatial problems at a level of depth that charting libraries do not reach.
BI platforms sit above all of these. They are broader reporting systems with permissions, connectors, and drag-and-drop interfaces. This list does not cover them, but see the big data analytics software guide for that category.
Key capabilities to evaluate across any library in this list:
- Chart primitives: Bars, lines, scatterplots, heatmaps, and specialized chart types
- Interactivity: Hover, zoom, filtering, brushing, and drilldown
- Rendering: SVG, Canvas, WebGL, or HTML output
- Data transformations: Binning, aggregation, scales, and projections
- Export and embedding: PNG, SVG, PDF, and web component integration
- Accessibility: Labels, keyboard navigation, and color contrast
- Maintenance signals: Documentation, release cadence, and community
The library choice affects how quickly your team ships dashboards, how maintainable those dashboards are after the first iteration, and how clearly users can understand and act on the data inside them.
When to use data visualization libraries
Build customer-facing analytics
Customer-facing dashboards require design-system alignment, performance, and predictable maintenance. When users rely on a usage dashboard, account health view, or feature adoption report as part of their daily workflow, the chart library becomes a product surface. Libraries like D3.js, Chart.js, Apache ECharts, and Recharts work here, each with different trade-offs around control versus configuration speed.
Explore data before productizing it
Python and R libraries are often the right choice for discovery, prototype notebooks, and internal analysis. Use matplotlib, seaborn, or ggplot2 to validate the right metric, segmentation, or chart type before asking engineering to build a production-native experience. The opportunity cost of shipping the wrong chart to users is higher than the cost of an extra exploration sprint.
Communicate complex relationships
Maps, networks, and multi-series views need specialized libraries. D3.js handles geographic projections. QGIS covers desktop spatial analysis for location-heavy products. Force a territory map into a bar chart and the information doesn't reach the decision-maker who needs it.
Data visualization libraries comparison
The table below covers all 12 libraries in this guide. Pricing reflects open-source or free status where verified. G2 ratings come from live listings where available; N/A indicates no current listing.
| # | Product | Best for | Key differentiator | Pricing | G2 rating |
|---|---|---|---|---|---|
| 1 | D3.js | Custom web visualization | Low-level DOM, SVG, and Canvas control | Free, open source | 4.2/5 |
| 2 | Plotly | Interactive analytics across languages | Cross-language charts plus Dash app framework | Free; Pro from $29/seat/month | 4.8/5 |
| 3 | Chart.js | Lightweight product dashboards | Fast Canvas setup for common chart types | Free, open source | 4.4/5 |
| 4 | Apache ECharts | Rich web dashboards | 20-plus chart types with built-in interactivity | Free, open source | N/A |
| 5 | Observable Plot | Exploratory JavaScript charts | Concise mark-based grammar over D3 | Free (library); Observable plans from $22/month | 4.4/5 |
| 6 | Vega-Lite | Declarative visualization specs | JSON grammar for reproducible charts | Free, open source | N/A |
| 7 | Recharts | React product interfaces | Composable React chart components | Free, open source | N/A |
| 8 | matplotlib | Python plotting foundation | Broad customization for scientific and static plots | Free, open source | N/A |
| 9 | seaborn | Statistical Python exploration | Higher-level statistical visuals over matplotlib | Free, open source | N/A |
| 10 | ggplot2 | R statistical visualization | Grammar of graphics for analysis workflows | Free, open source | N/A |
| 11 | Shiny | Interactive data apps in R and Python | Reactive dashboards without a frontend build | Free (framework); hosting from $0/month | 5.0/5 |
| 12 | QGIS | Geospatial visualization | Desktop GIS with spatial analysis and no per-seat cost | Free, open source | N/A |
Best 12 data visualization libraries for 2026
1. D3.js
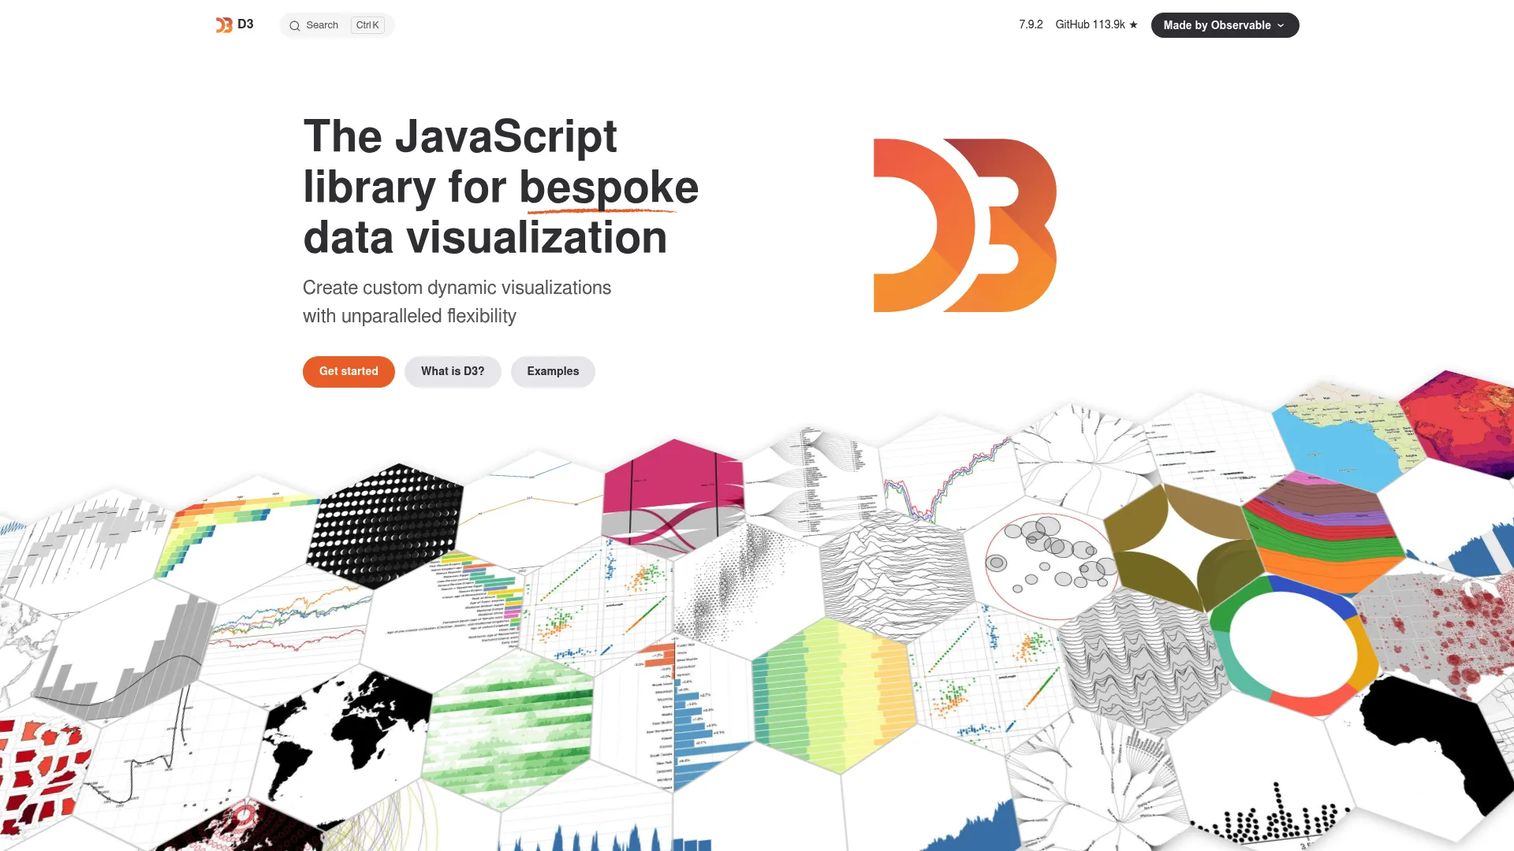
D3.js is a free, open-source JavaScript library for creating bespoke, dynamic data visualizations. It manipulates the DOM directly using data joins, giving engineering teams fine-grained control over every SVG element, transition, and interaction. D3 is the foundation that many higher-level libraries build on.
Best for: Engineering teams building complex, interactive visuals that must match a custom design system.
Key features
- Data-driven DOM selection and binding
- SVG, Canvas, and HTML rendering modes
- Scales, axes, shapes, and geometric layouts
- Transitions and interaction behaviors (panning, zooming, brushing, dragging)
- Geographic projections and mapping support
Why choose D3.js: Choose D3 when the visualization is core to the product experience and the team needs control over every interaction and visual encoding. The learning curve is real and should be planned into engineering estimates. It is not the right pick for teams that need a dashboard in a sprint.
D3.js pricing: D3 is free and open source with no paid tiers. The library ships under an ISC license.
G2 rating: 4.2/5 based on 19 reviews.
2. Plotly
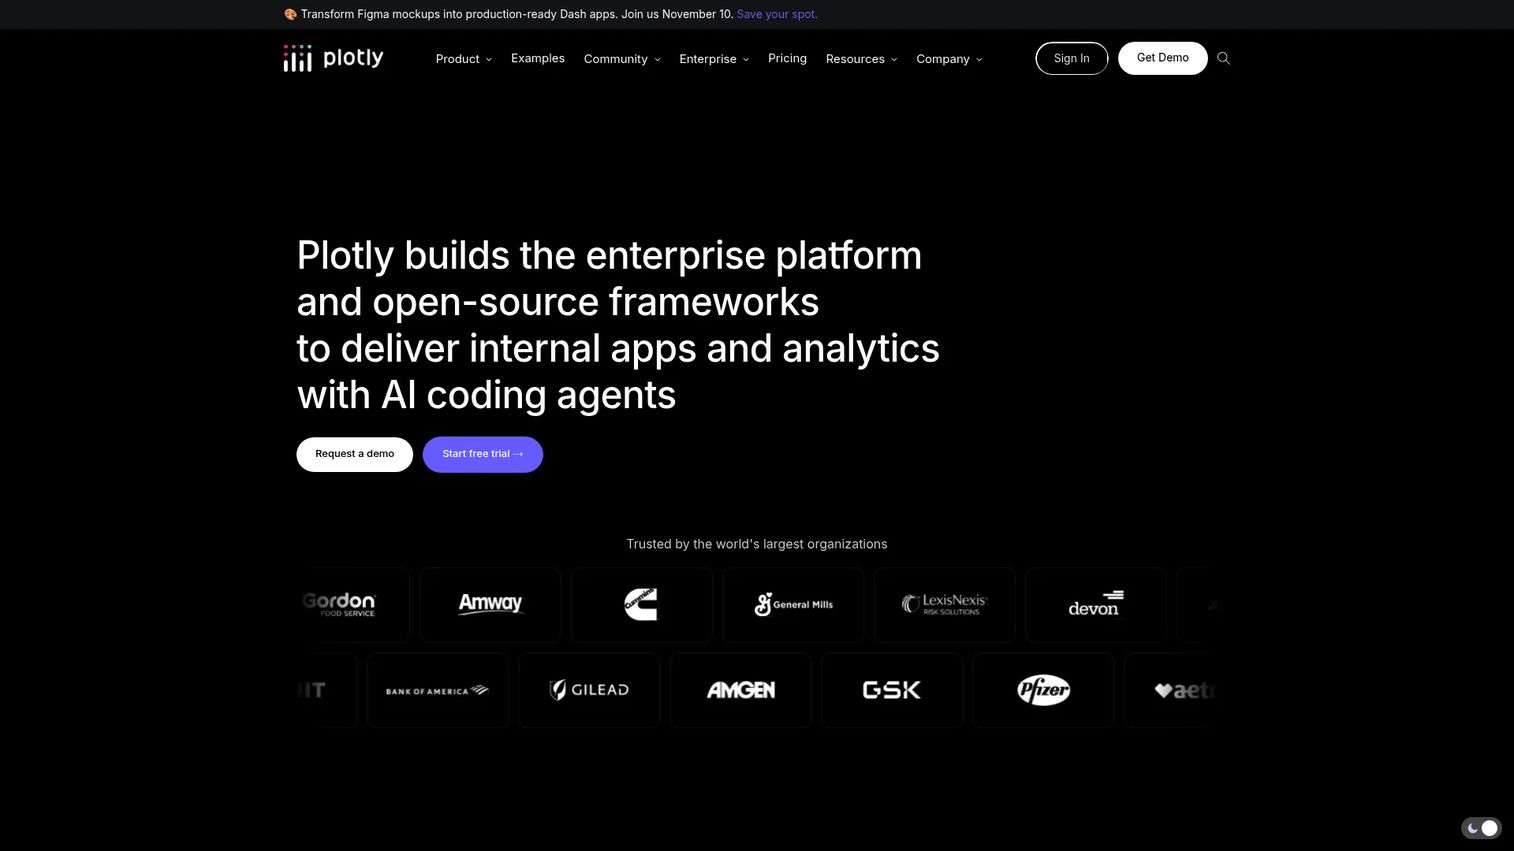
Plotly provides open-source graphing libraries and commercial tools for building interactive data visualizations across Python, R, and JavaScript. Its Dash framework turns those charts into full production analytics applications. For teams where data science and product share a visualization layer, Plotly reduces the instrumentation gap between notebook and deployed dashboard. See also the guide to best interactive demo tools for product marketing for related product experience tooling.
Best for: Data science and engineering teams that need interactive charts in notebooks, analytics apps, or internal dashboards without switching languages.
Key features
- Interactive charts across 70-plus chart types by default
- Python, R, and JavaScript graphing libraries with WebGL and SVG rendering
- Dash application development and deployment
- Plotly Studio for AI-assisted data analysis and app generation
- Cloud publishing and collaboration
Why choose Plotly: Choose Plotly when data science and product teams need a shared visualization layer. It can be more than necessary for basic static charts. Its strength shows when the team iterates on analytics apps rather than individual chart components.
Plotly pricing: The open-source library is free. Plotly's commercial plans start at $29 per Creator seat per month (billed monthly), with a Free tier covering one Creator seat and three private viewers. Enterprise pricing is custom.
G2 rating: 4.8/5 (Plotly Dash Enterprise).
3. Chart.js
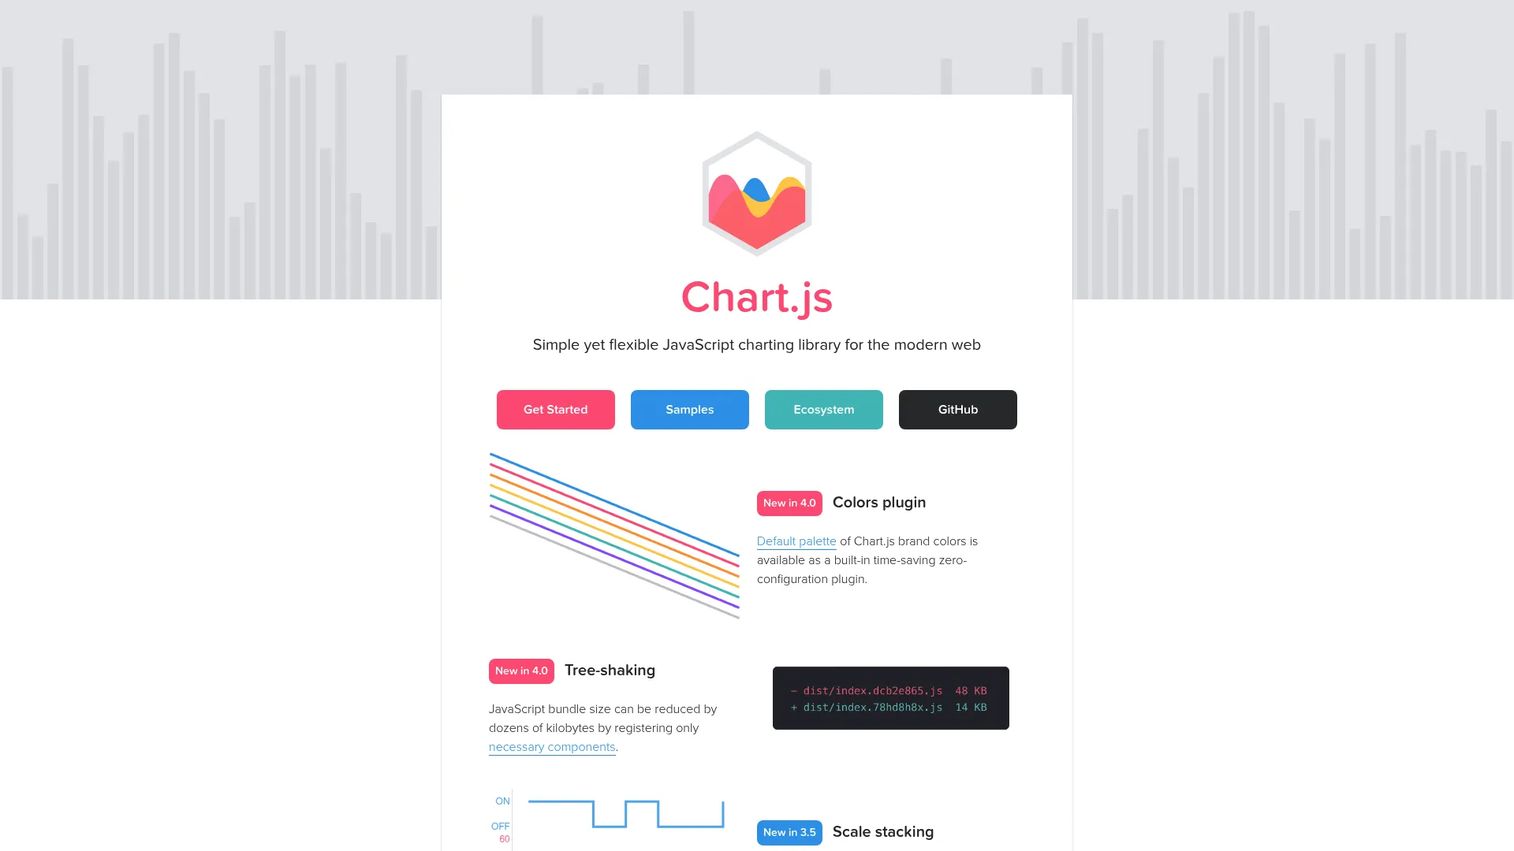
Chart.js is a simple, flexible, open-source JavaScript charting library for the modern web. It renders charts via HTML5 Canvas and ships with TypeScript typings out of the box. When your dashboard requirements are clear and conventional, Chart.js gets you to a working product faster than lower-level libraries.
Best for: Developers who need line, bar, scatter, and pie charts embedded in web applications without custom visualization engineering.
Key features
- Multiple built-in chart types including bar, line, radar, doughnut, and bubble
- HTML5 Canvas rendering with responsive behavior
- Animations, tooltips, legends, and an extensible plugin API
- TypeScript typings and compatibility with React, Vue, and Angular
- Tree-shaking support for smaller bundles
Why choose Chart.js: Choose Chart.js when dashboard needs are clear and conventional. If users need highly bespoke interactions or custom geometric layouts, a lower-level library like D3 fits better. For activation funnels, feature adoption charts, and account health views with standard chart types, Chart.js keeps engineering time predictable.
Chart.js pricing: Free and open source under the MIT license.
G2 rating: 4.4/5 based on 123 reviews.
4. Apache ECharts
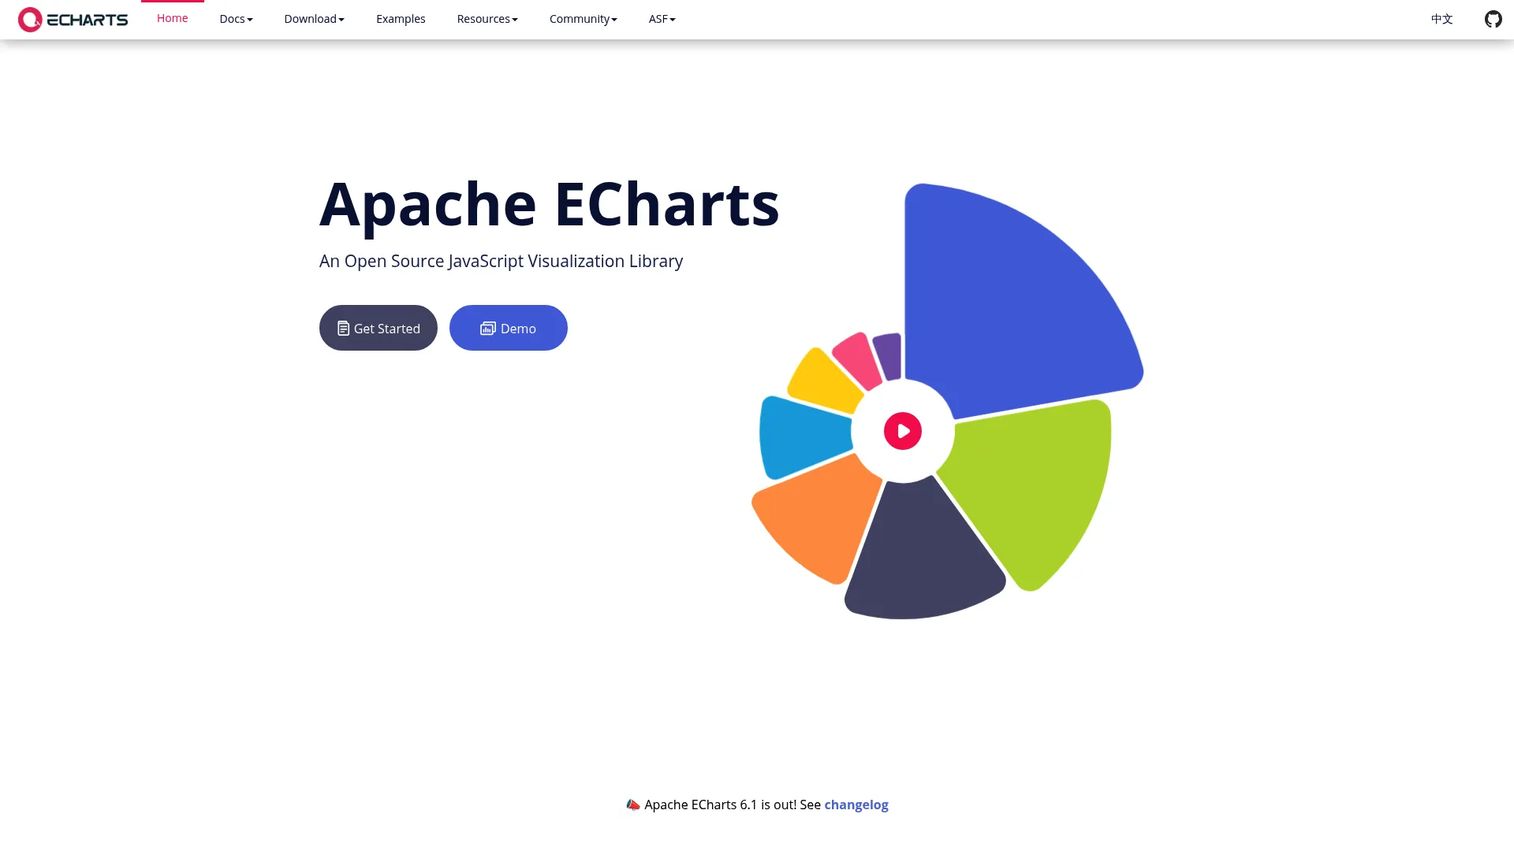
Apache ECharts is an open-source JavaScript visualization library for building interactive web-based charts. It ships with more than 20 chart types, supports both Canvas and SVG rendering, and includes dataset-based transforms for filtering and aggregation without writing custom data pipelines. Teams dealing with broad dashboard requirements and varied visual formats often find ECharts covers more ground than Chart.js without the overhead of D3. For related big data software tooling, see that category guide.
Best for: Developers building dashboards with varied visual requirements and built-in interactivity across a broad chart catalog.
Key features
- More than 20 chart types including geographic and 3D charts
- Canvas and SVG rendering with progressive rendering for large datasets
- Dataset-based transforms including filtering, clustering, and regression
- Responsive PC and mobile support with server-side rendering
- Apache License 2.0
Why choose Apache ECharts: Choose ECharts when dashboard requirements are broad but the team doesn't want to build every interaction from scratch. Check bundle size, verify accessibility expectations against your design system, and confirm the chart types you need are covered before committing.
Apache ECharts pricing: Free and open source under the Apache License 2.0.
5. Observable Plot
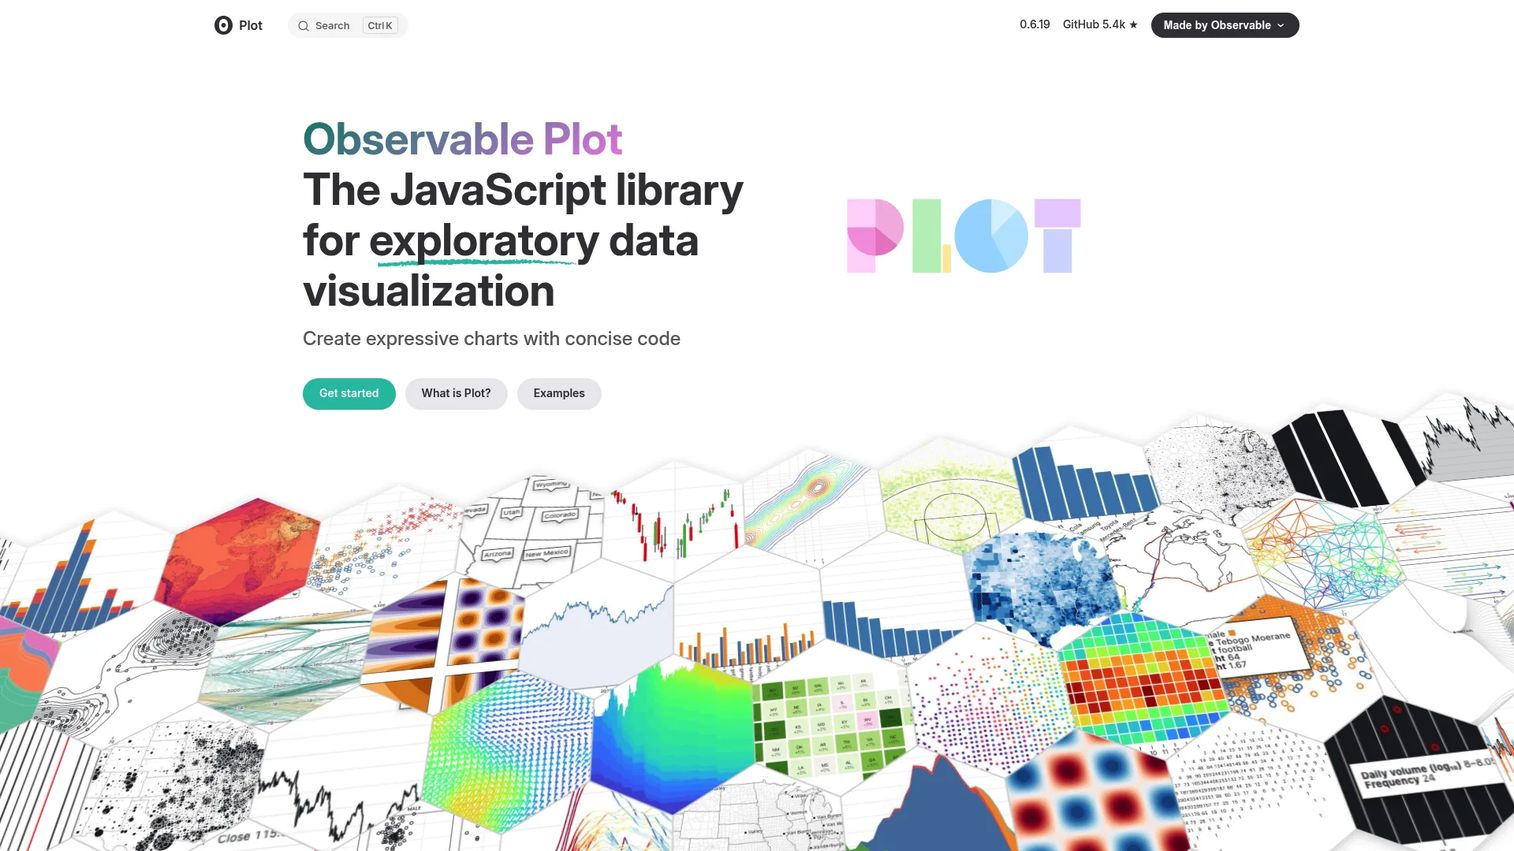
Observable Plot is a JavaScript library for exploratory data visualization built on the D3 ecosystem. Where D3 gives you primitives, Observable Plot gives you a concise mark-based grammar that produces layered charts with less boilerplate. It fits well for data stories, rapid prototypes, and exploration work before productization.
Best for: Developers and data analysts creating concise, expressive exploratory visualizations from tabular data, particularly in Observable notebooks.
Key features
- Layered geometric marks (bars, dots, lines, areas)
- Scales, axes, legends, and geographic projections
- Transforms for binning, grouping, stacking, and window calculations
- Facets for small-multiple visualizations
- GeoJSON and D3 spherical projection support
Why choose Observable Plot: Choose Observable Plot when you want D3 power with significantly less boilerplate for exploratory work. It is not a full dashboard framework on its own. Teams prototyping a chart before engineering builds a production component will find the iteration speed useful.
Observable Plot pricing: The library is free and open source. Observable platform plans (for collaborative notebooks) start at $22 per month on the Pro tier, billed annually, or $25 billed monthly.
G2 rating: 4.4/5 (Observable platform).
6. Vega-Lite
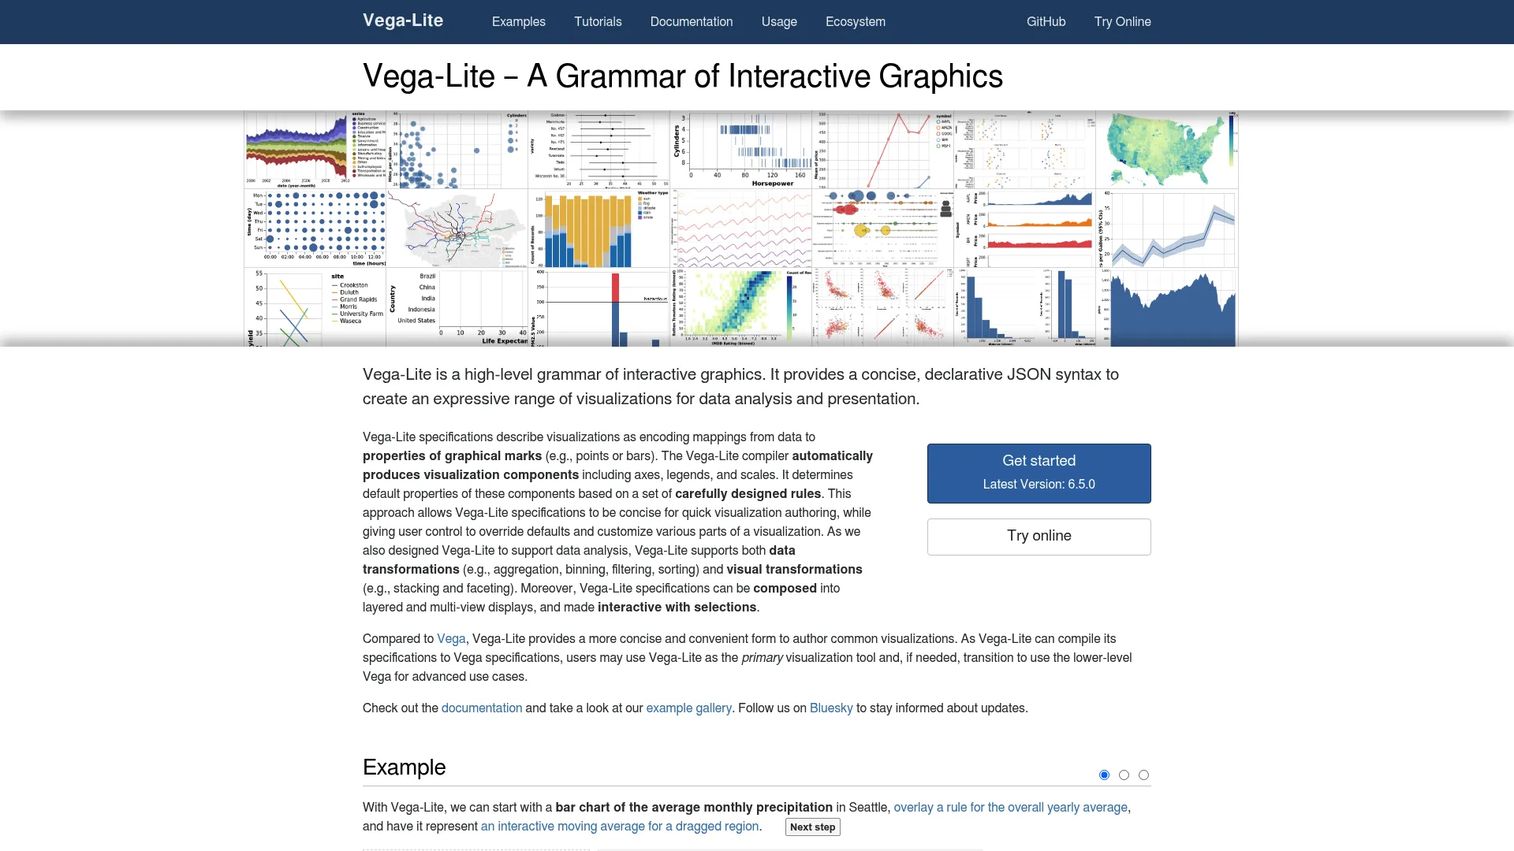
Vega-Lite is a high-level grammar for creating interactive data visualizations using concise, declarative JSON specifications. Rather than writing imperative chart code, you describe what the chart should look like. Vega-Lite compiles those specifications to full Vega for rendering. For teams that value reproducibility across reports and generated views, the JSON spec model keeps charts consistent without manual coordination.
Best for: Developers, analysts, and data teams building reproducible visualizations where chart definitions can be version-controlled and shared as portable specs.
Key features
- Declarative JSON visualization specifications
- Automatic axes, legends, and scale generation
- Data transformations including aggregation, binning, filtering, and sorting
- Layered and multi-view composition
- Interactive selections and parameter-driven visualizations
Why choose Vega-Lite: Choose Vega-Lite when consistency and reproducibility across reports or generated views matter more than pixel-level control. Developers must be comfortable with declarative configuration. Teams used to imperative charting code will find the mental model shift meaningful.
Vega-Lite pricing: Free and open source. No paid tiers were found on the official project pages.
7. Recharts
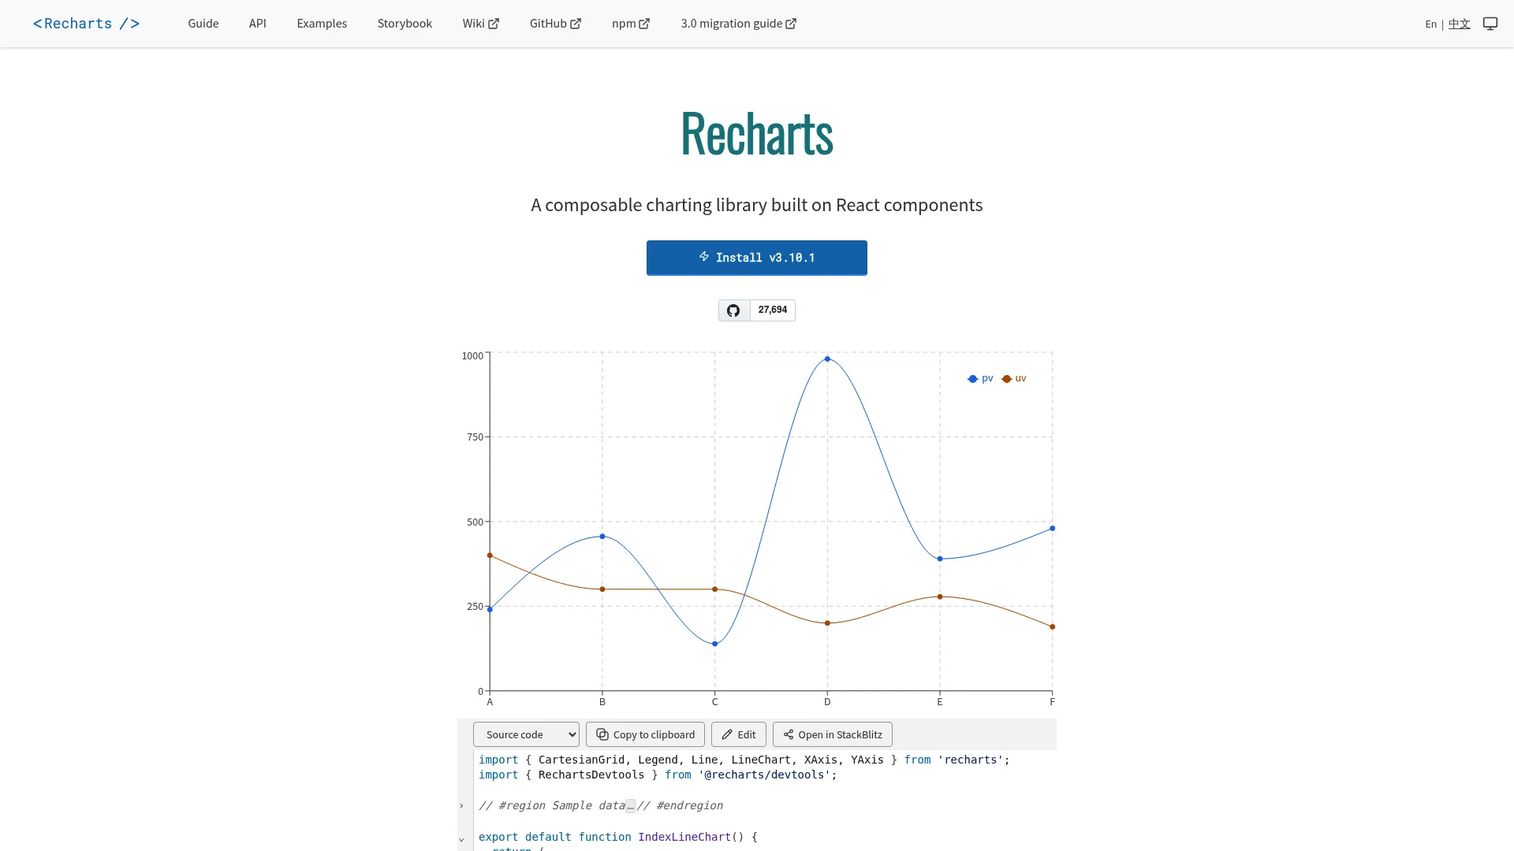
Recharts is a composable charting library built on React components and SVG. It uses lightweight D3 submodule dependencies for math, keeping bundle size manageable while providing familiar React component patterns. When charts must live inside a React application and match the product's existing component architecture, Recharts keeps the integration clean.
Best for: React developers integrating customizable data visualizations into product applications without adopting a new rendering model.
Key features
- Composable, reusable React chart components
- SVG-based rendering with lightweight D3 submodule dependencies
- Customizable charts through component props and custom component injection
- Responsive containers and tooltip components
- MIT license
Why choose Recharts: Choose Recharts when frontend teams want familiar React patterns for standard dashboards. It fits activation charts, usage graphs, and account reporting well. For highly custom geometric layouts or interaction research, D3 gives more control.
Recharts pricing: Free and open source under the MIT license.
8. matplotlib
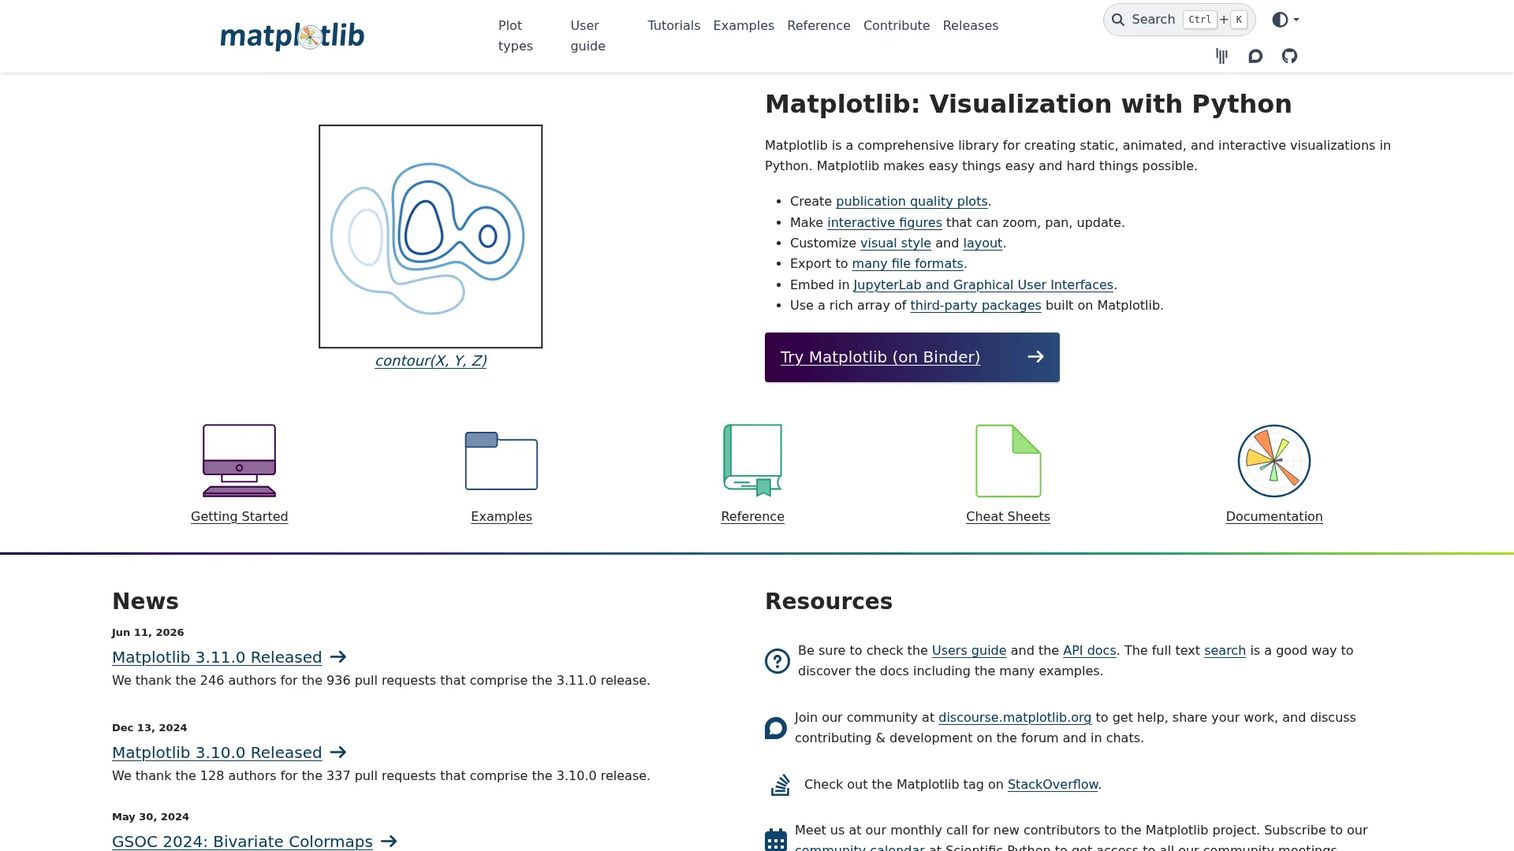
matplotlib is the foundational Python plotting library. It produces static, animated, and interactive visualizations and integrates with the Python scientific stack including NumPy, pandas, and SciPy. Most Python data scientists encounter matplotlib before any other charting tool, which means your analytics team already knows it.
Best for: Python users who need customizable scientific, analytical, or publication-quality charts, particularly for analysis artifacts and reports.
Key features
- Static, animated, and interactive figures
- Extensive chart customization and layout control
- Export to PNG, SVG, PDF, and other formats
- Embedding in JupyterLab and GUI applications
- Broad community support and integration with the Python scientific stack
Why choose matplotlib: Choose matplotlib when the team needs reliable Python plotting with broad compatibility across the scientific stack. It can feel verbose for quick statistical visuals. When that becomes a friction point, seaborn layers over it cleanly without requiring a full switch.
matplotlib pricing: Free and open source.
9. seaborn
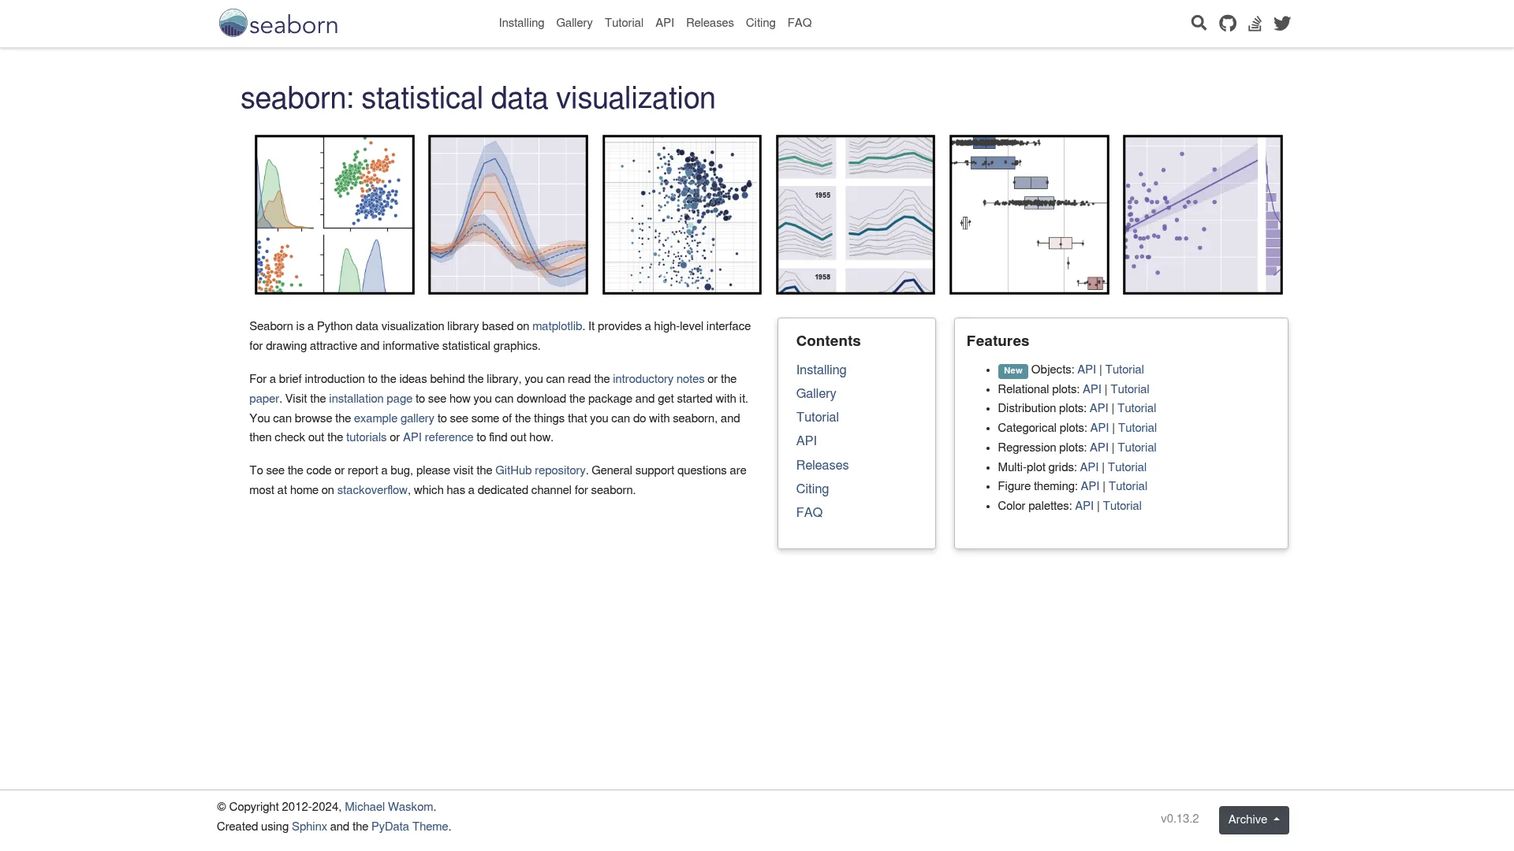
seaborn is a Python data visualization library built on matplotlib for creating statistical graphics with cleaner defaults and less code. It integrates directly with pandas DataFrames, which makes it fast to go from a data query to a chart. For PMs running activation funnel breakdowns or cohort retention explorations with a data partner, seaborn shortens the cycle between question and answer.
Best for: Python users who need statistical exploration with cleaner defaults than raw matplotlib, especially alongside pandas workflows.
Key features
- Relational, distribution, categorical, regression, and matrix plots
- Multi-plot grids and faceted visualizations
- Tight pandas DataFrame integration
- Figure theming and customizable color palettes
- Built on matplotlib for compatibility
Why choose seaborn: Choose seaborn for fast statistical exploration and analysis before designing a production dashboard. It is an analysis library rather than a product UI charting layer. When the question is "what is happening in activation?" seaborn gets an answer faster than building a React chart component.
seaborn pricing: Free and open source, installable via pip or conda.
10. ggplot2
ggplot2 is an R package for declaratively creating data visualizations based on the grammar of graphics. You build charts by adding layers: Data, aesthetic mappings, geometric marks, scales, and facets. For R-based analytics workflows, ggplot2 is the standard. When your data or analytics team works in R and needs clear, defensible visuals for stakeholder reviews, ggplot2 produces publication-quality output with less code than most alternatives. For related tools, see the best statistical analysis software guide.
Best for: R users who need composable, highly customizable statistical data visualizations for analysis and research workflows.
Key features
- Composable graphics built from data, aesthetic mappings, layers, scales, and themes
- Geometric layers for points, lines, bars, histograms, boxplots, and maps
- Faceting for small-multiple comparisons
- Statistical transformations and annotation support
- Chart export via ggsave()
Why choose ggplot2: Choose ggplot2 when the analytics workflow lives in R. It is not the right choice for embedded JavaScript product dashboards. For cross-language teams where JavaScript output is required, Plotly covers R as well.
ggplot2 pricing: Free and open source, available from CRAN.
11. Shiny
Shiny is a framework for building interactive web applications for data science using R or Python. It uses a reactive programming model where inputs automatically update outputs. Data scientists can deliver usable internal analytics tools without waiting on a frontend engineering sprint, making Shiny practical for internal dashboards, prototypes, and tools where speed matters more than design-system alignment. For related tooling in this space, the big data integration tools guide covers adjacent categories.
Best for: Data scientists and analysts building interactive internal dashboards and data apps in R or Python without a full custom frontend build.
Key features
- Reactive interactive applications with automatic output updates
- Pre-built input and output UI components
- Interactive visualizations and dashboard layouts
- Responsive theming and layout options
- Deployment to self-managed servers or Posit hosting (shinyapps.io)
Why choose Shiny: Choose Shiny when analysts need to deliver interactive tools quickly without engineering involvement. Productionization still requires governance decisions: Hosting plan, security review, ownership, and maintenance. Those decisions should happen before the app goes to external users.
Shiny pricing: The framework itself is free and open source. Hosting via shinyapps.io starts at $0 per month on a Free tier. Paid hosting plans run $13 per month (Starter), $49 per month (Basic), $119 per month (Standard), or $349 per month (Professional), billed monthly or annually.
G2 rating: 5.0/5 based on 1 review.
12. QGIS
QGIS is free and open-source geographic information system software for spatial visualization, mapping, data management, analysis, and publishing. It is a desktop GIS environment, not a lightweight web charting library. For teams building location-heavy products, territory logic, logistics dashboards, or field operations views, QGIS provides depth of spatial analysis that charting libraries do not cover. See the 3D visualization software guide for related spatial tools.
Best for: Organizations, researchers, and product teams needing comprehensive GIS mapping and spatial analysis without per-seat licensing costs.
Key features
- Create and compose maps from vector, raster, mesh, and database data
- Layer-based map editing and management
- Spatial analysis and geoprocessing tools
- Map publishing through web services and QGIS Server
- Plugin ecosystem and Python/C++ extension support
Why choose QGIS: Choose QGIS when the core problem is geographic rather than chart-based. It is a desktop application, so the workflow differs significantly from embedding a chart in a web app. Teams that need territory analysis, location intelligence, or geospatial discovery before building a custom map layer will get more from QGIS than from forcing geographic logic into a JavaScript charting library.
Considerations when choosing data visualization libraries
Match the library to the product surface
A notebook chart, an internal dashboard, a customer-facing analytics page, and a geospatial workflow each have different requirements. Write down the product surface before choosing a library. A library that fits a data science notebook often needs significant rework to meet the design and performance requirements of a customer-facing feature.
Check engineering ownership and release cadence
Ask who will maintain the charts after the first version ships. If segments, metrics, or UI components change every sprint, the library needs clear documentation and predictable update patterns. Libraries with strong community maintenance (D3, Chart.js, matplotlib) reduce the risk that a future release breaks your production charts.
Evaluate interactivity before chart count
More chart types do not help if users need filtering, drilldown, comparison modes, or hover detail. Define what users must do with the visualization, not just what they must see. Interactivity requirements often separate a suitable library from one that looks right in a demo but needs workarounds in production. For more context on best data visualization tools broadly, that guide covers the category.
Verify accessibility and design-system fit
Require color contrast, readable labels, responsive layouts, and keyboard navigation where relevant. A chart that breaks accessibility creates support risk and compliance exposure. Run the library's output through your design system and accessibility criteria before committing to production.
Treat licensing and hosting as product decisions
Open source does not mean zero cost. Consider license obligations, cloud hosting fees (Shiny, Observable), security review overhead, and long-term maintenance. For big data analytics software decisions at a larger scale, those cost factors compound significantly.
Conclusion
The right library is the one your team can ship, explain, and maintain after the first dashboard request becomes ten.
For custom web visualization where control matters, D3.js is the strongest foundation. Plotly covers the cross-language case where data science and engineering need a shared layer from notebook to production. Chart.js and Recharts solve the product dashboard problem efficiently for teams already in JavaScript or React. Apache ECharts handles broad chart catalogs without requiring custom interaction code. For statistical work in R, ggplot2 remains the standard. QGIS stands alone for geospatial depth.
Before committing to any library: Define the product surface, list the required interactions, and assign ownership. Run a two-week prototype with your top two candidates on a real use case. That exercise surfaces the actual maintenance cost, not the demo-day version.
A chart that ships on time and updates cleanly across segments is worth more than a technically impressive one that blocks the next sprint. Choose accordingly.
Start your journey with Guideflow today!
FAQs
There is no single best library for every team. D3.js leads for custom web visualization where control over every element matters. Plotly is strongest when data science and product teams share a Python or multi-language analytics layer. Chart.js and Recharts fit standard product dashboards. ggplot2 and seaborn fit statistical analysis in R and Python respectively.
D3.js gives the most control for custom visuals. Chart.js covers common chart types quickly with Canvas rendering. Apache ECharts provides a broader catalog with built-in interactivity. Recharts is the right choice when charts live inside a React application. Observable Plot fits concise exploratory charts built on the D3 ecosystem.
matplotlib is the foundational layer with the broadest compatibility across the Python scientific stack. seaborn layers over matplotlib to produce statistical charts faster with cleaner defaults. Plotly adds interactivity and covers production analytics applications through the Dash framework. The right choice depends on whether the output is a notebook, a report, or a deployed application.
Libraries are code packages that developers embed in applications, notebooks, and custom workflows. BI tools are broader platforms that handle reporting, permissions, connectors, and business-user interfaces without requiring code. Product teams often use both, but for different jobs: Libraries for product-native charts, BI tools for cross-team reporting.
Many libraries carry no licensing cost, but teams still carry implementation, maintenance, and hosting costs. Check the license type, any commercial hosting fees (such as shinyapps.io for Shiny or Observable plans for Observable Plot), security review requirements, and long-term ownership. Free to download is not the same as free to operate.
Define the product surface first: Customer-facing, internal, or analytical. Then identify the required interactions (filtering, drilldown, comparison), the engineering team's language and framework, and who owns maintenance after launch. Libraries that fit your design system and release cadence reduce friction across every future metrics update.
Plotly, Apache ECharts, Shiny, and D3.js all support interactive dashboards. Plotly fits Python-first teams with existing analytics infrastructure. Apache ECharts covers broad chart types with minimal custom interaction code. Shiny is the fastest path for data scientists who need a usable tool without a frontend build. D3 fits when the dashboard interaction model must be fully custom.
QGIS is the strongest choice for desktop geospatial analysis, territory mapping, and spatial data management. D3.js supports custom web maps using geographic projections and GeoJSON. The right choice depends on whether the team needs GIS analysis and data management, or just an embedded map layer inside a web application.