

Your dashboards are full. The metrics update daily. And you still find out about activation drops three weeks after the fact.
That gap between data and decision is what time series intelligence software is built to close. These platforms help PMs, data teams, and operations leaders analyze temporal signals, forecast ahead, and catch anomalies before customers feel them. According to DataIntelo (2025), the time series analytics platform market was estimated at $3.96 billion in 2025 and is projected to reach $12.38 billion by 2034, growing at 13.5% annually. The demand is real, and so is the variation across tools.
The category spans AI forecasting engines, industrial analytics platforms, time series databases, statistical software, and anomaly detection products. Choosing the wrong type means either too much complexity for your data team or too little capability for your engineering environment.
This guide routes you to the right fit by use case.
What's inside
This guide compares 11 time series intelligence software products for 2026, chosen for forecasting depth, anomaly detection, analytics capability, deployment fit, and buyer relevance.
- Who it's for: PMs, data leaders, operations teams, and analytics stakeholders working with time-stamped data
- How tools were chosen: Forecasting depth, anomaly detection, integrations, and deployment fit
- What you'll compare: Pricing, G2 rating, ideal use case, and key differentiator
- How to use it: Start with the comparison table, then read entries that match your data environment
Pricing and G2 ratings were verified against live vendor pages and G2 listings.
TL;DR
- Best for AI forecasting: Nixtla, for teams that need foundation-model forecasting and automated anomaly detection at scale
- Best for industrial analytics: TrendMiner and Seeq, for process engineers working with historian and sensor data
- Best for statistical forecasting: Minitab Statistical Software, when analysts need guided ARIMA and decomposition workflows
- Best for time series infrastructure: InfluxDB for high-volume ingestion, Warp 10 for geo-time series workloads, KX for low-latency financial analytics
- Best for enterprise data platforms: SAP HANA Cloud, for large organizations already running SAP data infrastructure
- Best for automated anomaly detection: Anodot, for business and product teams monitoring metrics across many signals simultaneously
What is time series intelligence software?
Time series intelligence software helps teams analyze, forecast, monitor, and explain data points collected over time, such as product usage, sensor readings, transactions, infrastructure metrics, or financial prices.
This category sits above a standard time series database. A database stores and queries temporal data. Intelligence software turns that data into forecasts, anomaly alerts, trend patterns, and decision signals, often without requiring a data scientist to build every model from scratch.
Core capabilities
- Forecasting: Predict future values from historical time-stamped data
- Anomaly detection: Flag unusual movements, spikes, drops, or pattern breaks
- Trend analysis: Identify long-term movement, seasonality, and recurring cycles
- Root-cause analysis: Connect metric changes to events, segments, or process variables
- Alerting: Notify teams when signals deviate from expected behavior
- Modeling: Support statistical, machine learning, or foundation-model approaches
- Visualization: Show temporal patterns through charts and dashboards
- Integration: Connect to warehouses, historians, streams, and BI tools
What it is not
A time series database stores and queries temporal data but may not forecast or explain it alone. A BI tool visualizes data but lacks specialized temporal modeling. An observability platform monitors systems but typically does not support broader business forecasting.
Why PMs care about this category
For a product manager, time series intelligence software turns lagging metrics into leading indicators. It helps detect activation drops right after a release, forecast API demand before capacity becomes a problem, and compare cohort behavior across segments and lifecycle stages. This is the difference between explaining what happened in a quarterly review and acting on a signal the week it appears.
If you're evaluating predictive analytics software tools more broadly, time series intelligence is the specialized layer that handles temporal structure where general analytics tools fall short.
When to use time series intelligence software
Forecast product, demand, or capacity shifts
Use time series intelligence when you need historical data to produce a forward-looking estimate. Activation volume, support ticket load, API usage, infrastructure demand, and transaction flow all follow temporal patterns that statistical and AI forecasting models can project. For a PM, a better forecast shifts the roadmap conversation from "we think usage will grow" to "usage is projected to increase 40% over the next quarter, here's the confidence interval." That changes prioritization decisions and reduces the opportunity cost of guessing wrong.
Detect anomalies before customers feel them
Anomaly detection catches unusual drops, spikes, and drift in time-stamped data before they surface in support tickets or churn reports. A trial activation rate that drops 15% the day after a release is a signal worth catching in hours, not weeks. The goal is not more alerts. The goal is earlier, higher-quality triage, so the team investigates the right signal at the right time.
Explain patterns across complex operations
Industrial teams use time series intelligence to compare production periods, correlate process variables, and investigate root causes in sensor and historian data. PMs in operational software companies need this capability to support engineering and operations stakeholders with temporal evidence. Shared temporal analysis helps cross-functional teams align on what changed, when, and why, before that disagreement stalls a decision.
Time series intelligence software comparison
The table below covers all 11 tools by use case, key differentiator, pricing, and G2 rating. Use it to shortlist two or three options, then read the full entries for the ones that match your data environment and team.
| # | Product | Best for | Key differentiator | Pricing | G2 rating |
|---|---|---|---|---|---|
| 1 | Nixtla | AI forecasting and anomaly detection | Foundation-model forecasting with TimeGPT | Free / Enterprise (contact sales) | 4.7/5 |
| 2 | TrendMiner | Industrial process analytics | No-code analytics for historian and sensor data | Contact sales | 4.6/5 |
| 3 | Seeq | Process manufacturing analytics | Deep investigation workflows for engineers | Contact sales | 4.6/5 |
| 4 | InfluxDB | Time series data infrastructure | High-volume ingestion with usage-based pricing | Free / from $0.0025/MB written | 4.5/5 |
| 5 | SAP HANA Cloud | SAP-centered enterprise analytics | In-memory multi-model data platform | Price upon request | N/A |
| 6 | Minitab Statistical Software | Statistical forecasting | Guided ARIMA, decomposition, and smoothing workflows | From $1,995/year | 4.6/5 |
| 7 | dataPARC | Plant operations intelligence | Historian-connected real-time dashboards and analytics | Contact sales | 4.9/5 |
| 8 | Anodot | Business anomaly detection | Autonomous learning anomaly detection with root-cause correlation | Contact sales | 4.5/5 |
| 9 | Warp 10 | Developer-led temporal analytics | Geo-time series platform with 1,300+ analytics functions | Contact vendor | 4.4/5 |
| 10 | KX | Low-latency financial analytics | Microsecond queries on billions of rows using the kdb+ engine | Free start / contact sales | 4.6/5 |
| 11 | Epsilon3 | Operational procedure analytics | Time-aware execution data for hardware and test operations | From $100/user/month | 4.2/5 |
Best 11 time series intelligence software tools for 2026
1. Nixtla
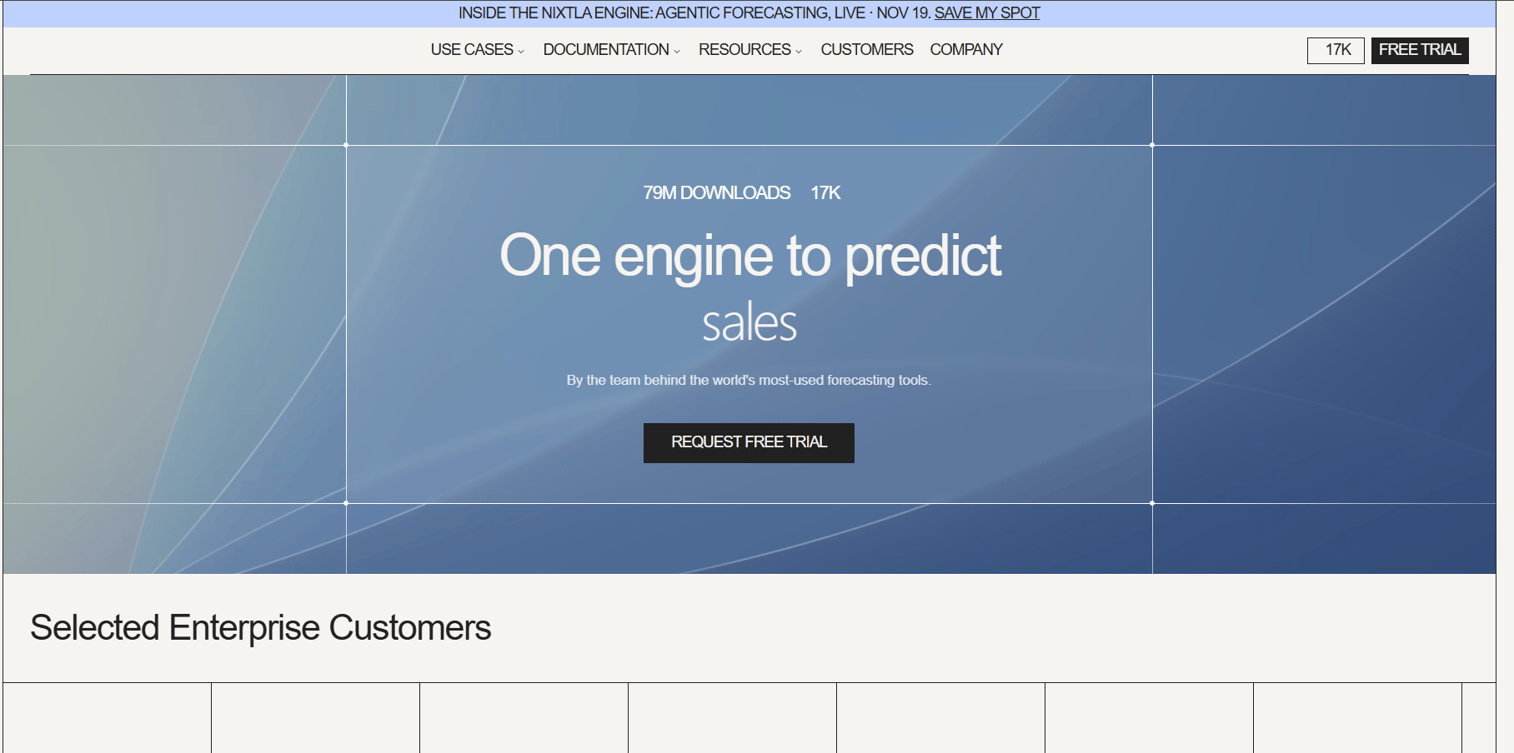
Nixtla is a time series forecasting and anomaly detection platform built around TimeGPT and a suite of open-source forecasting libraries. It supports more than 200 models, including foundation models that can forecast across many series without requiring teams to train individual models from scratch. Organizations in demand planning, energy, finance, and product analytics use it to generate probabilistic forecasts and detect unusual movements automatically.
Best for: Data science and analytics teams that need scalable AI forecasting and anomaly detection without long bespoke modeling cycles.
Key features
- TimeGPT foundation model forecasting across 200+ models
- Multivariate and probabilistic forecasting
- Real-time anomaly detection with driver analysis
- What-if scenario planning
- Integrations with data warehouses, lakehouses, and BI tools
Why choose Nixtla: Strong fit when the core job is forecasting many time series across domains simultaneously. For PMs, the platform is useful when product usage or retention forecasts need to run on a regular cadence without engineering a custom pipeline each time. It reduces the modeling cycle from weeks to hours for teams with existing data infrastructure.
Nixtla pricing: A free tier covers the open-source libraries. Enterprise adds premium models, fine-tuning, scalability controls, SLAs, and dedicated support. Enterprise pricing is available through sales.
G2 rating: 4.7/5
2. TrendMiner
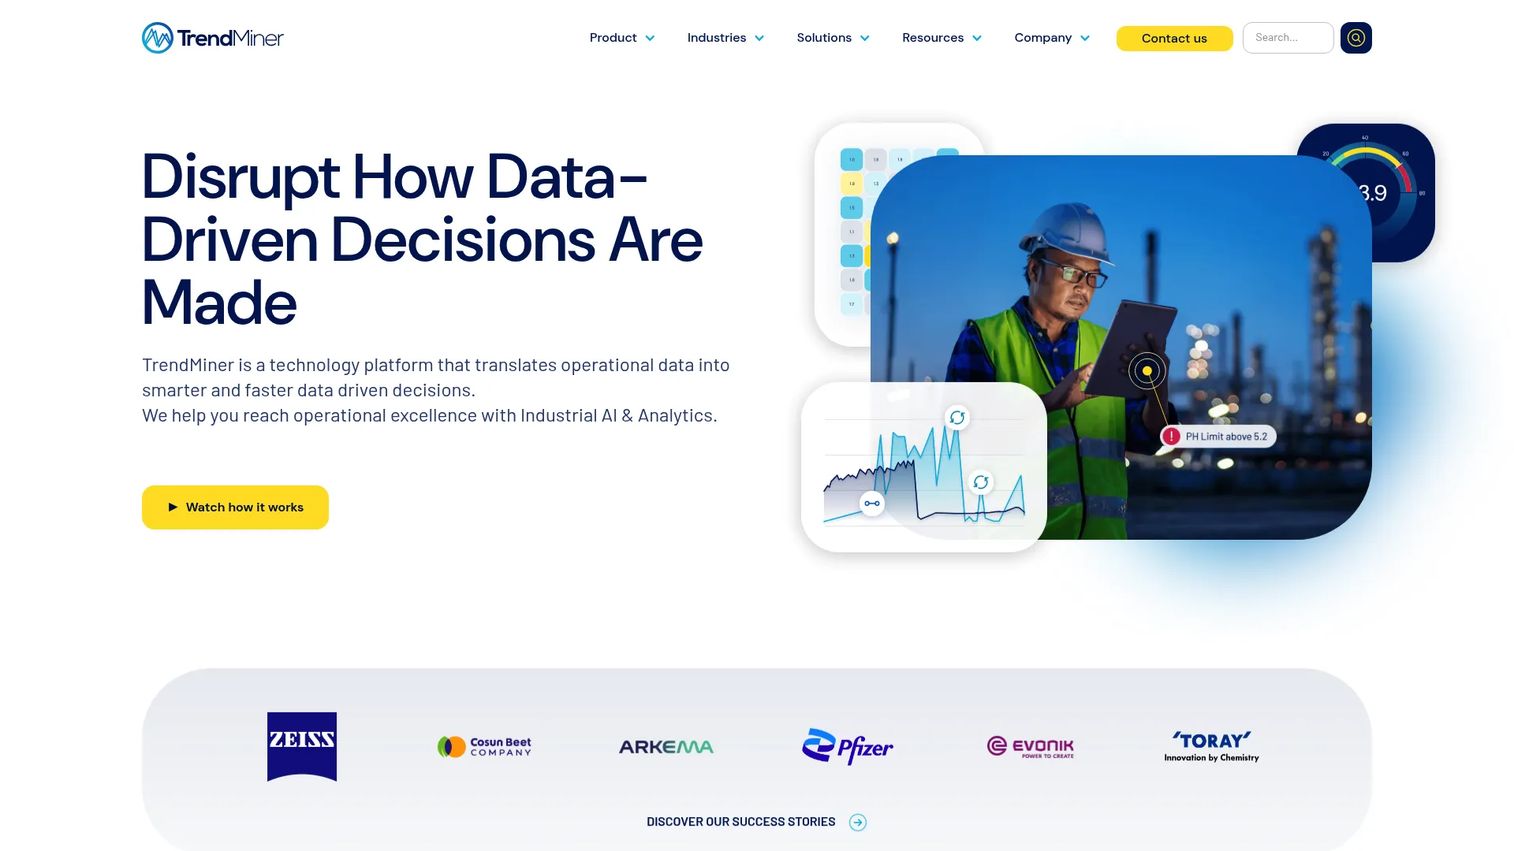
TrendMiner is an industrial AI and analytics platform that helps operational teams extract decisions from process data, historian data, and sensor streams. Process engineers and subject-matter experts use it to search for patterns, compare batches, monitor deviations, and build operational dashboards, all without writing code or waiting for a data science queue. It supports on-premise, private cloud, SaaS, and hybrid deployment, which matters for manufacturing environments with strict data residency requirements.
Best for: Manufacturing, chemicals, energy, and process teams analyzing historian and sensor data to investigate production behavior.
Key features
- Historian data connectivity and contextual data layer
- No-code trend analysis and pattern search
- Fingerprinting for golden-batch comparison and automated detection
- 24/7 monitoring with configurable alerting
- Machine learning extensibility with Python notebooks
Why choose TrendMiner: Use it when subject-matter experts need to investigate production behavior without routing every question through a data science team. The no-code interface gives domain experts faster validation loops, which translates directly to shorter root-cause cycles. For PMs evaluating industrial analytics software, this is the self-service approach for operational data.
TrendMiner pricing: TrendMiner prices through sales, typically for industrial teams with historian and process-data requirements. Contact TrendMiner directly for a quote.
G2 rating: 4.6/5
3. Seeq

Seeq is an advanced analytics platform for process manufacturing and operational time series data. It helps engineers and subject-matter experts investigate operating conditions, cleanse sensor data, model relationships across variables, and share findings through auto-updating reports. AI assistants and Python extensibility give teams a path from investigation to scalable analytics, while historian integrations connect Seeq to the systems where process data already lives.
Best for: Process engineers and industrial analytics teams that need flexible investigation workflows, not just static forecasting outputs.
Key features
- Time-series data cleansing, preparation, and advanced calculations
- Historian data integration
- Collaborative analysis workbooks with auto-updating reports
- Python scripting and machine-learning extensibility
- AI assistants and custom workflow agents
Why choose Seeq: Choose it when the team needs to investigate complex operational conditions rather than consume a pre-built forecast. It works well in environments where engineer judgment and algorithmic analysis need to run together, and where the value is in the investigation process, not just the output. This distinction matters when PMs are evaluating tools for engineering-adjacent teams.
Seeq pricing: Seeq prices through sales. Contact Seeq for current figures.
G2 rating: 4.6/5
4. InfluxDB
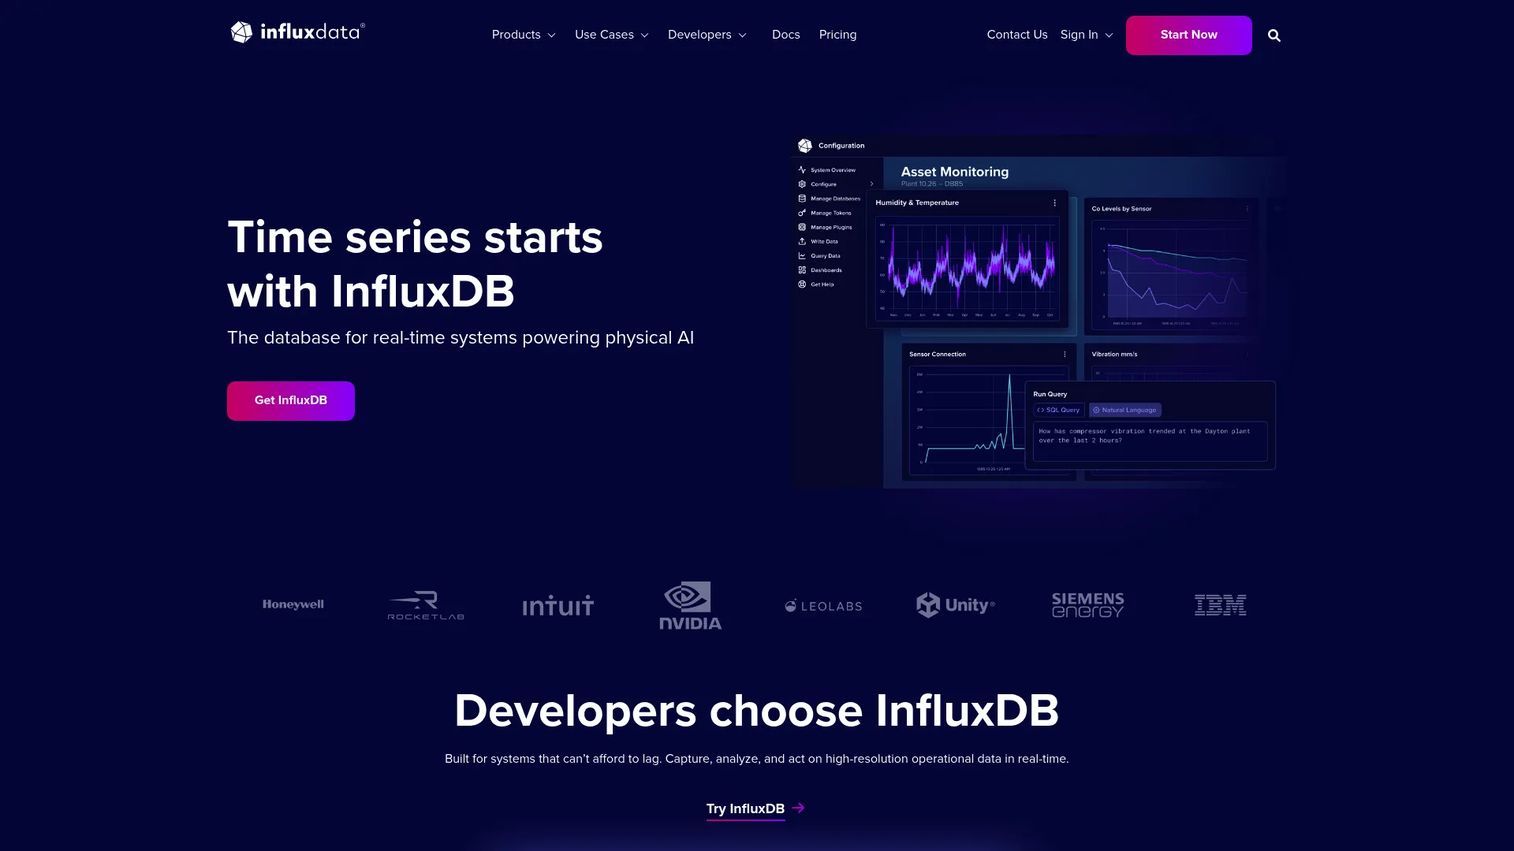
InfluxDB is a high-performance time series database and analytics platform built for collecting, storing, querying, and processing high-frequency timestamped data. Engineering teams use it for metrics, IoT telemetry, application observability, and infrastructure monitoring. The platform supports both SQL and InfluxQL, unlimited series cardinality, and a Python data processing engine. InfluxDB offers a self-managed open-source edition (InfluxDB 3 Core) alongside Cloud Serverless and Cloud Dedicated options.
Best for: Engineering and data teams that need reliable, scalable time series ingestion, storage, and querying before adding a modeling or intelligence layer on top.
Key features
- High-speed ingestion with unlimited series cardinality
- SQL and InfluxQL query support
- Real-time querying and Python data processing
- Object-storage-backed compressed Parquet storage
- Cloud Serverless, Cloud Dedicated, and self-managed deployment
Why choose InfluxDB: Use it when the first problem is handling temporal data volume and query reliability rather than AI forecasting. For PMs, this is the right tool when product usage, IoT, or performance signals need a solid infrastructure layer before the team can run any detection or forecasting on top. It is infrastructure, not a plug-and-play intelligence platform.
InfluxDB pricing: InfluxDB 3 Core is free and self-managed. Cloud Serverless starts with a free usage-limited tier, then moves to pay-as-you-go at $0.0025 per MB written. Cloud Dedicated and Enterprise use custom pricing based on CPU configuration and contract.
G2 rating: 4.5/5
5. SAP HANA Cloud
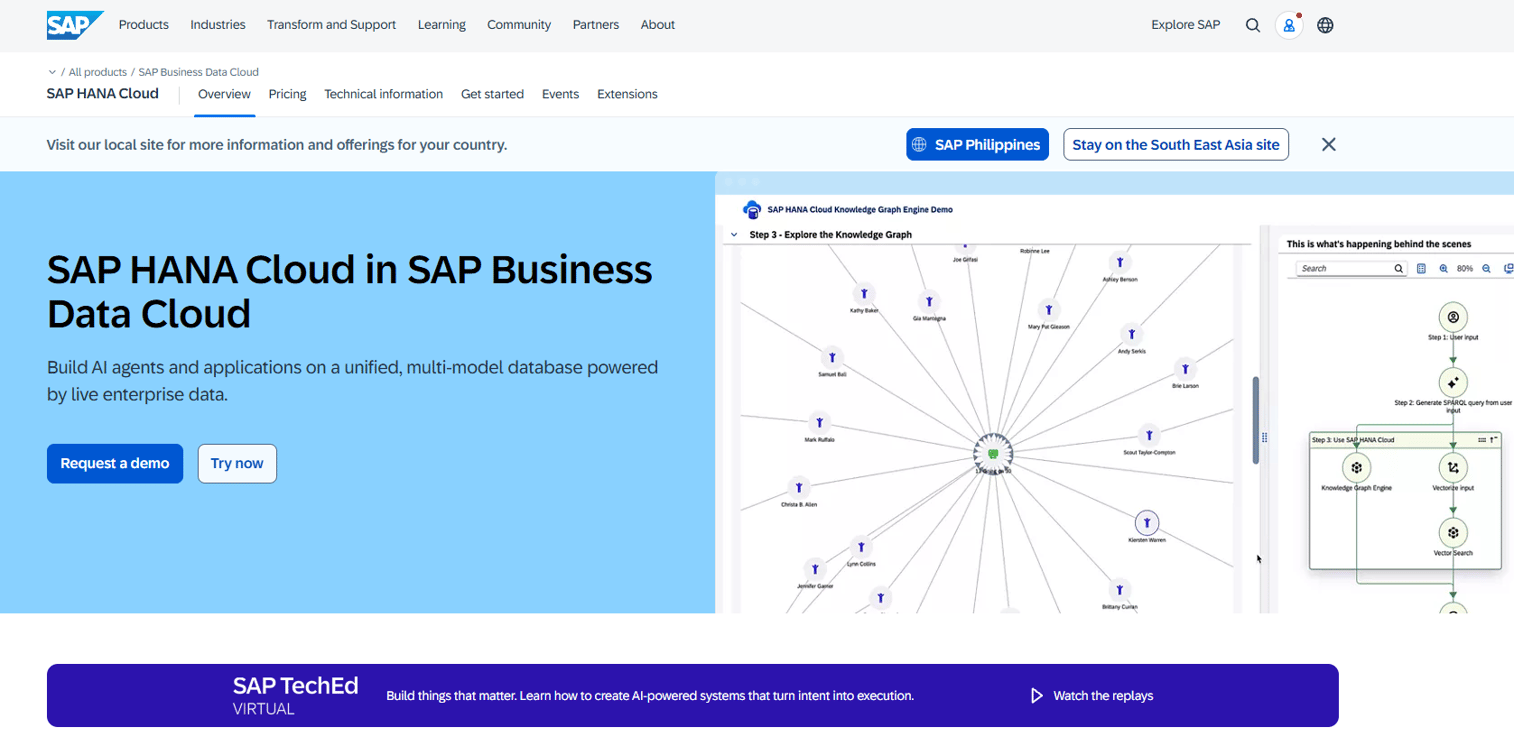
SAP HANA Cloud is a cloud-native, multi-model AI database that processes relational, graph, vector, spatial, JSON, and time-series data in a single engine. It supports machine learning, vector search, and knowledge graph queries natively, alongside elastic compute, intelligent data tiering, and built-in high availability. For enterprises already running SAP data infrastructure, it brings time series analysis into the broader data and application environment rather than adding a separate point tool.
Best for: Large enterprises already invested in SAP ERP, data, and analytics workflows that need time series analysis inside their existing platform.
Key features
- In-memory data processing across multiple data models including time series
- Vector search, knowledge graph queries, and native machine learning
- Elastic compute with independent storage scaling
- Enterprise data integration and SAP analytics connectivity
- Automated backups, monitoring, and high availability
Why choose SAP HANA Cloud: Choose it when time series intelligence must sit inside SAP's broader enterprise data layer and running a separate point tool creates integration overhead. It is a strategic data platform, not a standalone forecasting product, so the fit is strongest for procurement cycles that already go through SAP.
SAP HANA Cloud pricing: SAP uses capacity-unit pricing with contract durations ranging from 3 to 36 months. Amounts are available upon request through SAP's sales team.
6. Minitab Statistical Software
Minitab Statistical Software is a comprehensive statistical analysis and process improvement platform with dedicated time series forecasting capabilities. Analysts and quality teams use it for ARIMA modeling, decomposition forecasting, exponential smoothing, measurement system analysis, and control charts, all through guided workflows that do not require custom code. It includes an interactive Graph Builder and integrates with R and Python for teams that want to extend beyond the native toolkit.
Best for: Analysts, quality teams, and operations groups that need reliable statistical forecasting methods with guided workflows and clear diagnostic output.
Key features
- ARIMA, Box-Jenkins, and exponential smoothing modeling
- Decomposition forecasting with seasonal analysis
- Statistical diagnostics and measurement system analysis
- Interactive Graph Builder with heatmaps, Pareto charts, and scatterplots
- R and Python integration
Why choose Minitab: Strong fit when interpretability and established statistical procedures matter more than AI scale. Teams that need to explain a forecast to a cross-functional audience or audit a model against historical patterns will find the guided workflow and diagnostic output valuable. It is also a natural fit for quality and continuous-improvement teams already running Minitab for process control.
Minitab pricing: A single annual license runs $1,995 per year and includes the full toolkit, cloud and desktop access, technical support, and updates.
G2 rating: 4.6/5
7. dataPARC
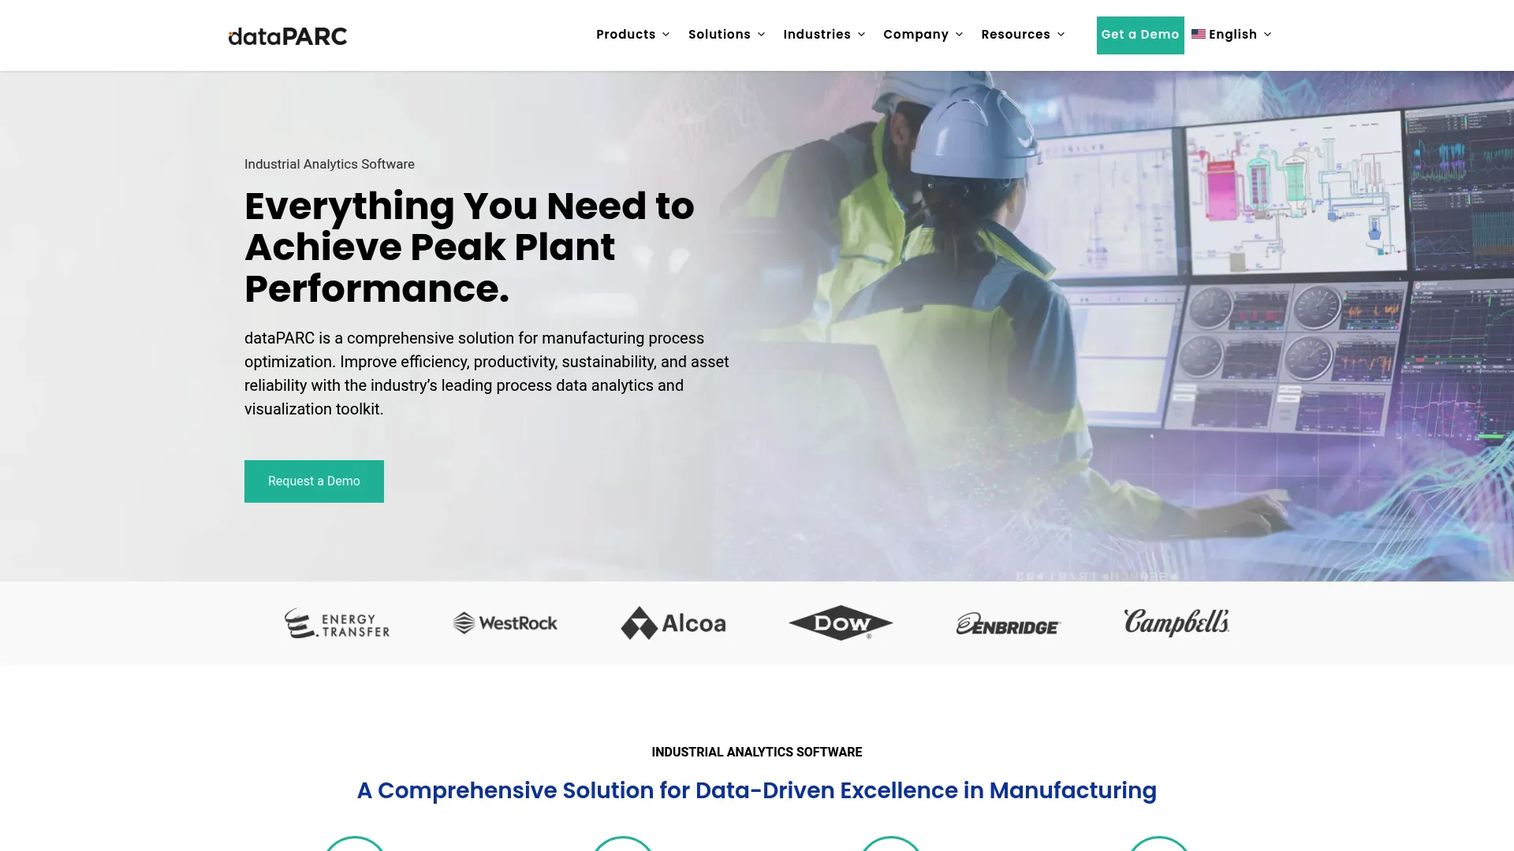
dataPARC is an industrial data historian, analytics, and visualization platform designed for plant-wide operational intelligence. It connects to OPC, SQL, REST APIs, and existing historians, then brings that data into real-time displays, process trends, SPC and SQC tools, predictive models, smart alarms, OEE tracking, and production reporting. Pricing is tag-count based rather than per-seat, which fits plants that need broad visibility across many instrumentation points.
Best for: Plant operations teams in manufacturing and process industries that need real-time visibility into historian data, production performance, and operational anomalies.
Key features
- Real-time and historical trending with configurable displays
- Industrial historian with OPC, SQL, and REST API connectivity
- SPC/SQC, smart alarms, and downtime tracking
- Predictive modeling and production analytics
- OEE reporting and event contextualization
Why choose dataPARC: Choose it when operators and engineers need fast, plant-floor visibility rather than a data science modeling environment. The tag-count licensing model fits broad deployments without per-user costs, and the historian-first architecture means teams can connect existing data sources without rebuilding infrastructure. It is purpose-built for operations intelligence, not a general analytics tool extended to manufacturing.
dataPARC pricing: Pricing is based on tag count. Contact dataPARC for a commercial proposal.
G2 rating: 4.9/5
8. Anodot
Anodot is an AI-powered business monitoring platform that detects anomalies, correlates related incidents, and helps teams identify root causes in real time. It autonomously learns normal and seasonal patterns across revenue, cost, usage, and operational metrics, then surfaces only the signals worth investigating. Alert correlation reduces noise by grouping related anomalies, and integrations with Slack, Jira, PagerDuty, email, and webhooks route findings to the right team. G2 currently lists Anodot under its parent brand Umbrella (formerly Anodot).
Best for: Business, product, and operations teams monitoring large volumes of real-time metrics who need automated anomaly detection with root-cause correlation, not manual threshold rules.
Key features
- Real-time anomaly detection with autonomous pattern learning
- Automatic correlation of related anomalies and incidents
- Root-cause analysis with significance scoring
- Forecast-based dynamic thresholds
- Integrations with Slack, Jira, PagerDuty, and email
Why choose Anodot: Best when the pain is metric volatility and noisy manual alerting. For PMs, it is especially useful for catching usage, conversion, or revenue anomalies early enough to investigate release impact before it compounds. The autonomous learning model means the team does not need to configure thresholds for every metric manually.
Anodot pricing: Anodot prices through sales. Contact the team for current packaging and enterprise terms.
G2 rating: 4.5/5
9. Warp 10
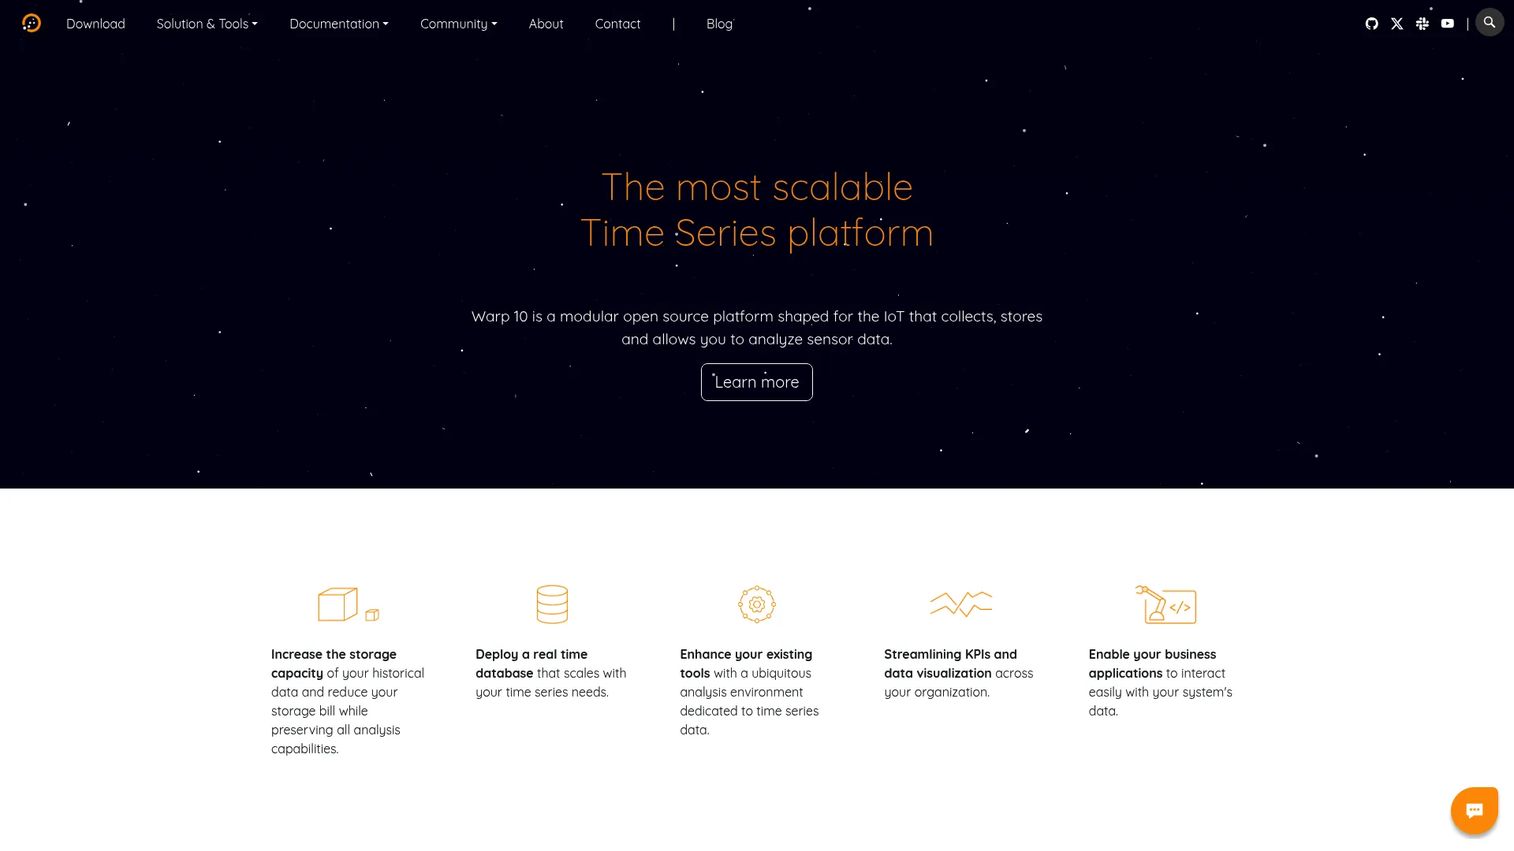
Warp 10 is an open-source time series and Geo Time Series platform for collecting, storing, analyzing, and visualizing sensor and temporal data at scale. It ships with more than 1,300 analytics functions, a scriptable dashboard environment (Discovery), and development tooling through WarpStudio and VS Code. Deployment options include standalone, standalone-plus, and distributed configurations, covering teams that want to self-host or extend to edge environments.
Best for: Technical teams handling complex time series workloads, including IoT sensor data, location-aware datasets, and scientific instrumentation that requires programmable analytics pipelines.
Key features
- Time-series and Geo Time Series data management
- 1,300+ analytics functions
- Dynamic dashboards as code with the Discovery framework
- WarpScript development via WarpStudio and VS Code
- Standalone, Standalone+, and Distributed deployment
Why choose Warp 10: Use it when the time series problem involves high complexity, geographic dimensions, or the need for custom analytics pipelines that standard platforms do not support. It is a fit for technical organizations that want control over data processing and are comfortable with a specialized scripting environment. Teams evaluating data visualization tools for temporal sensor data will find the Discovery dashboarding layer worth exploring.
Warp 10 pricing: Warp 10 is open-source. Contact the vendor for enterprise support or managed options.
G2 rating: 4.4/5
10. KX
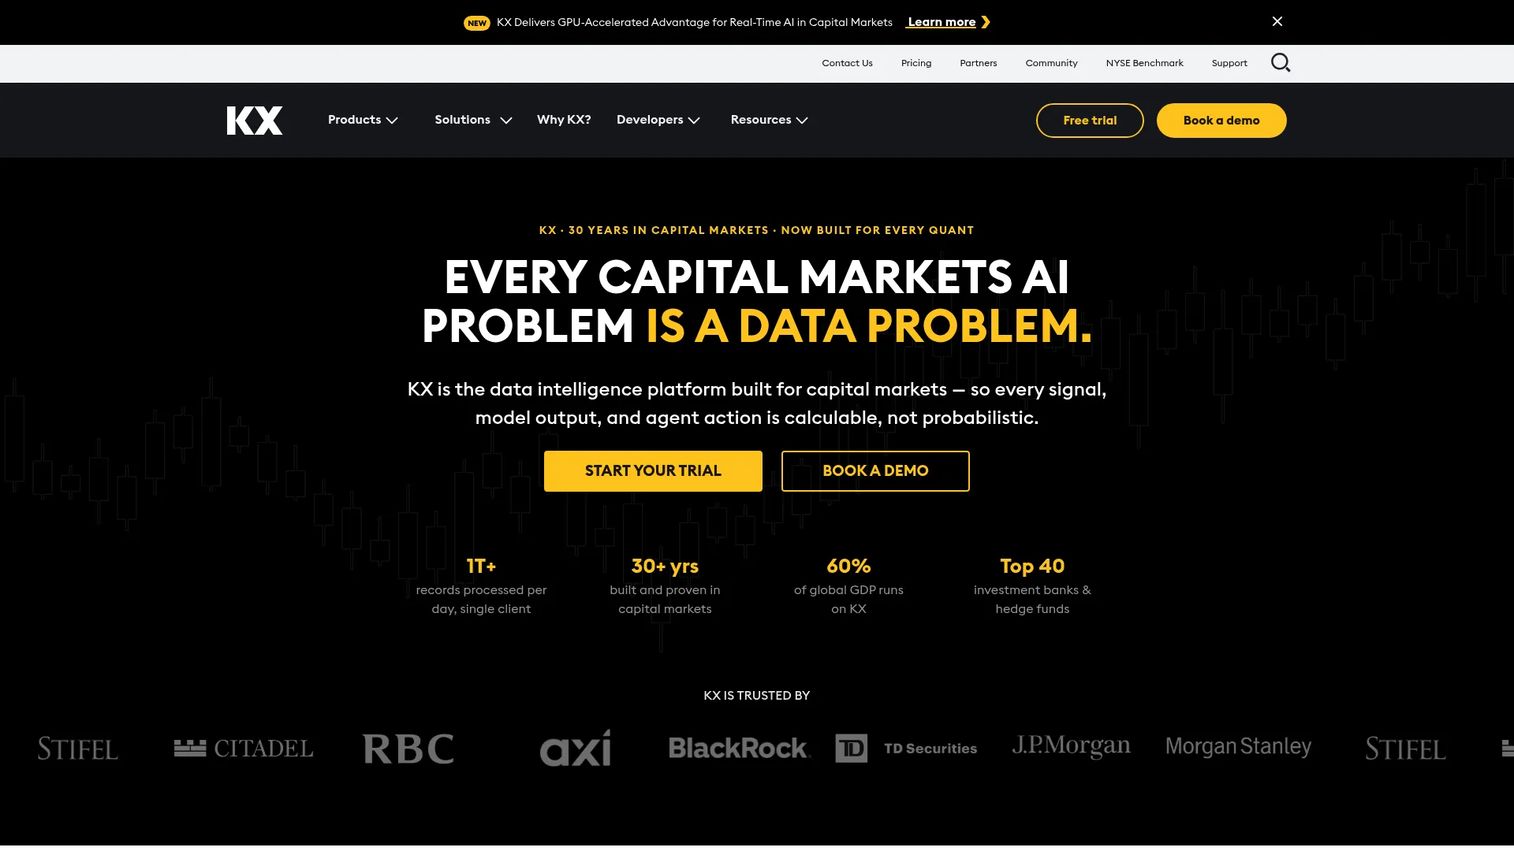
KX provides a data intelligence and AI platform built around kdb+, a time series and analytics engine known for microsecond queries on billions of rows. Capital markets firms use it for market data across 250+ venues, backtesting, transaction cost analysis, algorithm development, and real-time surveillance with tick-level audit trails. KDB-X, the current cloud offering, extends the engine to Python, SQL, q, GPU acceleration, vector search, and MCP protocols.
Best for: Capital markets firms and high-performance analytics teams that need low-latency time series queries, streaming data processing, and market data infrastructure at scale.
Key features
- Microsecond queries on billions of time series rows using kdb+
- AI-ready market data across 250+ venues with point-in-time accuracy
- KDB-X support for Python, SQL, q, GPU acceleration, and vector search
- Real-time cross-asset surveillance with tick-level audit trails
- Managed analytics for backtesting, TCA, and AI research
Why choose KX: Choose KX when speed, scale, and advanced temporal querying matter more than a business-user interface. For PMs at financial data companies or platforms with high-frequency transaction or market data, this is infrastructure for the data-intensive layer. General analytics teams with standard time series volumes will find other tools in this list a better fit.
KX pricing: KDB-X starts with a free option and uses usage-based monthly pricing. Market data and surveillance solutions require a custom quote. Contact KX sales for current figures.
G2 rating: 4.6/5
11. Epsilon3
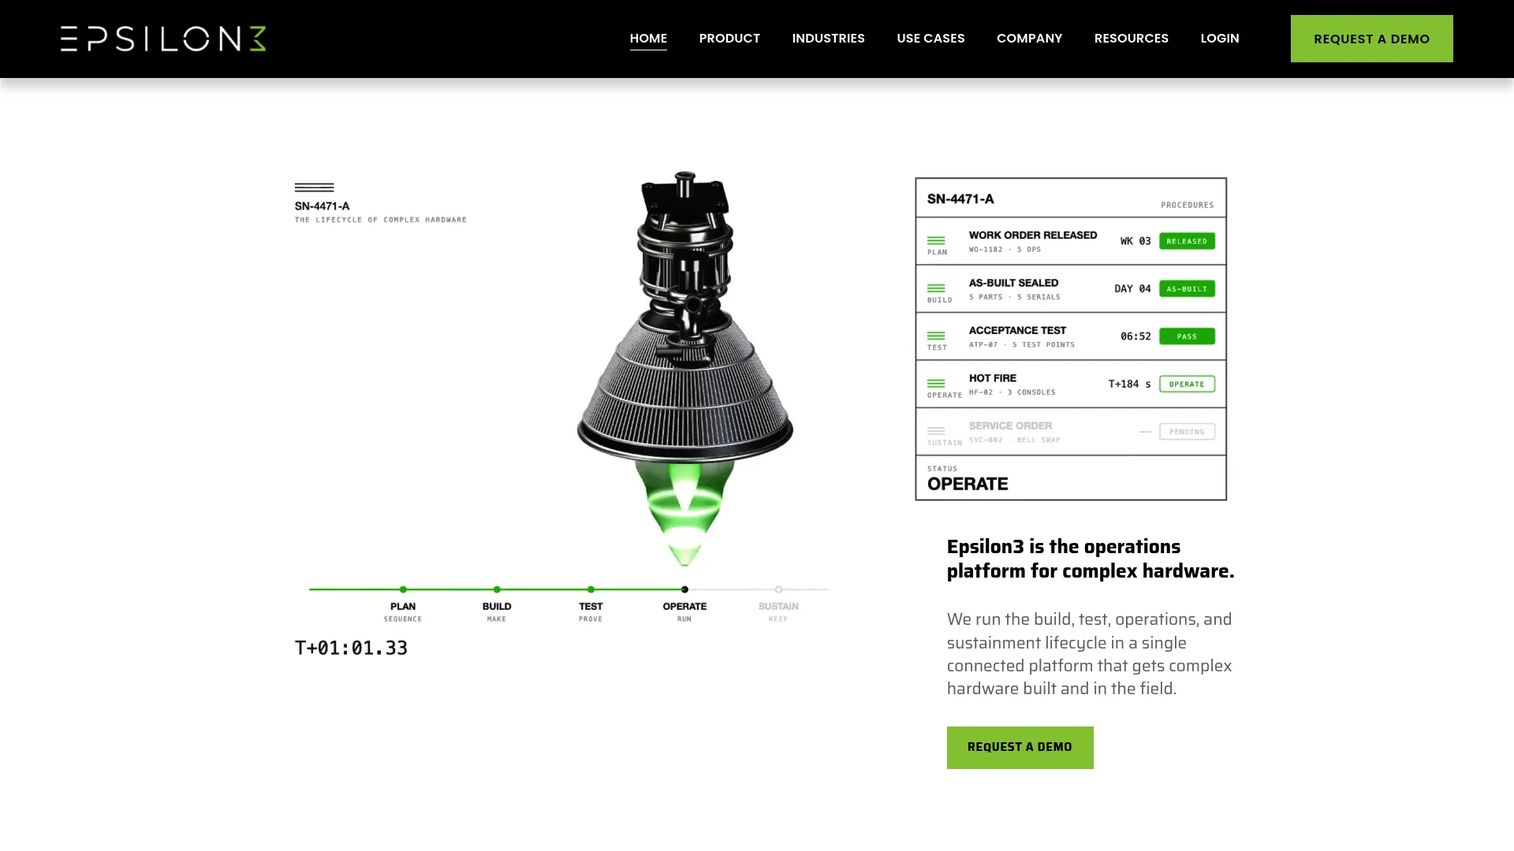
Epsilon3 is an AI-powered operations platform for hardware-intensive organizations managing complex build, test, and mission workflows. It connects procedures, parts, inventory, test results, issues, and time-stamped execution data into a connected digital thread. Analytics cover test telemetry, time-series data, shift logs, and as-built records, making it useful when the time series problem is operational execution history rather than sensor forecasting. Aerospace, defense, and advanced manufacturing teams use it to improve future operations based on what actually happened during past runs.
Best for: Aerospace, manufacturing, testing, and complex operations teams tracking time-stamped procedure execution, test data, and compliance records across hardware programs.
Key features
- Digital procedures, work instructions, and scheduling
- Manufacturing execution, parts, inventory, and as-built records
- Test management, requirements, and verification tracking
- Time-series data and telemetry analytics
- Quality, non-conformance, risk management, and compliance records
Why choose Epsilon3: Choose it when the time series problem is operational execution data rather than sensor forecasting. If your team needs to understand what happened across a complex procedure, compare run-to-run performance, or maintain compliance records tied to timestamped events, Epsilon3 fits that job. It is not a general forecasting platform, so set expectations accordingly.
Epsilon3 pricing: Basic starts at $100 per user per month (billed annually). Pro is $200 per user per month (billed annually) and adds planning, automation, AI, testing, quality, risk, SSO, and integrations. Enterprise pricing is available through sales.
G2 rating: 4.2/5
Considerations when choosing time series intelligence software
Start with the decision you need to make
Before evaluating tools, define whether the job is forecasting, anomaly detection, root-cause investigation, data infrastructure, or operational visibility. A PM forecasting activation volume needs different software than a plant engineer investigating process drift or a capital markets team querying tick data at microsecond latency. Choosing a tool type first narrows the shortlist faster than comparing feature lists.
Check your data environment before anything else
Time series tools fail at the ingestion step more often than at the modeling step. Confirm that the platform connects to your actual data sources: Warehouses, historians, IoT streams, REST APIs, or product analytics pipelines. Tools that look strong on forecasting but require significant data-pipeline work before they reach your data add engineering cost that can exceed the tool's value. For teams already exploring agentic analytics software, verify that the data layer feeds cleanly before adding intelligence on top.
Match the model type to the team's skill and explainability needs
Traditional statistical methods such as ARIMA and exponential smoothing are easier to audit and explain to stakeholders. AI and foundation-model forecasting can handle many series simultaneously with less manual configuration. The right answer depends on forecast volume, the team's comfort with model interpretability, and whether a cross-functional audience needs to trust the output in a planning meeting.
Evaluate alert quality, not alert volume
For anomaly detection, ask how the tool reduces noise rather than how many alerts it generates. PMs need signals that map to specific events: A release, a cohort segment, a configuration change. Tools that autonomously learn seasonal patterns and correlate related anomalies produce fewer, higher-quality signals than threshold-based systems requiring manual tuning across hundreds of metrics.
Verify governance, security, and deployment requirements
Industrial systems, financial platforms, and customer usage data each carry different data residency, access control, and auditability requirements. Check whether the tool supports self-hosting, bring-your-own-cloud (BYOC), audit logs, and enterprise SSO before shortlisting. For regulated environments, the deployment model is often as important as the analytics capability.
Conclusion
The 11 tools in this guide cover distinct jobs. Nixtla is the strongest pick for teams that need AI forecasting and anomaly detection without custom modeling cycles. TrendMiner, Seeq, and dataPARC are built for industrial analytics, historian data, and operational visibility. InfluxDB, Warp 10, and KX solve time series infrastructure and high-performance querying. Minitab fits analysts who need interpretable statistical forecasting. SAP HANA Cloud suits enterprises already running SAP data infrastructure. Anodot is the clearest fit for automated business metric anomaly detection. Epsilon3 belongs in complex hardware and test operations.
The next step is straightforward:
- Pick the top two tools by use case match.
- Confirm that both connect to your existing data sources.
- Run a pilot on one high-value time series.
- Compare forecast accuracy, anomaly usefulness, workflow adoption, and maintenance effort after two to four weeks.
The gap between dashboards that explain the past and signals that inform the present is closable. The right tool for your data environment and team is what closes it.
FAQs
Time series intelligence software helps teams analyze, forecast, monitor, and detect anomalies in data collected over time, such as usage metrics, sensor readings, financial prices, or transaction volumes. It goes beyond storage and visualization by applying statistical models, machine learning, or foundation models to surface patterns, predict future values, and flag unusual behavior.
A time series database stores, indexes, and queries temporal data at scale. Intelligence software uses that data to forecast, detect anomalies, explain trends, and support decisions. Some tools, including InfluxDB and Warp 10, combine both layers. Others, such as Nixtla and Anodot, sit above the database and focus on analysis and detection.
Nixtla is the strongest fit for teams that need AI and foundation-model forecasting across many series simultaneously. Minitab Statistical Software is better when analysts need guided ARIMA, decomposition, or exponential smoothing workflows with clear statistical diagnostics. SAP HANA Cloud suits enterprises that need forecasting inside an existing SAP data platform.
TrendMiner, Seeq, and dataPARC are built specifically for process data, historian integration, and operational analysis. TrendMiner and dataPARC emphasize no-code accessibility for domain experts. Seeq is stronger for teams that need advanced investigation workflows and Python extensibility alongside historian connectivity.
Anodot is designed around automated business metric anomaly detection, with autonomous pattern learning and root-cause correlation. Nixtla also offers real-time anomaly detection as part of its forecasting platform. InfluxDB provides the data infrastructure layer for teams that want to build monitoring and alerting pipelines on top of a time series database.
Yes, when PMs own metrics that move over time: Activation rates, feature adoption, API usage, trial-to-paid conversion, or support demand. These platforms help detect metric changes in hours rather than weeks, forecast capacity needs before constraints appear, and provide temporal evidence for roadmap decisions. The alternative is explaining what happened after the fact in a quarterly review.
The core model families are ARIMA and Box-Jenkins for traditional statistical forecasting, exponential smoothing and Holt-Winters for trend and seasonality, machine learning models for pattern-based prediction, and foundation models such as TimeGPT for scalable forecasting across many series. The right mix depends on the team's explainability requirements, data volume, and whether a data scientist is in the loop for model validation.
Pricing varies by structure: Seat-based licenses (Minitab at $1,995/year per user), usage-based cloud pricing (InfluxDB at $0.0025/MB written), tag-count industrial licensing (dataPARC), and quote-based enterprise contracts (TrendMiner, Seeq, Anodot, KX). Compare total cost against data volume, number of users, deployment model, and required integrations. For industrial tools, tag count is usually the primary cost driver. For cloud databases, ingest volume and query frequency are. For enterprise platforms, seat count and contract length typically determine the final number.