Your roadmap shows green. The launch is two weeks out. But pull requests have been sitting in review for four days, incident load is climbing, and nobody can give you a straight answer on whether the release date is still real.
Task completion in a project management tool tells you what's planned. It doesn't tell you where work is actually stuck, whether the team has capacity, or which initiatives are quietly absorbing more engineering time than anyone budgeted. That gap is the core problem software engineering intelligence platforms exist to close.
According to JetBrains' State of Developer Experience and Developer Productivity (2025), only 21% of tech organizations actively track deployment frequency and just 19% track lead time for changes. Yet 66% of developers don't believe their current productivity metrics reflect their actual contributions. Better instrumentation won't fix that overnight, but having the right platform makes the conversations between product and engineering substantially more grounded.
This guide covers 10 platforms that connect delivery data, developer experience signals, and capacity information so you can make better planning decisions before a launch becomes a recovery effort.
What's inside
This guide is for product managers and engineering leaders who need better delivery evidence before planning meetings, roadmap reviews, or release decisions.
- Ten platforms covering delivery flow, developer experience, investment planning, forecasting, and service ownership
- Selection criteria: SDLC data coverage, actionability for planning decisions, reporting depth, governance controls, and pricing transparency
- A comparison table with verified pricing and G2 ratings
- A buyer's checklist for separating team-level delivery intelligence from individual activity tracking
- Links to related resources on capacity planning software and advanced planning and scheduling software
TL;DR
- Best for delivery-flow visibility: LinearB, for teams connecting workflow signals to planning conversations
- Best for developer experience measurement: DX, for organizations pairing perception data with operational telemetry
- Best for roadmap forecasting: Allstacks, for PMs managing multi-team delivery risk across strategic initiatives
- Best for engineering investment planning: Jellyfish, for leadership connecting engineering capacity to business decisions
- Best free entry point: Swarmia, with a free plan for teams under 10 developers and paid tiers from $5/developer/month
- Best for custom engineering data models: Faros AI, for data-mature organizations with complex tool stacks
What are software engineering intelligence platforms?
A software engineering intelligence platform collects and connects data from planning, code, CI/CD, incident, and collaboration systems to help teams understand delivery performance, capacity, risk, and developer experience.
The category differs from project management tools, which track planned work and task status. It also differs from generic BI dashboards, which can visualize data but don't understand the software delivery lifecycle. Engineering intelligence platforms bring both together: They integrate across your actual delivery system and turn raw signals into decisions.
Core capabilities to look for:
- SDLC data integrations (planning tools, Git providers, CI/CD, incident management, HR or workforce data)
- DORA metrics: Deployment frequency, lead time, change failure rate, and mean time to recovery
- Flow efficiency: Cycle time, pull request review patterns, work in progress, and queue depth
- Delivery forecasting and initiative risk analysis
- Capacity planning views, including allocation across feature work, technical debt, and unplanned load
- Developer experience surveys and wellbeing signals
- Role-based access, governance, and audit controls
- AI adoption measurement through delivery outcomes
What it is not:
| Category | What it does | Where engineering intelligence adds what it lacks |
|---|---|---|
| Project management tool | Tracks planned tasks and status | Delivery evidence from code, reviews, and incidents |
| Generic BI dashboard | Visualizes connected data | Pre-built SDLC data model and delivery context |
| Developer portal | Manages service ownership and self-service | Delivery performance and team health analytics |
| Standalone DORA dashboard | Reports four core metrics | Portfolio forecasting and developer experience depth |
One firm editorial note: Use these platforms to understand team systems and delivery patterns. Ranking individual developers by commits, tickets closed, or code volume distorts behavior and erodes trust. Every platform on this list supports team-level analysis; the evaluation section covers how to confirm that in practice.
When to use software engineering intelligence platforms
Forecast roadmap delivery with evidence
When your release confidence comes from status updates rather than delivery data, you're guessing. Flow metrics, pull request age, blocked work counts, and historical delivery patterns give you a basis for realistic commitment conversations with stakeholders. A platform earns its place when it helps you say "here's why we think this will ship on time" rather than "the team says it's on track."
Find bottlenecks before a launch slips
Long review cycles, aging work items, unstable build pipelines, and escalating incident load are all visible in delivery data before they appear in a status meeting. Engineering intelligence platforms surface these signals early enough to intervene, whether that means adjusting scope, shifting capacity, or escalating a dependency.
Align engineering investment with product outcomes
Most engineering teams do more than ship features. Platform work, reliability improvements, and unplanned support load all compete for capacity. A platform that classifies work by type lets you have an informed conversation about what share of engineering time is going toward customer-facing delivery versus maintenance versus foundational investment. That visibility changes the quality of roadmap tradeoff discussions considerably.
Software engineering intelligence platforms comparison
Pricing and G2 ratings shift frequently. Verify every figure against the vendor's current pricing page and G2 listing before purchase decisions.
| # | Product | Best for | Key differentiator | Pricing | G2 rating |
|---|---|---|---|---|---|
| 1 | LinearB | Delivery-flow visibility | Workflow analytics tied to planning and delivery management | From $29/user/month (annual) | 4.6/5 |
| 2 | Swarmia | Small teams building a delivery baseline | Free plan plus modular paid tiers from $5/dev/month | Free or from $5/dev/month | 4.4/5 |
| 3 | DX | Developer experience alongside delivery data | Combines sentiment surveys with operational metrics | Contact for pricing | 4.6/5 |
| 4 | Jellyfish | Engineering investment planning | Connects engineering capacity to business priorities | Contact for pricing | 4.5/5 |
| 5 | Allstacks | Roadmap forecasting and delivery risk | AI-assisted planning with portfolio risk signals | Free Starter; paid from $400/year/contributor | 4.5/5 |
| 6 | Faros AI | Custom engineering data analytics | Configurable data model across many delivery systems | Contact for pricing | 4.8/5 |
| 7 | Uplevel | Engineering operations bottleneck diagnosis | Combines quantitative metrics with expert-led analysis | Free 45-min session; paid by scope | 4.1/5 |
| 8 | Hatica | Team health alongside delivery performance | Blends DORA and cycle-time data with wellbeing signals | Free plan; Pro from $19/member/month | 4.7/5 |
| 9 | Cortex | Platform engineering and service ownership | Service catalog, scorecards, and self-service workflows | Custom pricing | 4.4/5 |
| 10 | Pluralsight Flow | Code workflow and repository analytics | Pull request and review workflow diagnostics | From $38/contributor/month (annual) | 4.6/5 (Capterra) |
Best 10 software engineering intelligence platforms for 2026
1. LinearB
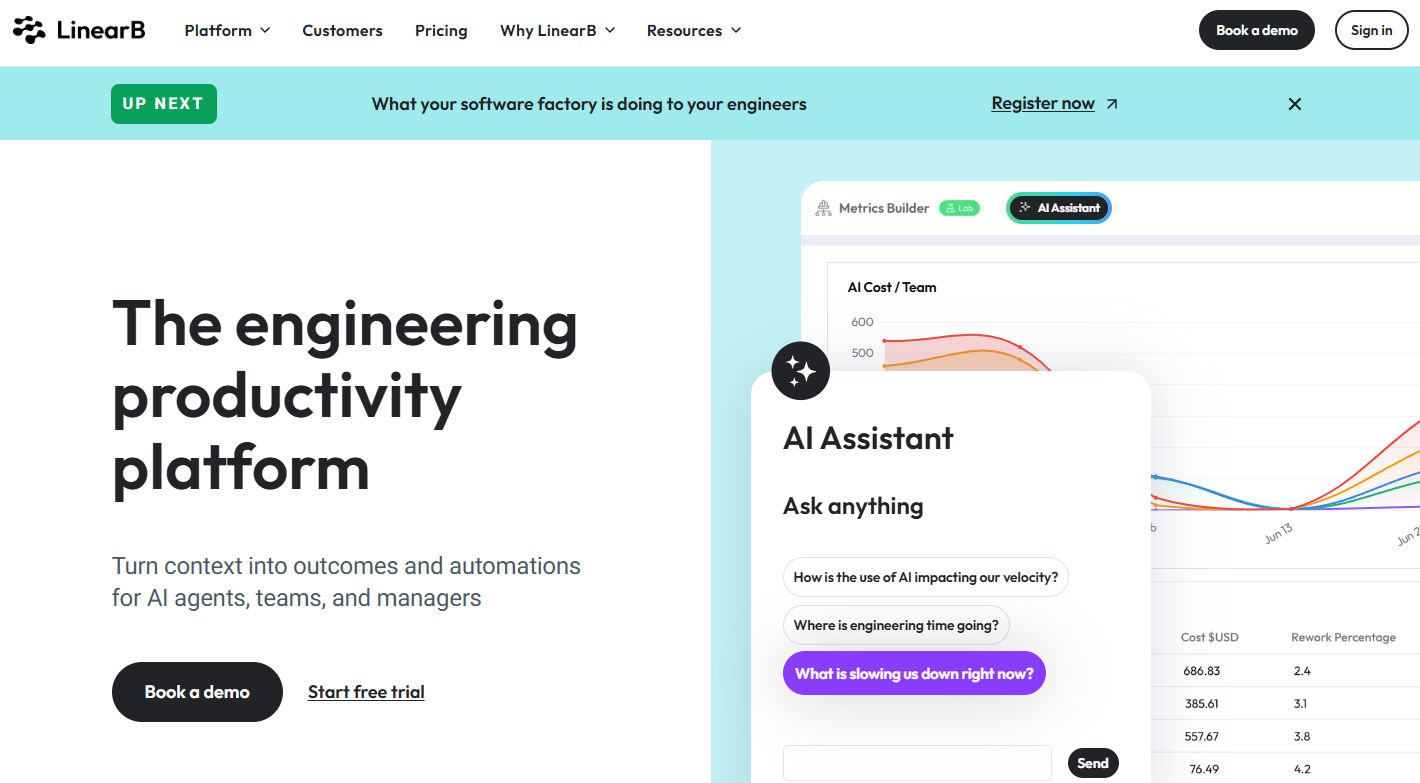
LinearB is an engineering productivity platform focused on software delivery visibility, developer experience, and AI impact measurement. It pulls data from planning systems and Git repositories to give product and engineering teams a shared view of workflow health, delivery risk, and capacity allocation. The platform also includes programmable workflow automation and on-premises agent support for organizations with stricter data requirements.
Best for: Product and engineering leaders who need to connect day-to-day delivery signals to roadmap planning conversations.
Key features
- Pull request workflow analytics and DORA metrics
- Delivery risk signals and project forecasting
- Resource allocation and engineering investment profiling
- Developer experience surveys
- Programmable workflow automation and MCP server
Why choose LinearB: LinearB is a strong fit when PMs need evidence for scope sequencing and release-confidence discussions, not just activity summaries. Its engineering investment reporting makes it easier to show leadership where time actually goes.
LinearB pricing: Plans start at $29/user/month (Essentials, billed annually) for teams of 50 or more developers on GitHub Cloud. Enterprise is $59/user/month and adds developer productivity insights, project tracking and forecasting, R&D cost capitalization, and Slack or Teams automations. A 45-day free trial is available with no credit card required.
G2 rating: 4.6/5
2. Swarmia
Swarmia is an engineering intelligence platform that measures effectiveness across code quality, DORA performance, AI adoption, developer experience, and software investment. It combines engineering metrics with planning context so teams can see how work moves through the delivery system rather than just counting what shipped. Swarmia AI can analyze engineering data and generate reports in natural language.
Best for: Engineering leads and product managers at smaller SaaS teams who want actionable delivery-health signals without building a dedicated analytics function first.
Key features
- Code, issue tracker, CI, and DORA metrics in one view
- AI adoption, activity, impact, and cost tracking
- Developer experience surveys and benchmarks
- Software capitalization reporting
- Investment balance and initiative focus summaries
Why choose Swarmia: The modular pricing model means you can start with just the signals you need, AI adoption costs or developer surveys, before committing to a broader plan. That makes it a practical entry point before scaling instrumentation across a larger organization.
Swarmia pricing: Free plan available for teams with fewer than 10 developers; it includes Standard-plan features except HRIS integrations and Swarmia AI. Standalone feature plans start at $5/developer/month (AI adoption and cost) or $9/developer/month (developer surveys), billed annually. The Standard plan is $45/developer/month and Enterprise is $55/developer/month, both billed annually.
G2 rating: 4.4/5
3. DX
DX is a developer intelligence platform that combines software delivery data with developer-reported experience insights. Its DX Core 4 framework measures productivity across speed, effectiveness, quality, and impact. The platform also includes PlatformX for real-time feedback on platform team services and Data Studio for custom analysis.
Best for: Organizations that need to understand whether delivery problems come from unclear requirements, tooling friction, process overload, or capacity constraints, not just workflow metrics.
Key features
- Developer experience Snapshots and structured surveys
- DX Core 4 productivity measurement framework
- Developer Experience Index (DXI) and benchmarking
- PlatformX for real-time platform team feedback
- AI insights and recommendations
Why choose DX: When workflow metrics alone can't explain a delivery slowdown, developer sentiment can. DX fills that gap by pairing operational telemetry with research-backed experience measurement, which gives PMs a more complete picture before escalating or adjusting scope.
DX pricing: DX does not display pricing on its website. Contact the sales team for a quote.
G2 rating: 4.6/5
4. Jellyfish
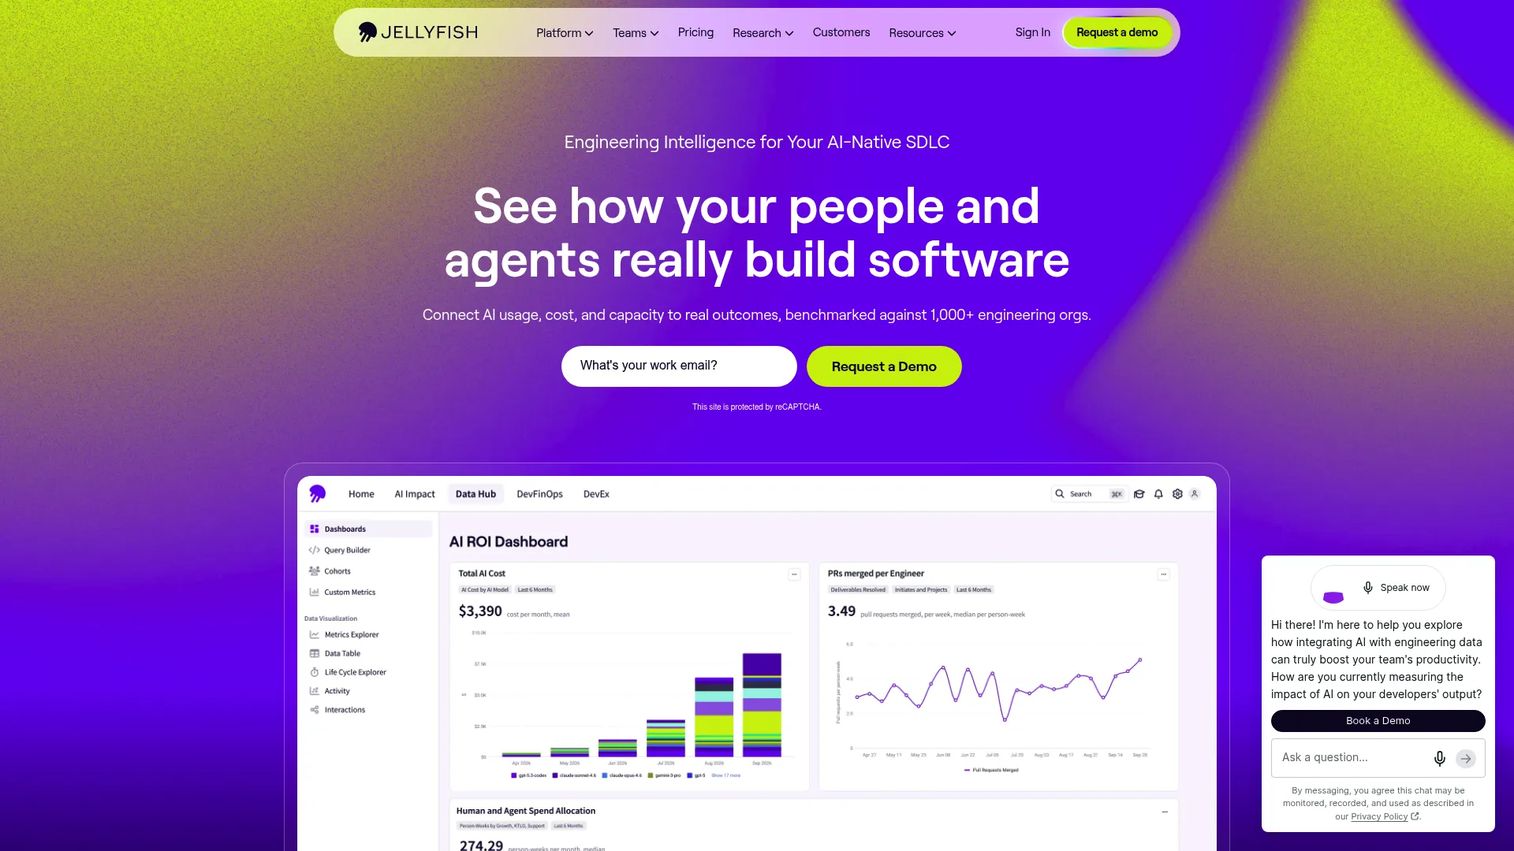
Jellyfish is an engineering management platform that connects engineering work, resource allocation, and delivery performance to business priorities. It covers DORA, SPACE, and AI metrics alongside portfolio reporting and DevFinOps capabilities including software capitalization and R&D tax credit support. Developer experience surveys and team health insights are also included.
Best for: Product and engineering executives managing investment allocation across product work, reliability programs, platform initiatives, and technical debt.
Key features
- Engineering capacity and resource allocation reporting
- Investment allocation views across work categories
- Portfolio planning dashboards with scenario planning
- DORA, SPACE, and AI metrics
- DevFinOps reporting for capitalization and R&D credits
Why choose Jellyfish: Jellyfish is the right choice when the primary problem is making engineering time legible to business and finance stakeholders. Its investment planning capabilities support the kind of tradeoff conversations that happen at the VP and CTO level, not just in sprint reviews.
Jellyfish pricing: Jellyfish uses modular, seat-based pricing across three modules (AI Impact, Developer Productivity, and DevFinOps). No numeric pricing is shown on the website. Contact sales for a quote.
G2 rating: 4.5/5
5. Allstacks
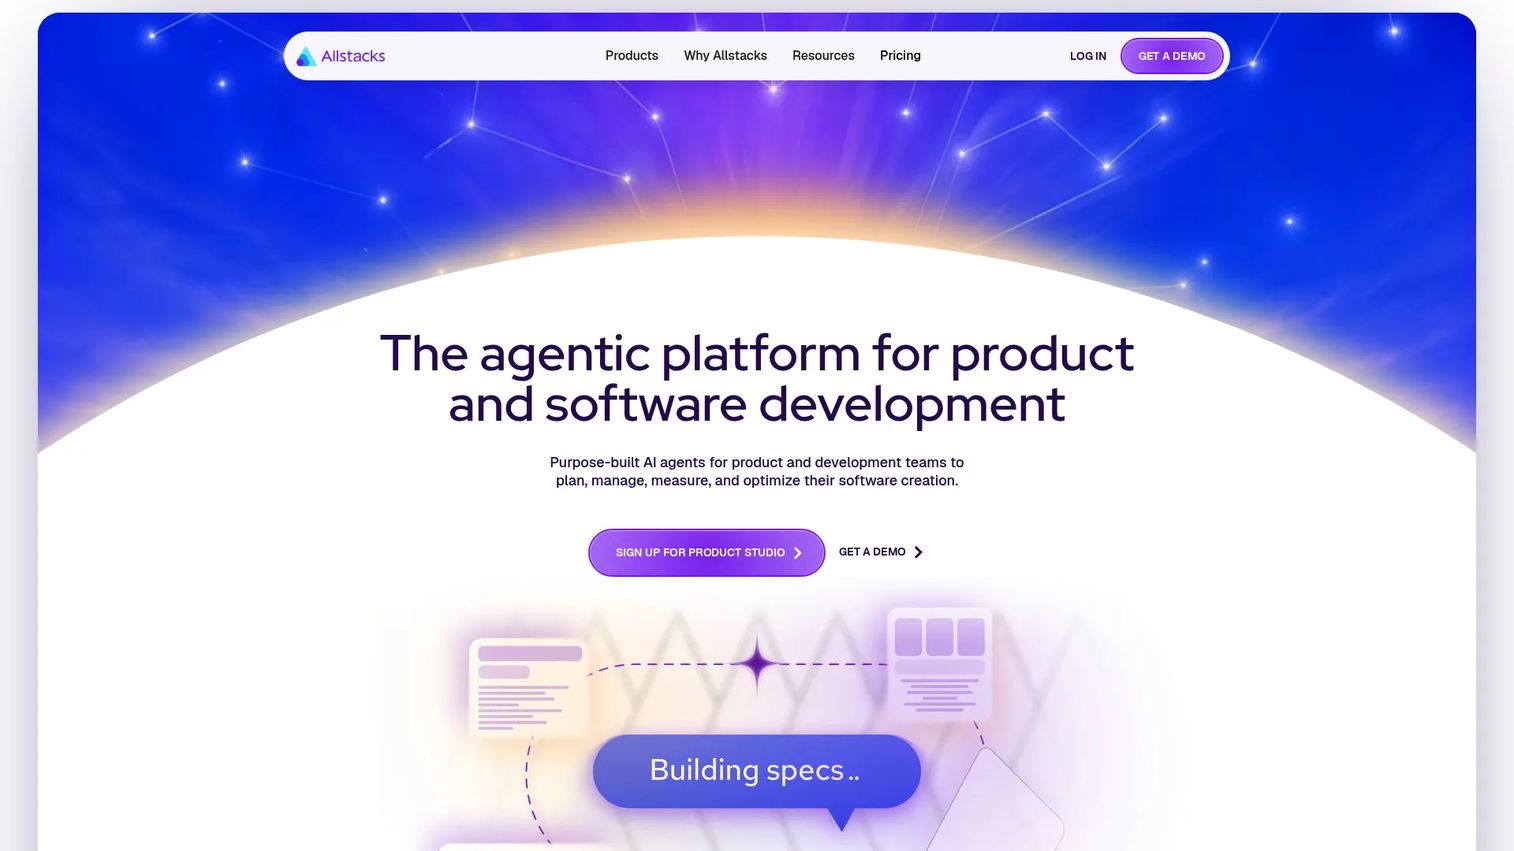
Allstacks is an agentic platform for product management and software development that connects lifecycle data to help teams plan, manage, measure, and optimize software delivery. Its Product Studio uses adversarial AI reviewers to assess requirements for security, architecture, feasibility, and go-to-market readiness. A Context Graph normalizes data across planning, engineering, delivery, and customer systems.
Best for: Product managers and engineering leaders managing multi-team roadmaps who need delivery forecasting and portfolio risk analysis before status meetings surface the problem.
Key features
- AI-assisted product and requirements planning (Product Studio)
- Delivery forecasting and scenario planning
- Portfolio risk analysis and initiative tracking
- Software Engineering Intelligence and cost capitalization
- Integrations with Jira, GitHub, GitLab, Azure DevOps, Linear, Slack, and more
Why choose Allstacks: The planning-intelligence focus sets Allstacks apart for PMs who want roadmap confidence rather than raw engineering activity metrics. It fits teams where dependency visibility and risk communication matter more than individual throughput measurement.
Allstacks pricing: Product Studio Starter is currently free with unlimited usage. Growth is $400/year/contributor and Enterprise is $600/year/contributor (both annual). A Standalone Software Cost Capitalization plan is $200/year/contributor. Bundle pricing is available.
G2 rating: 4.5/5
6. Faros AI
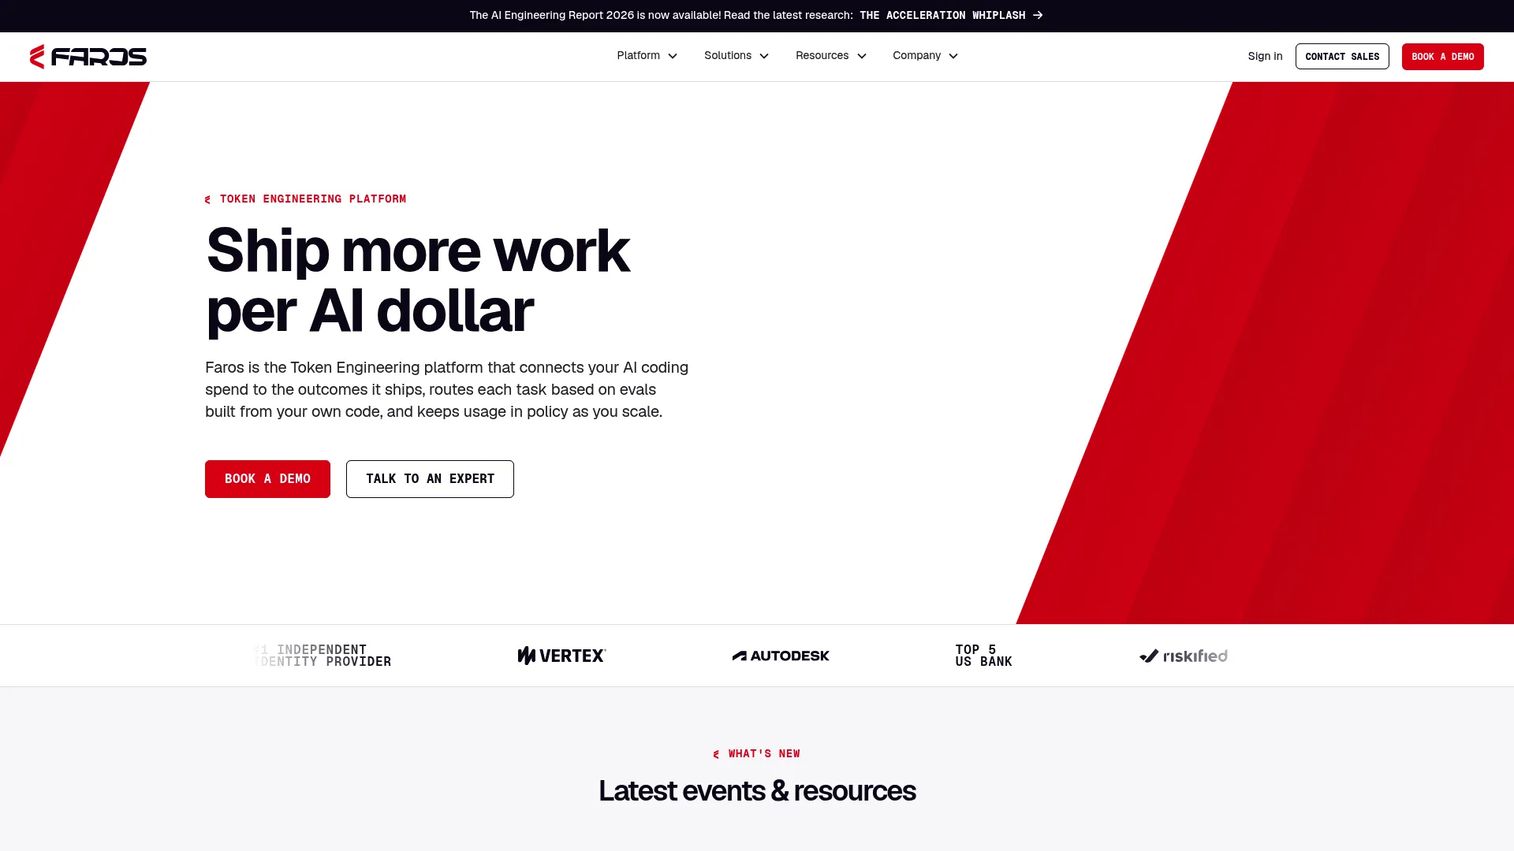
Faros AI is an enterprise software engineering intelligence platform that connects engineering data across source control, ticketing, CI/CD, and incident management to optimize productivity, AI workflows, costs, and governance. Its Engineering World Model links engineering semantics, operational data, and AI token flow. Time Machine lets teams evaluate model routes and workflow fixes using historical data before applying changes.
Best for: Engineering operations and data teams at large organizations who need configurable analytics across complex tool stacks and want to govern AI coding tool usage at scale.
Key features
- Engineering World Model connecting operational data and token flow
- Time Machine for historical engineering data evaluation
- Custom metrics, dashboards, and natural-language assistant
- AI model policy enforcement, budget management, and compliance controls
- Integrations across source control, ticketing, CI/CD, and incident tools
Why choose Faros AI: Faros AI works best when a team can own metric definitions, data governance, and reporting design. The flexibility is the point, but it requires engineering operations maturity to get full value. For teams with that capability, it's the most configurable option on this list.
Faros AI pricing: Consumption-based pricing. No tiers are shown on the website. Contact sales for a quote.
G2 rating: 4.8/5
7. Uplevel
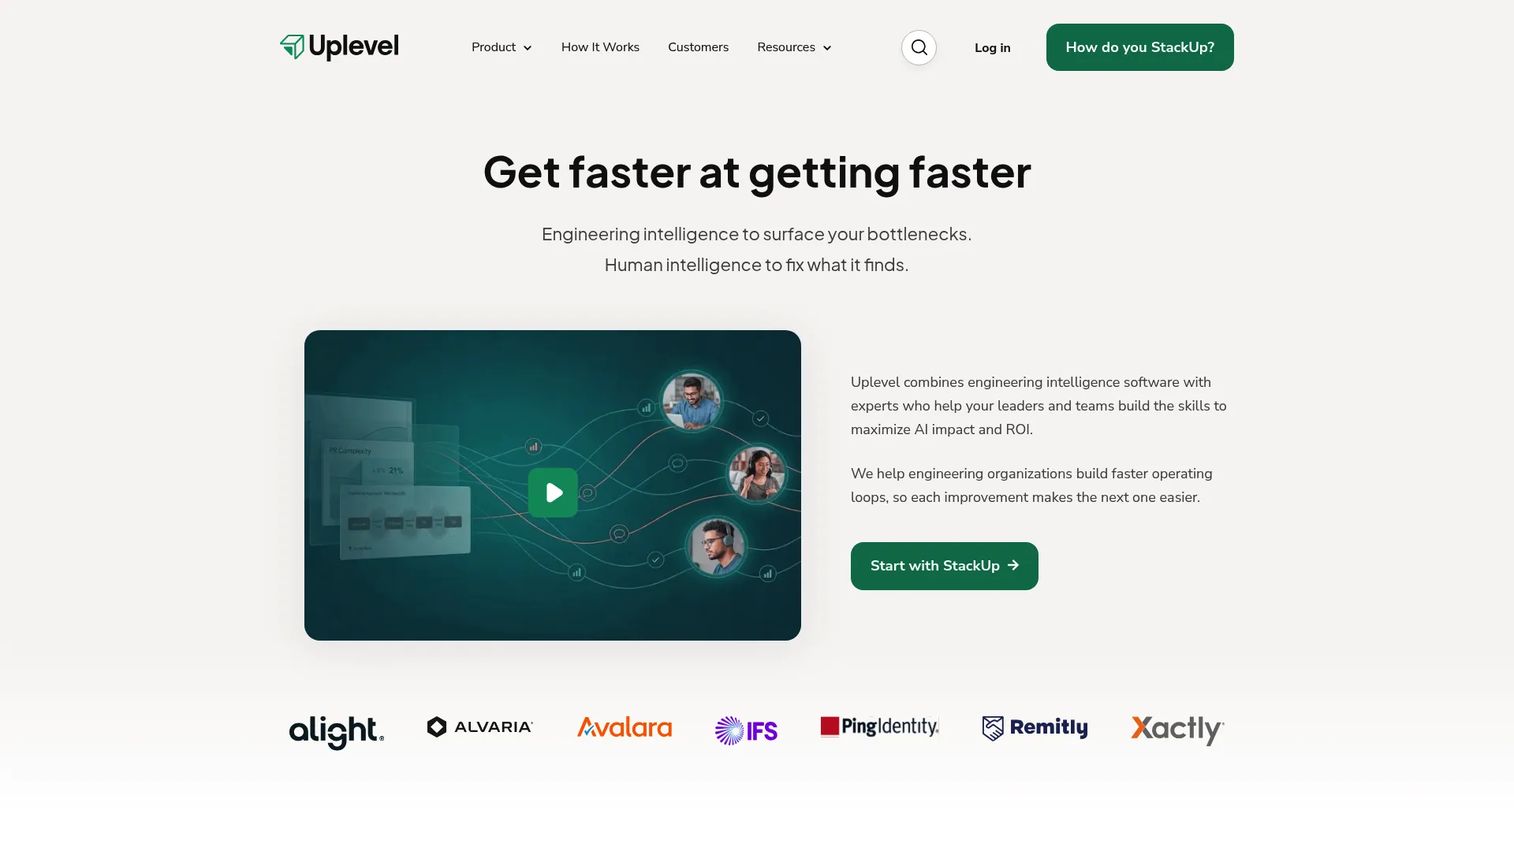
Uplevel combines engineering intelligence software with expert-guided analysis to help organizations identify delivery bottlenecks, measure AI impact, and build continuous-improvement capability. It uses ML-based work categorization for Jira data and tracks time allocation, meeting load, chat interruptions, PR complexity, and review wait time. Expert root-cause diagnosis and prioritized improvement roadmaps are included in paid engagements.
Best for: Enterprise engineering organizations that want data-informed bottleneck diagnosis paired with structured expert guidance rather than a self-serve dashboard.
Key features
- Quantitative and qualitative engineering analytics
- ML-based Jira work categorization
- PR complexity, review wait, and handoff-delay analysis
- AI impact tracking and benchmarking
- Integrations with Jira, GitHub, GitLab, Azure DevOps, Slack, Google Calendar, and more
Why choose Uplevel: If your team has already accumulated dashboards but still can't explain recurring delivery delays, Uplevel's expert-led model adds a layer of diagnosis that self-serve tools don't. It's more of a structured engagement than a pure platform, which suits organizations ready to commit to a multi-year improvement program.
Uplevel pricing: StackUp is a free 45-minute AI spend strategy session. GearUp is a 45-day expert-led team assessment. Uplevel Enterprise is a scoped, multi-year engagement. Numeric pricing for paid tiers is not shown on the website.
G2 rating: 4.1/5
8. Hatica
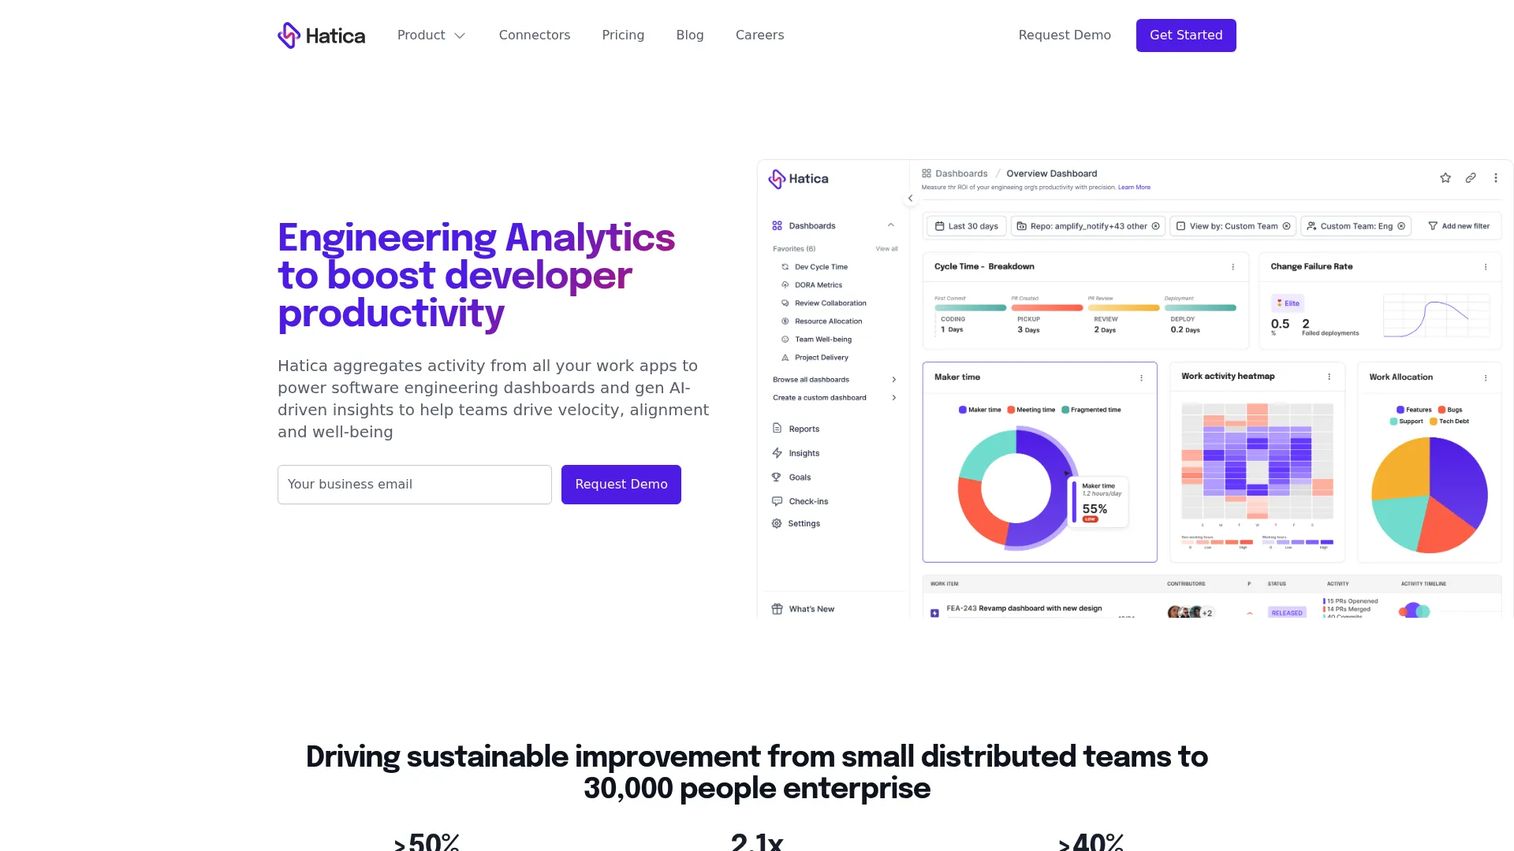
Hatica is an engineering analytics platform that combines Git, project management, collaboration, and CI/CD data to provide software engineering productivity insights. It includes DORA, cycle time, code review, sprint, velocity, throughput, and wellbeing metrics alongside automated async stand-ups, check-ins, and scheduled reports. A custom query builder and AI-powered natural-language insights are also available.
Best for: Engineering and product leaders who need delivery intelligence without ignoring workload signals, particularly in organizations where sustainable pace and team retention are active concerns.
Key features
- DORA metrics, cycle time, and code review analytics
- Wellbeing metrics and workload balance indicators
- Automated async stand-ups and custom check-ins
- Custom dashboards and natural-language query builder
- Integrations with GitHub, GitLab, Jira, Asana, Slack, Zoom, and Google Calendar
Why choose Hatica: Hatica ties delivery performance to the conditions that produce it, which matters when you want to understand whether a throughput problem is a process issue, a capacity issue, or a burnout risk. Keep the framing at team level; the platform is designed for systemic insight rather than individual scorecards.
Hatica pricing: Free plan includes activity dashboards, unlimited team members and data sources, DevEx surveys, and automated stand-ups. Pro is $19/member/month and Business is $29/member/month. Enterprise uses custom pricing and adds self-hosted deployment, a product API, data warehouse sync, and five-year data history.
G2 rating: 4.7/5
9. Cortex
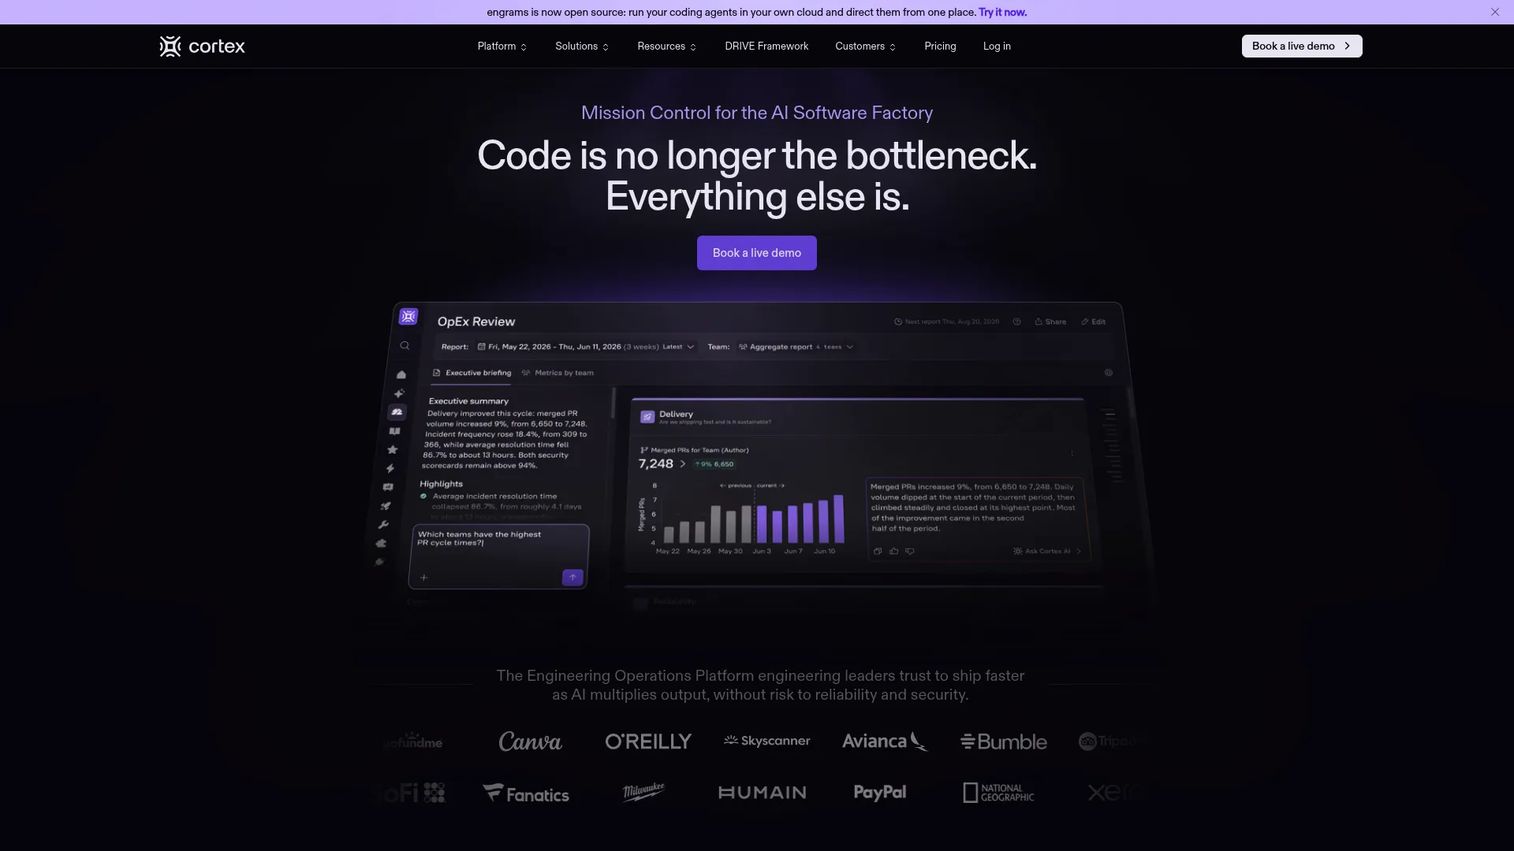
Cortex is an AI-powered internal developer portal and engineering operations platform for managing software services, enforcing standards, and enabling developer self-service. It centers on a service and resource catalog with ownership and dependency visibility, scorecards for production readiness and compliance, and self-service scaffolding for creating services and provisioning infrastructure. Engineering intelligence signals add delivery context alongside service health.
Best for: Organizations building a formal platform engineering program or internal developer portal where service ownership, quality standards, and self-service workflows are the primary problems.
Key features
- Service and resource catalog with ownership and dependency mapping
- Scorecards for production readiness, security, and compliance standards
- Self-service service scaffolding and infrastructure provisioning
- Initiative tracking and engineering intelligence context
Why choose Cortex: Cortex fits when the problem includes service maturity and ownership confusion, not only delivery metrics. If your engineering organization struggles with unclear ownership, inconsistent quality standards, or a high volume of one-off infrastructure requests, Cortex addresses those constraints directly.
Cortex pricing: Custom per-seat pricing that scales with organization size. Contact Cortex for a quote.
G2 rating: 4.4/5
10. Pluralsight Flow
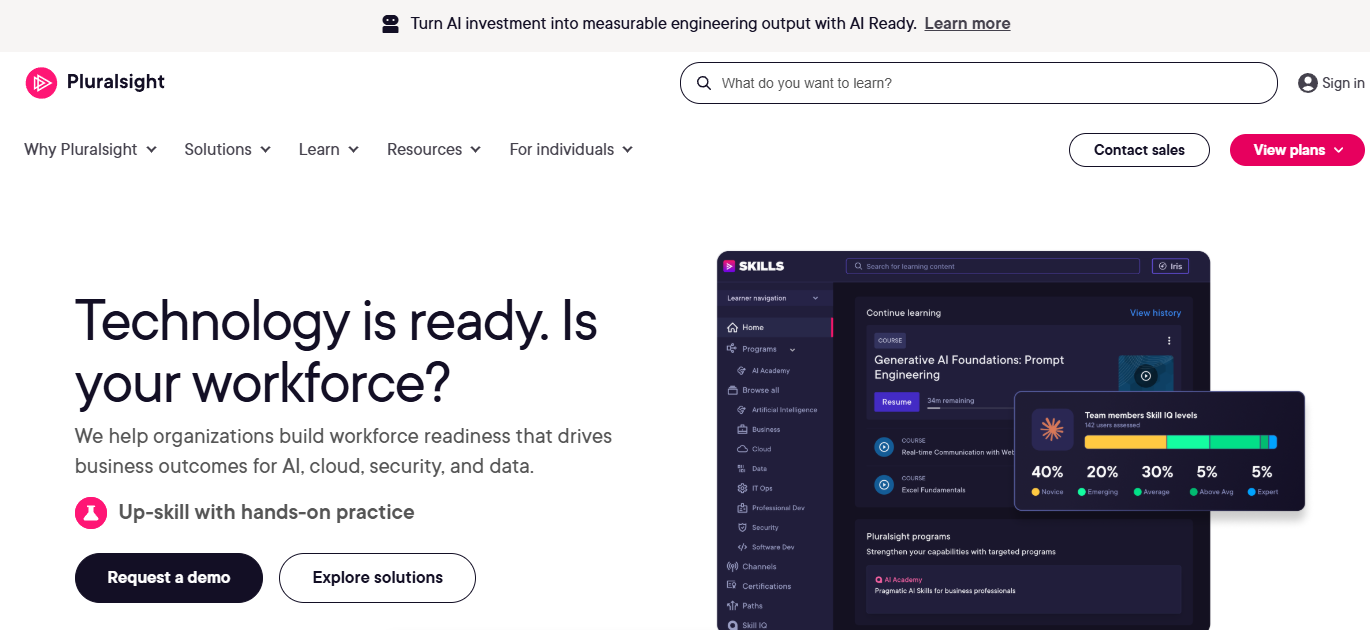
Pluralsight Flow is engineering intelligence software that analyzes code repository and Agile workflow data to improve software delivery and team health. Core reports include DORA metrics, pull request workflow and review analysis, Work Log, Ticket Log, Retrospective, Sprint Movement, and Investment Profile. The Plus tier adds team health insights, Proficiency, and API access.
Best for: Engineering teams that want code-centric workflow analytics within an organization that already uses Pluralsight for developer skills and learning.
Key features
- DORA metrics and workflow diagnostics
- Pull request workflow and code review analysis
- Work Log, Ticket Log, and Sprint Movement reports
- Investment Profile for work categorization
- Retrospective and team health insights (Plus tier)
Why choose Pluralsight Flow: Flow is a natural fit when Pluralsight is already part of the developer enablement stack. Buyers should confirm whether its planning integrations and portfolio forecasting depth match their roadmap visibility needs before selecting it as the primary engineering intelligence layer.
Pluralsight Flow pricing: Core plan is $38/contributor/month (billed annually) and includes repository integrations, historical data import, and fundamental metrics. Plus is $50/contributor/month (billed annually) and adds team health insights, Retrospective, Proficiency, and API access.
G2 rating: 4.6/5
Considerations when choosing software engineering intelligence platforms
Measure systems, not individual activity
Choose a platform that supports team-level learning. Before signing, confirm that the default dashboards show aggregate patterns rather than per-developer rankings. Ask the vendor how their customers use the platform to run delivery retrospectives rather than performance reviews.
Audit your data coverage before evaluating dashboards
A clean dashboard depends on clean source systems. Map your planning tool hygiene, repository structure, CI/CD coverage, and incident tracking completeness before selecting a vendor. Missing data upstream produces misleading signals downstream, and that's an implementation problem no platform can fix on its own.
Match the platform to the decision you're trying to improve
If the primary need is roadmap forecasting, prioritize predictive planning views and portfolio risk analysis. For developer friction and retention concerns, prioritize developer experience measurement. For service ownership and quality standards, evaluate portal and scorecard capabilities. Buying a platform that solves the wrong problem is an opportunity cost you'll feel in the next planning cycle.
Define metric ownership and a review cadence before rollout
A platform becomes useful when leaders review it consistently during planning and delivery reviews. Assign owners for metric definitions and data hygiene before onboarding. Teams that skip this step end up with dashboards nobody looks at.
Evaluate security, privacy, and access controls
Engineering intelligence platforms ingest sensitive operational data. Confirm data retention policies, role-based access, SSO support, audit logging, and deployment options (SaaS vs. on-premises) before involving procurement. For organizations with strict compliance requirements, ask specifically about which data leaves your environment and how it's stored. Related reading on AI governance tools covers complementary evaluation criteria for data-sensitive tooling.
Conclusion
The right software engineering intelligence platform earns its place when it helps product and engineering teams make a better delivery decision before a roadmap slips, capacity disappears, or a launch becomes a recovery plan.
For delivery-flow visibility, start with LinearB. For a practical entry point at smaller team sizes, Swarmia's free plan removes the barrier. DX adds developer experience depth when workflow metrics alone can't explain a slowdown. Jellyfish and Allstacks serve distinct planning needs: Jellyfish for investment and capacity decisions at the executive level, Allstacks for multi-team roadmap forecasting. Faros AI fits data-mature organizations that need configurable analytics across a complex tool stack. Uplevel and Hatica add operational and team-health signals for organizations where sustainable pace is as important as throughput. Cortex belongs in the conversation when service ownership and platform engineering standards are the underlying problem. Pluralsight Flow suits teams already embedded in the Pluralsight ecosystem.
The most useful next step is concrete: Identify one recurring delivery decision that currently lacks trustworthy evidence, then evaluate which platform addresses that specific gap first.
For more on adjacent planning tooling, see guides to analytics platforms and AI software testing tools that complement engineering intelligence programs.
Start your journey with Guideflow today!
FAQs
A software engineering intelligence platform connects data from planning tools, code repositories, CI/CD pipelines, incident management, and collaboration systems to give teams visibility into delivery performance, capacity, risk, and developer experience. It differs from project management software by pulling evidence from the actual delivery system rather than tracking planned tasks. The output supports team-level decisions about roadmaps, release confidence, and investment allocation.
Project management tools track what's planned and whether tasks are marked complete. Engineering intelligence platforms add evidence from code reviews, build pipelines, deployments, incidents, and developer workflows. That difference matters for a PM: A project tool can show all stories closed while a platform shows that PR cycle time doubled, review wait is climbing, and deployment frequency dropped, which is the actual delivery picture.
Start with delivery predictability (how reliably does the team ship to forecast?), pull request cycle time, work aging, deployment frequency, and unplanned work as a share of total capacity. Add initiative-level risk signals once those baselines are clean. Review metrics in context of team size, product complexity, and release cadence rather than comparing to universal benchmarks, which rarely account for the specifics of your system.
Yes, but the measurement should focus on outcomes: Lead time changes, rework rates, review burden, defect escape rates, and developer experience scores. According to JetBrains' State of Developer Ecosystem (2025), 85% of developers regularly use at least one AI tool, which makes adoption widespread but impact measurement still inconsistent. Volume of AI-generated code is a poor proxy for value; cycle time and quality metrics are more reliable signals.
No. Individual rankings based on commits, tickets closed, or code review counts distort behavior and reduce trust, which degrades the data quality the platform depends on. The value of engineering intelligence comes from understanding team systems, workflow patterns, and delivery bottlenecks. JetBrains' 2025 research found that 66% of developers don't believe their current metrics accurately reflect their contributions, so adding another individual ranking layer makes that problem worse, not better.
At minimum: Git providers (GitHub, GitLab, Bitbucket, Azure DevOps), planning tools (Jira, Linear, Azure Boards), CI/CD pipelines, and incident management platforms. Stronger programs also connect HR or workforce data for capacity context, developer experience survey tools, and communication platforms like Slack for alert delivery. Confirm that the integrations you depend on are available in the tier you plan to purchase, not only in the enterprise plan.
Technical setup, connecting repositories and planning tools, can begin within days. Meaningful adoption takes longer: Typically four to eight weeks to establish metric definitions, align stakeholders, and build a review cadence. Start with one decision area, pull request flow or roadmap forecasting, rather than trying to instrument everything at once. Related reading: account planning software covers how similar staged rollout thinking applies to other planning tooling.
DORA metrics (deployment frequency, lead time for changes, change failure rate, and mean time to recovery) measure delivery system performance. Developer experience metrics capture friction, satisfaction, tooling quality, and cognitive load. Both matter for a complete picture: DORA tells you how the system performs, and developer experience tells you the conditions under which it operates. Strong programs use both without treating either as a proxy for individual performance.