A defect doesn't announce itself. It drifts. A tool wears half a thousandth at a time, a fixture loosens by degrees, a supplier's material shifts a fraction outside nominal. By the time someone catches it in a spreadsheet export three shifts later, you've already scrapped a bin of parts and shipped a few you shouldn't have.
That gap between when a process starts drifting and when a human notices is where quality budgets go to die. Most quality teams are still stitching together control charts in one place, machine exports in another, and manual alerts in a third. The data exists. It just arrives too late to act on.
That's the problem statistical process control software is built to close. The market reflects the urgency: the global SPC software market was valued at USD 1.44 billion in 2025 and is projected to reach USD 3.15 billion by 2034, a CAGR of roughly 9.4%, according to Intellectual Market Insights (2025). Manufacturers are buying because manual inspection tracking no longer keeps pace with the speed at which modern lines run.
If you're evaluating tools the way a product manager evaluates onboarding software, the same instincts apply: you want faster time to signal, less manual overhead, and something that fits the stack you already run. The same discipline that goes into choosing ab testing tools or ai governance tools applies here, match the tool to your data source and your reporting maturity, not the loudest feature list.
What's inside
This guide compares 7 SPC software tools built for manufacturing and quality teams. It's written for quality engineers, process improvement leads, and plant managers who are done reconciling defect data across spreadsheets, gages, and machine logs.
We selected and ranked each tool against six practical criteria: live control charts, alerts and notifications, data collection methods, analytics depth, dashboards and reporting, and workflow fit. The list deliberately spans three architectures, Excel-native add-ins, cloud-based platforms, and device-integrated systems that pull directly from CMMs, gages, and PLCs, so you can match a tool to how your team actually collects and reviews data.
TL;DR
- Best for live process monitoring: Minitab Real-Time SPC, automated control charts, dashboards, and email or text alerts for out-of-control events.
- Best for Excel-native teams: SPC for Excel, full control charts, capability analysis, and Gage R&R inside Microsoft Excel, one-time license from $329.
- Best for device and machine automation: Prolink Software, real-time SPC charting with automated data collection from CMMs, gages, and PLCs.
- Best for cloud reporting across sites: Net-Inspect SPC Software, cloud dashboards, electronic inspection plans, and capability analysis, rated 4.3/5 on G2.
- Best for enterprise quality intelligence: InfinityQS, real-time SPC and quality data collection across plants and lines.
- Best for advanced statistical depth: QS-STAT, process capability analysis validated to ISO standards for engineering-driven quality teams.
What SPC software is
Statistical process control software monitors manufacturing process variation in real time, flags when a process drifts outside expected limits, and gives quality teams the charts, alerts, and analytics they need to act before defects reach the customer.
Its job is straightforward: watch the process, surface drift early, and support faster quality decisions on the shop floor. Instead of catching problems in an end-of-shift report, teams see a point breach a control limit the moment it happens.
Good SPC software produces a consistent set of outputs. The core capabilities buyers should expect include:
- Real-time SPC control charts: X-bar, R, individuals, moving range, and attribute charts that update as data lands.
- Alerts and notifications: email, text, or on-screen warnings for out-of-control points, specification breaches, and action-limit events.
- Automated data collection: direct capture from gages, CMMs, PLCs, serial devices, and enterprise databases, not just manual entry.
- Dashboards and reporting: live process visibility for operators, engineering, and management, plus exportable reports.
- Root-cause analysis: Pareto charts, out-of-control rule violations, and event logs that point to the source of variation.
- Capability analysis: Cp, Cpk, Pp, Ppk, and related indices to judge whether a stable process can actually meet spec.
- Excel or spreadsheet compatibility: import, export, or native add-in workflows for teams that live in spreadsheets.
- Multi-source manufacturing data support: the ability to pull from many machines, gages, and files into one quality picture.
Why it matters for manufacturing teams
Manual inspection tracking drifts the same way processes do. Someone forgets a reading, a chart lags a shift, a spec limit gets copied wrong. SPC software removes that drift by making variation visible as it happens, which is the difference between adjusting a machine now and scrapping a lot tomorrow.
The payoff shows up on the floor, not just in a report:
- Faster detection of out-of-control conditions before they become scrap or rework.
- Fewer manual charting errors and less time spent reconciling data.
- Clear, standardized capability evidence for audits and customers.
- Earlier intervention on tool wear, fixture drift, and material variation.
When to use SPC software
Monitor process stability in real time
Live control charts and alerts matter most on processes that move fast or drift silently. If a CNC line, injection molder, or filling process can produce hundreds of parts before a manual check, real-time SPC software gives you the drift detection and rapid intervention that end-of-shift charting can't. The alert fires, the operator adjusts, and the bad parts never get made.
Standardize quality reporting across plants
Multi-site manufacturers rarely have a data problem so much as a consistency problem. Each plant charts differently, defines limits differently, and reports on its own cadence. A cloud SPC platform with shared dashboards, role-based permissions, and centralized visibility gives leadership one quality picture instead of ten. Capability comparisons across sites become possible instead of theoretical.
Replace manual spreadsheet tracking
Spreadsheets are convenient right up until they aren't. They're easy to start, hard to trust at scale, and prone to broken formulas and stale limits. Teams deep in an Excel workflow can either keep the spreadsheet and add SPC rigor on top of it, or move to a system that automates collection and charting. Both are valid, the right call depends on volume and how many people touch the data.
Comparison table
The table below ranks the 7 tools by relevance to the SPC software keyword and workflow fit. Intent labels describe the primary architecture, live monitoring, spreadsheet-first, device automation, or cloud analytics, so you can shortlist by how your team collects data. Where a vendor does not publish a price or a current G2 rating, that cell is left open rather than estimated.
| # | Product | Intent | Key differentiation | Pricing | G2 rating |
|---|---|---|---|---|---|
| 1 | Minitab Real-Time SPC | Live monitoring | Automated charts, dashboards, and email/text alerts | Contact vendor | Not published |
| 2 | SPC for Excel | Spreadsheet-first | Full SPC and analysis inside Microsoft Excel | From $329 one-time | 3.8/5 |
| 3 | Prolink Software | Device automation | Real-time charting with automated device data collection | Quote-based, 15-day trial | Not published |
| 4 | Net-Inspect SPC Software | Cloud analytics | Cloud SPC with inspection plans and capability analysis | Contact vendor | 4.3/5 |
| 5 | InfinityQS | Enterprise quality | Real-time SPC across plants and lines | Free and Premium tiers | 4.0/5 |
| 6 | QS-STAT | Statistical depth | ISO-validated capability analysis | Contact vendor | Not published |
| 7 | WinSPC | Shop-floor SPC | Real-time collection from virtually any source | $1,600 one-time | 3.0/5 |
1. Minitab Real-Time SPC
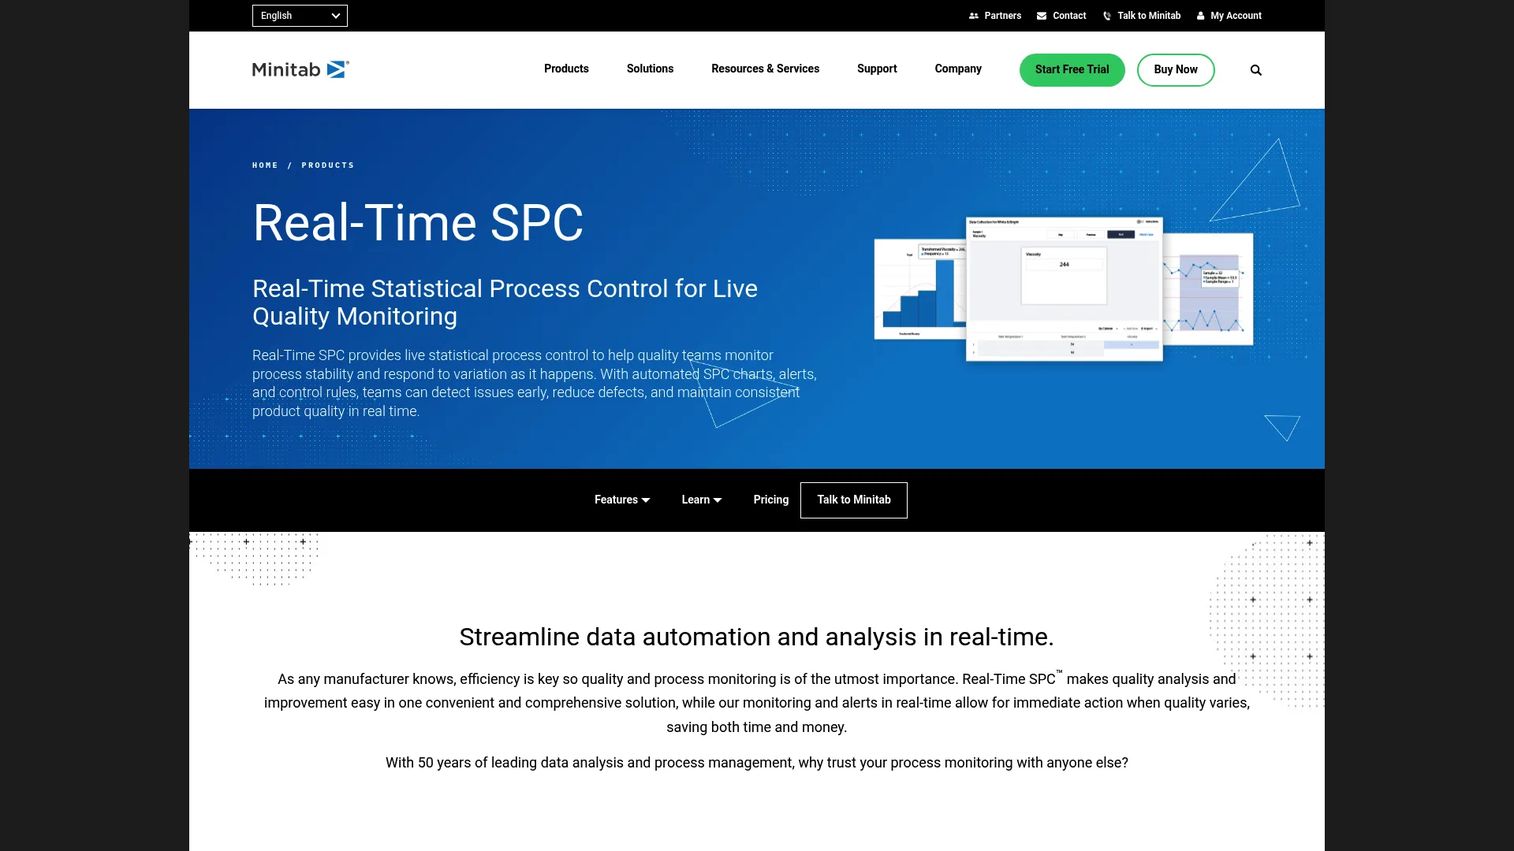
Minitab Real-Time SPC is cloud-based real-time statistical process control software built for teams that need live quality monitoring instead of after-the-fact reporting. It automates SPC charts and dashboards so operators, engineers, and administrators each see the view that matters to their role, and it ties into the wider Minitab analytics stack for teams that want deeper statistical work downstream.
Best for: Manufacturing quality teams that need live SPC monitoring and alerts across the shop floor.
Key strengths
- Automated charts and dashboards: SPC control charts and real-time dashboards update automatically, so reporting and insight sharing happen without manual rebuilds.
- Multi-event alerts: email and text alerts fire for out-of-control, specification-limit, action-limit, and station-shutdown events.
- Role-based portals: separate portals for operators, engineering, and administration keep each audience focused on what they need.
Why choose Minitab Real-Time SPC: This fits teams that already value analytical rigor and want their live monitoring to feed the same discipline. Capability analysis and Pareto charts sit alongside the real-time charts, and single-click access to the broader Minitab environment means process data doesn't dead-end at the dashboard. If your quality group is maturing beyond basic charting into real statistical analysis, this is a natural fit.
Minitab Real-Time SPC pricing: Minitab does not publish a public price for Real-Time SPC on its product page. The site routes evaluators to a contact or try-and-buy flow rather than displaying tier pricing, so plan to request a quote scoped to your seat count and deployment.
2. SPC for Excel
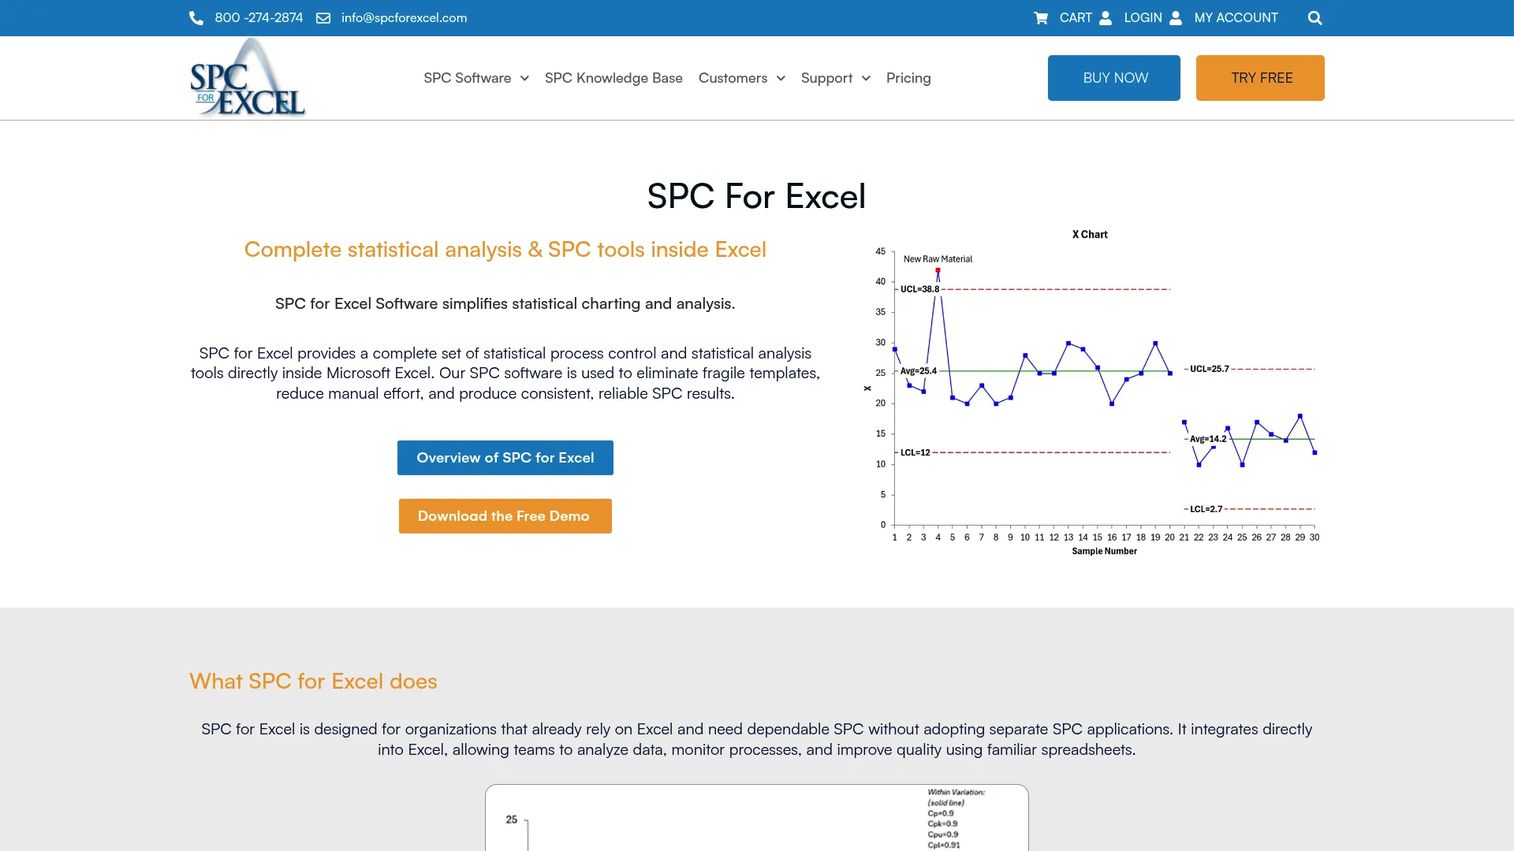
SPC for Excel delivers a full set of statistical process control and analysis tools directly inside Microsoft Excel. Instead of learning a separate platform, your team stays in the spreadsheet they already know and adds control charts, capability studies, and measurement systems analysis through an add-in. For quality teams that live in Excel, this closes the gap between convenience and statistical rigor.
Best for: Quality teams that want SPC and process analysis without leaving Excel.
Key strengths
- Native control charts: build X-bar, R, individuals, attribute, and other SPC control charts directly on spreadsheet data.
- Process capability analysis: run Cp, Cpk, and related capability studies inside the workbook you already report from.
- Gage R&R and MSA: measurement systems analysis, including Gage R&R, lives in the same add-in for full measurement confidence.
Why choose SPC for Excel: This is the pragmatic pick for smaller or spreadsheet-centered quality teams that don't want another login or a separate reporting layer. The Excel integration means analysts keep their existing workflow, and the one-time license model avoids recurring subscription overhead. It performs best where data volume is manageable and a handful of people own the analysis.
SPC for Excel pricing: Licensing is a one-time per-user fee with no stated annual or maintenance cost. A single user license starts at $329 (USD), with volume discounts scaling down to $296 per user for 2 to 10 users, $279 for 11 to 20, and $263 for 21 to 50. A site license runs $5,900, and upgrades are $145 per user. There is no free tier. The tool holds a 3.8/5 rating on G2.
3. Prolink Software
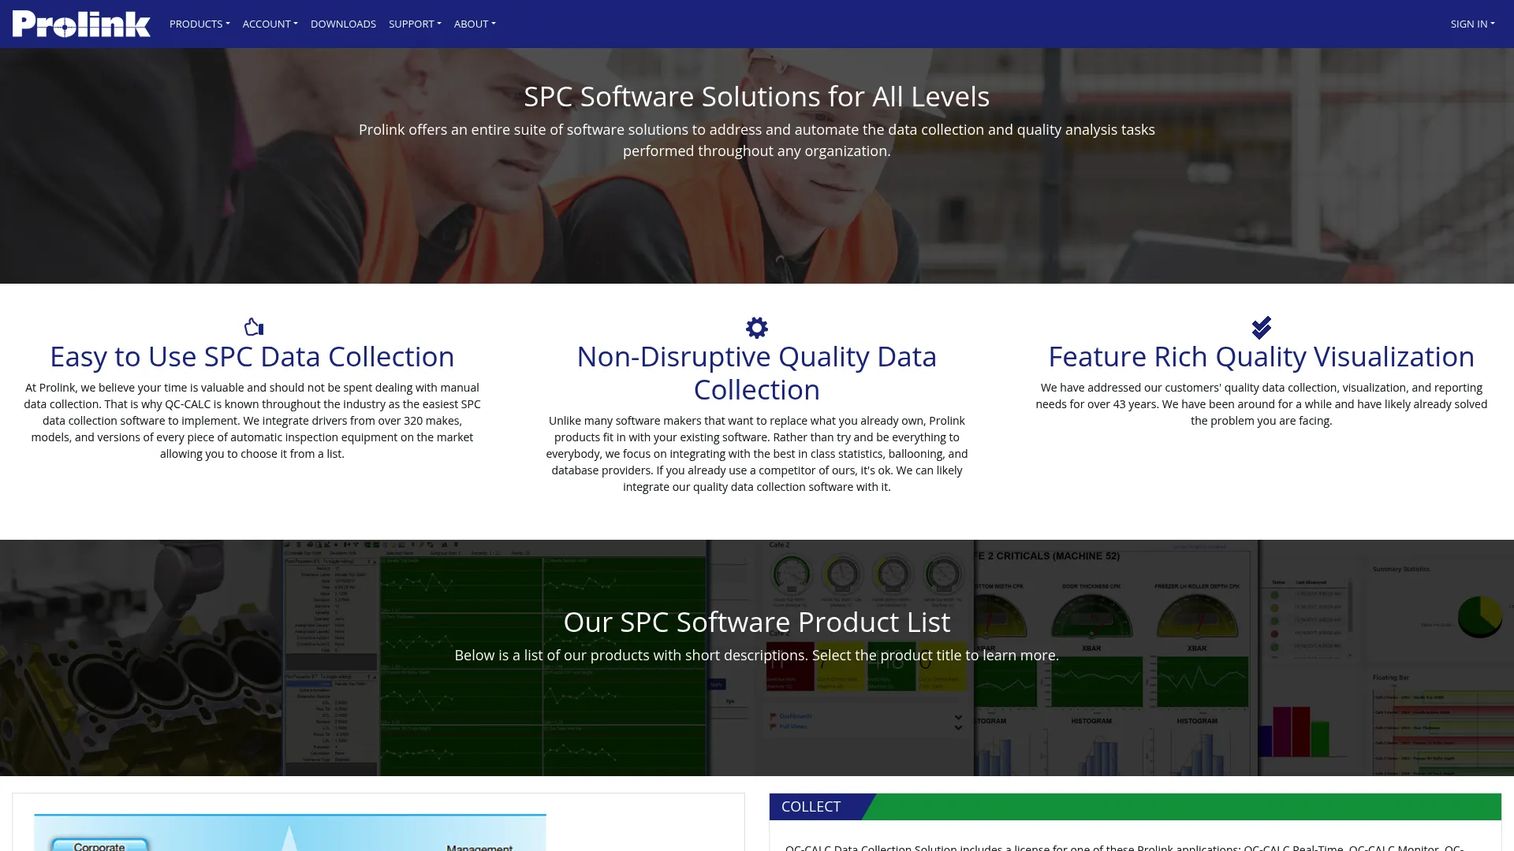
Prolink Software is an industrial quality-control and SPC vendor built around real-time charting and automated data collection from the devices already on your floor. Its strength is the device integration story: instead of typing readings by hand, measurements flow directly from CMMs, gages, and PLCs into live charts, with automated export and reporting layered on top.
Best for: Manufacturers that need SPC, automated device data collection, and reporting in one system.
Key strengths
- Real-time SPC charting: control charts populate live as measurements arrive from connected equipment.
- Automated device data collection: pull directly from CMMs, gages, PLCs, and serial devices instead of manual entry.
- Automated export and reporting: dashboards and statistical analysis feed reports without manual reconciliation.
Why choose Prolink Software: This fits teams whose biggest bottleneck is getting measurement data off devices and into charts without transcription errors. The non-disruptive integration angle matters here, Prolink is built to sit alongside existing inspection equipment rather than forcing a rip-and-replace. If your quality data is trapped inside gages and CMMs, this is the automation layer that frees it.
Prolink Software pricing: Prolink does not publish a public license or subscription price. The product pages point to a free 15-day evaluation and quote-based purchasing, so you can trial the software before scoping a commercial agreement with sales.
4. Net-Inspect SPC Software
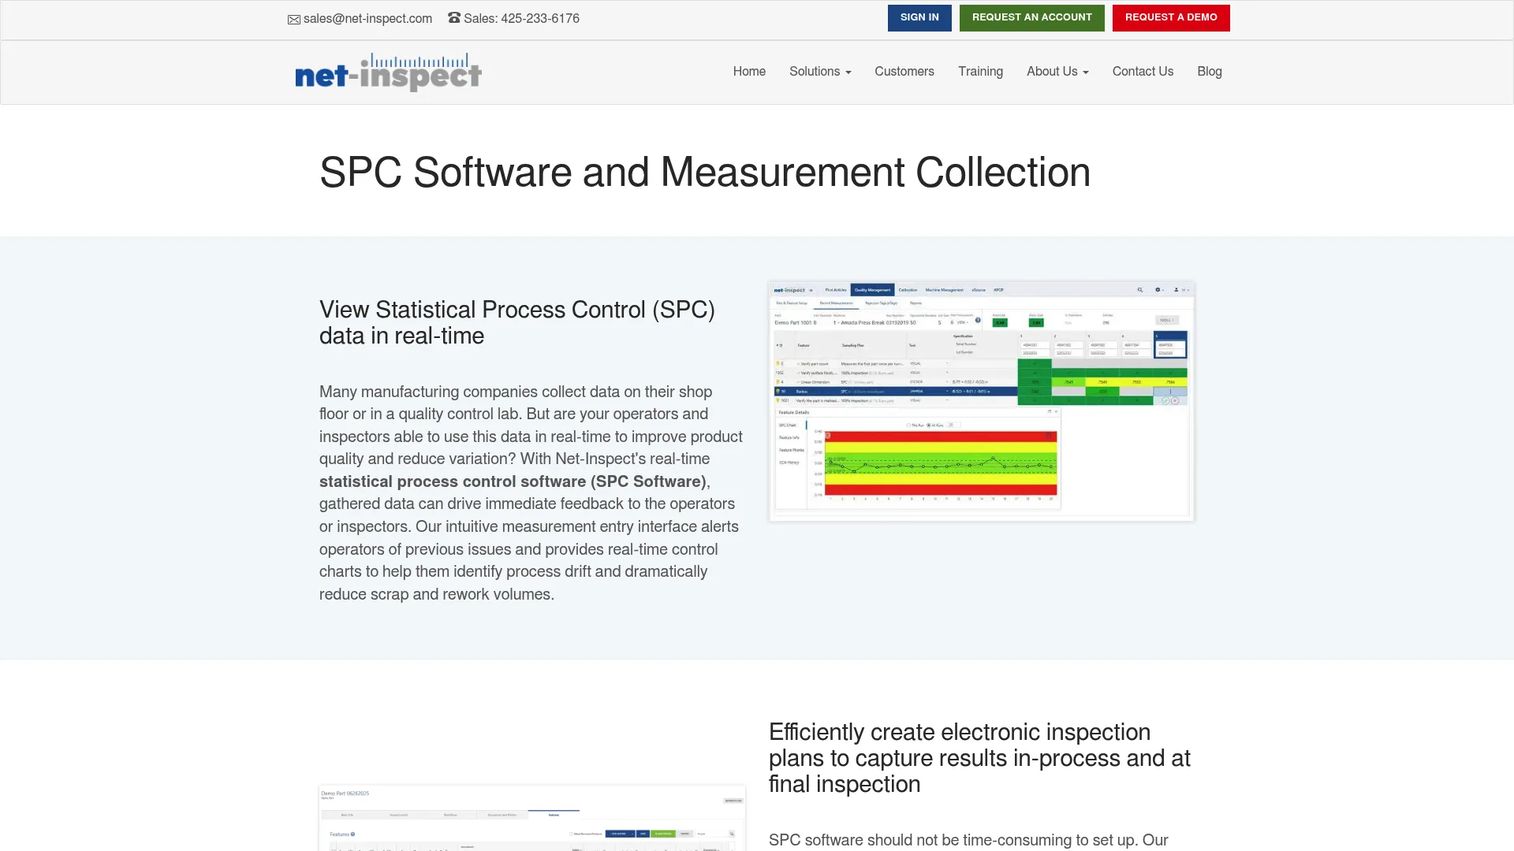
Net-Inspect SPC Software is cloud-based statistical process control built for real-time measurement collection, control charts, and capability analysis inside a broader quality and supply-chain platform. Because it's cloud-based, it fits multi-site and multi-supplier environments where central visibility matters as much as floor-level charting.
Best for: Manufacturers that need SPC within a wider quality and supply-chain management platform.
Key strengths
- Real-time SPC and control charts: live process data and charting available from any connected site.
- Electronic inspection plans: structured measurement entry through digital inspection plans keeps data clean and consistent.
- CMM and hand-tool import: pulls measurement data from CMMs and manual gages into one cloud record.
Why choose Net-Inspect SPC Software: This suits complex manufacturing operations that need more than charts, capability comparison, supplier risk, and multiple measurement sources all live in the same cloud environment. For teams standardizing quality across plants and suppliers, the analytics layer and centralized dashboards do work that a single-site tool can't. It holds a 4.3/5 rating on G2.
Net-Inspect SPC Software pricing: Net-Inspect does not display public pricing. The site directs evaluators to request a demo or contact sales for a quote scoped to site count and measurement volume.
5. InfinityQS
InfinityQS is manufacturing quality software focused on real-time SPC, data collection, and quality intelligence across plants and lines. Its enterprise angle is centralized process control: instead of each line running its own charts, data collection and SPC roll up into standardized dashboards, alerts, and reporting that leadership can act on across the whole operation.
Best for: Manufacturers that need SPC quality management across multiple plants or lines.
Key strengths
- Real-time data collection and charts: live SPC charting fed by automated data collection across the operation.
- Dashboards, alerts, and reporting: centralized visibility with alerting and standardized reports for cross-plant teams.
- Flexible deployment: cloud and on-premise options to match security and integration requirements.
Why choose InfinityQS: This is the pick for manufacturers that need one quality standard across many sites rather than a single-line tool. Cross-plant visibility, alerting, and data standardization are the core value, and the Enact product offers a free subscription tier with assigned licenses and a monthly data-point allowance, plus a Premium upgrade path. It holds a 4.0/5 rating on G2.
InfinityQS pricing: InfinityQS exposes subscription terms but no public dollar price. Enact materials confirm a Free subscription with 2 assigned licenses and 50,000 monthly data points, and a Premium subscription for teams that outgrow those limits. Contact sales for numeric pricing scoped to your deployment.
6. QS-STAT
QS-STAT is statistical quality assurance software built to evaluate production-relevant quality data and assess process capability with real statistical depth. Where lighter tools stop at charts, QS-STAT is designed for engineering-driven quality environments that need rigorous capability analysis and standards-compliant evaluation.
Best for: Manufacturers that need statistical process qualification and quality analytics with engineering-grade rigor.
Key strengths
- Statistical evaluation of quality data: assesses production-relevant quality information statistically, not just visually.
- Process capability analysis: determines capability parameters and validates indices such as Cm/Cmk and Cp/Cpk to ISO 22514-2.
- SAP QM integration: background evaluation and reporting through SAP QM-STI for connected quality systems.
Why choose QS-STAT: Choose this when the depth of the statistics matters more than a lightweight dashboard. Automotive and other engineering-led sectors that must prove capability to formal standards get validated Cm/Cmk and Cp/Cpk calculations and standards-aligned reporting. If your quality team is run by engineers who care about the math behind the chart, this fits their bar.
QS-STAT pricing: Hexagon does not publish public pricing for QS-STAT. The product pages present a contact-sales flow, so pricing is scoped through a quote based on modules and seats.
7. WinSPC
WinSPC is real-time statistical process control software installed on shop-floor computers, where it's positioned to capture data from almost anything on the line. Its value is practical and floor-first: capture data, define alarms, monitor processes, analyze the results, and generate reports, all from the machine sitting next to the process.
Best for: Manufacturers that need real-time SPC and quality-control traceability on the shop floor.
Key strengths
- Broad data capture: collects from serial devices, text files, Excel files, machines, gauges, enterprise databases, and keyboards.
- Audit trail and event log: built-in traceability records events for compliance and root-cause analysis.
- Reporting and process analysis: dashboards, reports, and analysis tools packaged for practical floor use.
Why choose WinSPC: This fits teams that want an established, no-nonsense SPC workflow that runs where the work happens. The breadth of data sources means it slots into mixed environments without forcing every device onto one protocol, and the audit trail supports the traceability that regulated manufacturers need. Its shop-floor focus and one-time license make it a straightforward practical choice.
WinSPC pricing: WinSPC publishes a single license price of $1,600 (USD) as a one-time purchase, with volume discounts and site or corporate licensing available on request. Extended service contracts run 18% of the software list price. There is no free tier. It holds a 3.0/5 rating on G2 from a small review sample.
What to evaluate before you buy
The right SPC tool depends less on feature counts than on how your team already works. Run every shortlist candidate through these four checks.
Where your data actually lives
Map your data sources before anything else. If measurements sit inside CMMs, gages, and PLCs, prioritize automated data collection and device integration. If your team already reports from spreadsheets, Excel integration may matter more than a separate platform. The tool that matches your data source wins on adoption, not the one with the longest feature list.
Reporting and analytics depth
Decide how deep your analytics need to go. Some teams need live control charts and alerts and little else. Others need capability analysis, Pareto charts, and cross-plant capability comparison for audits and customers. Match analytics depth to your quality maturity, not to what looks impressive in a demo.
Deployment and access model
Cloud-based SPC gives you central visibility and easier multi-site rollout. On-premise gives you tighter control over data and integration. The market is splitting on this: cloud deployments rose from 28% in 2022 to 42% in 2025, while 58% of organizations still prefer on-premises for security and integration reasons, per MarketIntelo (2025). Neither is universally better, pick the one your security and IT requirements point to.
Alerts and intervention workflow
An alert only helps if it reaches the right person fast enough to act. Check how alerts and notifications route, email, text, on-screen, and whether they distinguish out-of-control points from spec breaches from action limits. The goal is faster intervention, not more noise.
Choosing the right SPC tool
There's no single best SPC software, only the best fit for your data source, reporting maturity, and where your team lives day to day.
If your team runs on spreadsheets and wants rigor without a new platform, SPC for Excel keeps you in Excel with full control charts, capability analysis, and Gage R&R. If your priority is live process monitoring with automated charts and multi-event alerts, Minitab Real-Time SPC is built for that. When measurement data is trapped in devices, Prolink Software and WinSPC both excel at pulling from CMMs, gages, PLCs, and mixed sources on the floor.
For multi-site and cloud reporting, Net-Inspect SPC Software and InfinityQS give you centralized dashboards and standardized quality across plants. And when the statistics themselves are the priority, QS-STAT delivers ISO-validated capability analysis for engineering-driven teams.
Start by mapping where your data lives and how deep your analytics need to run. Shortlist the two tools that match, run a trial or a scoped demo on real process data, and let adoption on the floor make the final call.
FAQs
There isn't one best tool, there's a best fit by need. For live process monitoring, Minitab Real-Time SPC leads with automated charts and alerts. For spreadsheet-first teams, SPC for Excel adds full statistical process control inside Excel. For device automation, Prolink Software and WinSPC pull directly from CMMs, gages, and PLCs. Match the tool to your data source first.
It depends on the tool. SPC for Excel deliberately keeps you inside Excel and adds control charts, capability analysis, and Gage R&R on top of the spreadsheet workflow. Platform tools like Minitab Real-Time SPC, InfinityQS, and Net-Inspect replace the manual spreadsheet process with automated data collection and live charting. Both approaches are valid depending on your volume and how many people touch the data.
Prioritize real-time SPC control charts, alerts and notifications, and automated data collection, these drive faster defect detection. Then weigh dashboards and reporting, root-cause analysis, and capability analysis based on your quality maturity. Integration with your existing machines, gages, and databases determines whether the tool actually gets adopted on the floor.
Yes. Most modern SPC platforms support device data collection from gages, CMMs, and PLCs, plus serial devices and enterprise databases. Prolink Software specializes in automated device collection, WinSPC captures from virtually any source including machines and gauges, and Net-Inspect imports CMM and hand-tool data into the cloud. Automated collection removes transcription errors and keeps charts current in real time.
SPC control charts monitor a process over time to detect whether it's stable and in control, they answer "is the process behaving predictably right now?" Capability analysis, using indices like Cp, Cpk, Pp, and Ppk, evaluates whether a stable process can actually meet specification limits. You need a process to be in control before capability numbers mean anything, so the two work in sequence.
Neither is universally better. Cloud-based SPC, offered by tools like Net-Inspect and InfinityQS, gives central visibility, easier multi-site rollout, and reporting from anywhere. Installed software gives tighter control over data and integration, which is why 58% of organizations still prefer on-premises per MarketIntelo (2025). Let your security, integration, and multi-site requirements decide.
Alerts turn a chart into an intervention. When a data point breaches a control limit, specification limit, or action limit, the software fires an email, text, or on-screen notification so an operator or engineer can adjust the process before more bad parts are made. Minitab Real-Time SPC, for example, sends alerts for out-of-control, specification-limit, action-limit, and station-shutdown events, routing the right signal to the right person.
Compare four things: where your data lives (spreadsheets, devices, or databases), how deep your analytics need to go (charts only versus full capability analysis), your deployment model (cloud versus on-premise), and how alerts route to the people who act on them. Then trial the shortlisted tools on real process data, because adoption on the floor, not the feature list, decides which one actually reduces defects.