

Your highest-spend landing page has a 73% bounce rate. Google Analytics confirms it. But heatmap tools show you what GA can't: nobody scrolls past section two, visitors click the pricing link 4x more than the CTA, and mobile users rage-click an image they assume is a button.
That's the gap between knowing that something is broken and knowing where it's broken. The global web analytics market hit $6.26 billion in 2025 and is projected to reach $25.7 billion by 2034 (Fortune Business Insights), and heatmaps sit at the center of that growth because they turn abstract metrics into visual, actionable evidence for conversion rate optimization.
This is an honest comparison of 12 best heatmap tools for 2026. We evaluated features, pricing, integration fit, and the specific scenarios where each one wins. No tool ranks first in every category. Whether you're a growth marketer diagnosing landing page drop-off, a product team auditing onboarding flows, or a CRO specialist building an experiment backlog, the goal is helping you pick the right tool for your stack and budget.
What's inside
Here's what this article covers and how we chose what made the list:
- 12 heatmap tools reviewed with features, pricing, and honest trade-offs
- Comparison table for quick side-by-side evaluation
- Types of heatmaps explained (click, scroll, move) and when each matters
- Buying criteria tailored for growth marketers evaluating their analytics stack
- A practical framework for turning heatmap data into actual conversion improvements
- FAQs covering compliance, sample sizes, and free options
TL;DR
- Free and unlimited: Microsoft Clarity has no traffic caps, no session limits, and is legitimately free. Start here if budget is a constraint.
- All-in-one behavior + feedback: Hotjar bundles heatmaps, recordings, surveys, and feedback in one tool. The default choice for mid-market teams.
- CRO loop (insight → test): Crazy Egg or VWO connect built-in A/B testing directly to heatmap data. Best for structured experimentation programs.
- Enterprise-scale: Contentsquare or Glassbox offer zone-based analytics, revenue attribution, and compliance-grade capture for large organizations.
- Open-source / self-hosted: PostHog is the option most competitor articles ignore entirely. The best heatmap software pick for dev-friendly teams who want data ownership.
- The real insight: Heatmaps show you the problem. What you do with the data - better CTAs, page restructuring, interactive content - is what moves conversion rates.
What are heatmap tools?
A heatmap tool is heat map software that tracks and visualizes user behavior on a website or app, showing where visitors click, scroll, move their cursor, and engage - or don't. The output is a color-coded overlay on your actual page: red and warm tones indicate high engagement, blue and cool tones signal low attention.
These tools sit at the core of user behavior analytics. Instead of interpreting tables of numbers, you see patterns instantly. A red cluster on a non-clickable image tells you more in two seconds than an hour of log analysis.
Click maps
Click maps visualize exactly where users click on a page. They're the most common heatmap type and the most immediately useful for CTA placement analysis, navigation audits, and identifying "dead clicks" on non-clickable elements. This is click tracking software at its most practical.
A click map might reveal that 35% of visitors click on a product screenshot thinking it's interactive - when it's just a static image.
Scroll maps
Scroll maps show how far down a page visitors scroll, using color gradients from warm (top) to cool (bottom). They're most useful for measuring above-the-fold effectiveness, identifying content engagement drop-off points, and validating page length decisions.
If your CTA sits at the 70% scroll mark and only 30% of visitors reach it, the CTA placement is the problem - not the CTA copy.
Move maps (mouse tracking)
Move maps track cursor movement to approximate attention patterns. They provide a directional signal for where visitors focus, since mouse movement correlates with eye tracking roughly 70–80% of the time on desktop.
The key limitation: this correlation breaks down on mobile, where there's no cursor. Treat move maps as a supporting data point, not a precise measurement.
Beyond heatmaps: session recordings, rage clicks, and funnel analysis
Most modern heatmap tools bundle additional behavior analytics. When evaluating heatmapping tools, you're evaluating behavior analytics platforms. The heatmap is the headline feature, but recordings, rage click detection, and funnel analysis are what make the data actionable.
- Session recordings: Full replays of individual user journeys from entry to exit
- Rage click detection: Repeated clicks on the same element, signaling user frustration
- Form analytics: Field-level drop-off data showing where users abandon forms
- Funnel analysis: Step-by-step conversion tracking across multi-page flows
When to use heatmap tools
Landing page and conversion optimization
When you're running paid campaigns and need to diagnose why pages aren't converting, heatmapping tools show whether visitors reach your CTA, engage with your value proposition, or drop off before the form. This connects directly to conversion rate by campaign source. If you're spending $10K/month on ads driving traffic to a page you've never analyzed with a heatmap, you're optimizing blind. For teams looking to maximize those landing page conversions, pairing heatmap insights with the right page builder makes a significant difference.
Website redesign and UX validation
Before and after a redesign, heatmaps provide behavioral evidence instead of stakeholder opinions. Use them to baseline current behavior and validate whether changes actually improved engagement. The KPI is straightforward: before/after conversion rate and scroll depth, measured with the same website optimization tools.
A/B test hypothesis generation
Instead of guessing what to test, use heatmap data to identify the highest-impact elements. Click concentration, scroll depth drop-off points, and rage clicks all point to specific, testable hypotheses. This improves both experiment velocity and win rate - you're testing things that data says matter.
Product-led growth and onboarding flows
For SaaS teams, heatmaps on in-app pages and onboarding flows reveal where users get stuck during activation. The connection to activation rate and time-to-value is direct: see where users hesitate, fix the friction, measure the improvement. Teams investing in user onboarding software often use heatmap data to validate which onboarding steps need the most attention.
Comparison table
Here's how all 12 heatmap tools compare on the criteria that matter most for growth marketers: primary use case, pricing model, and user ratings. Use this as a quick side-by-side reference before diving into the individual reviews. These tools are listed by category fit, not by ranking - the best heat map tool depends on your specific needs.
12 best heatmap tools reviewed
These tools are listed by category fit, not by ranking. No single tool wins across every dimension. Each review covers what the tool does well, where it falls short, and the specific scenario where it's the strongest pick.
1. Hotjar
Hotjar is the most recognized name in website heatmaps, and for good reason. Owned by Contentsquare but operating independently, it targets SMBs and mid-market teams who want behavior data and qualitative feedback in one heat map tool without stitching products together.
The differentiator is the all-in-one bundling: click, scroll, and move heatmaps with retroactive data, session recordings, user feedback widgets, surveys, and AI-powered survey generation. If you want heatmap analysis alongside "why did you leave?" feedback, Hotjar handles both.
Best for: Growth marketers who want behavior data and user feedback in a single platform.
Key strengths
- Click, scroll, and move heatmaps with retroactive data
- Session recordings filtered by rage clicks, u-turns, and errors
- Integrated surveys and feedback widgets with AI question generation
- 100+ integrations including GA4, HubSpot, Slack, and Segment
- GDPR and CCPA compliant by default
Why choose: One tool covering heatmaps, recordings, and user feedback. The free tier (35 daily sessions) validates the tool before you commit budget. For most mid-market teams, Hotjar is the starting point.
Honest trade-off: Session limits on lower plans restrict high-traffic sites. Heatmap data is sampled on free and basic plans. If you only need heatmaps and not surveys or feedback, you're paying for features you won't use.
Pricing: Free tier available. Paid plans from $32/month.
2. Microsoft Clarity
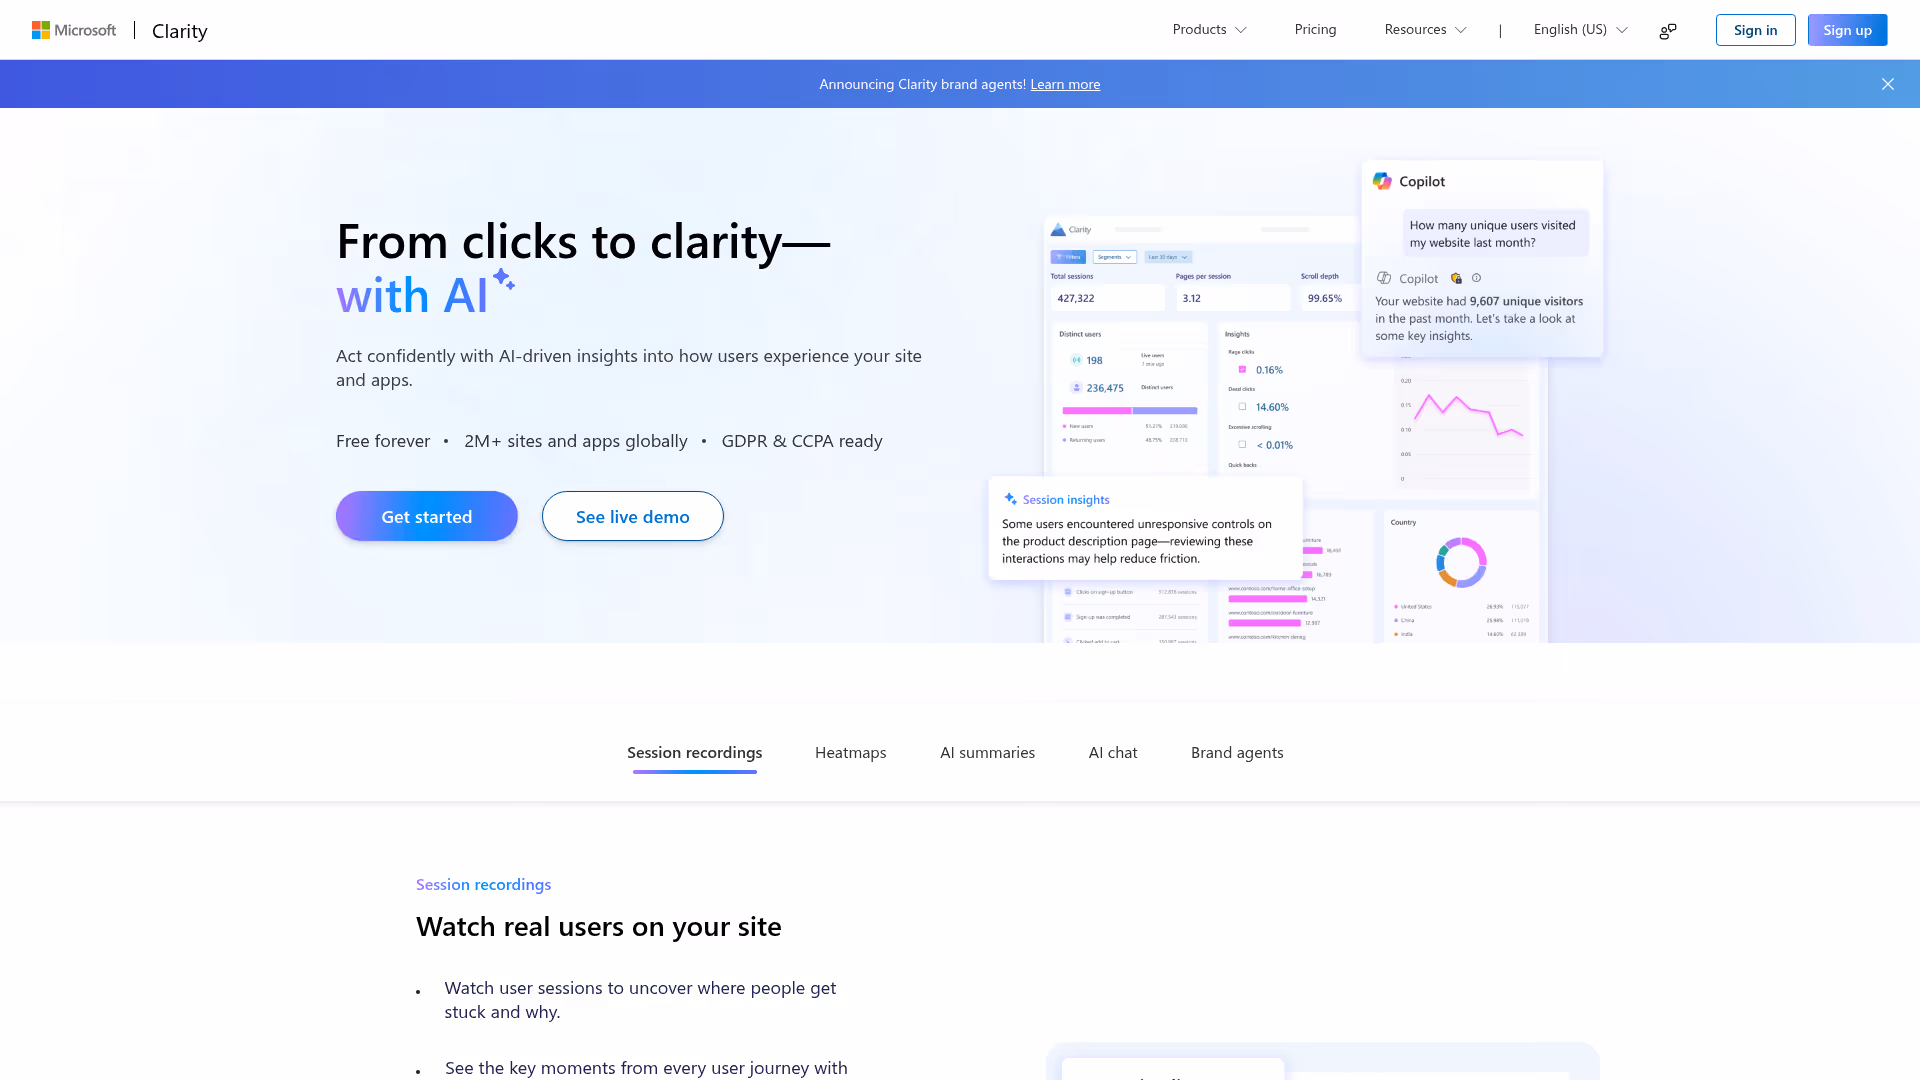
Microsoft Clarity is the completely free heatmap tool - and not "free trial" free. No traffic caps. No session limits. No premium tier hiding the good features. It's backed by Microsoft, which means it's not going anywhere.
The native GA4 integration connects behavior data to your existing analytics. Copilot AI summaries for session recordings save time on manual review. For a free tool, the feature set is surprisingly deep.
Best for: Teams with budget constraints who need a legitimate free heatmap tool today, not a trial.
Key strengths
- 100% free with no traffic limits or session caps
- Click, scroll, and area heatmaps
- Session recordings with smart filters
- Rage click, dead click, and excessive scrolling detection
- Native GA4 integration and Copilot AI session summaries
Why choose: Budget is a real constraint and you need heatmaps now. Clarity is genuinely free and handles any traffic volume. For many teams, this is all you need.
Honest trade-off: No surveys or feedback widgets. Segmentation is more limited than Hotjar or Mouseflow. No move maps. Enterprise teams with complex segmentation needs will outgrow it.
Pricing: Free.
3. Crazy Egg
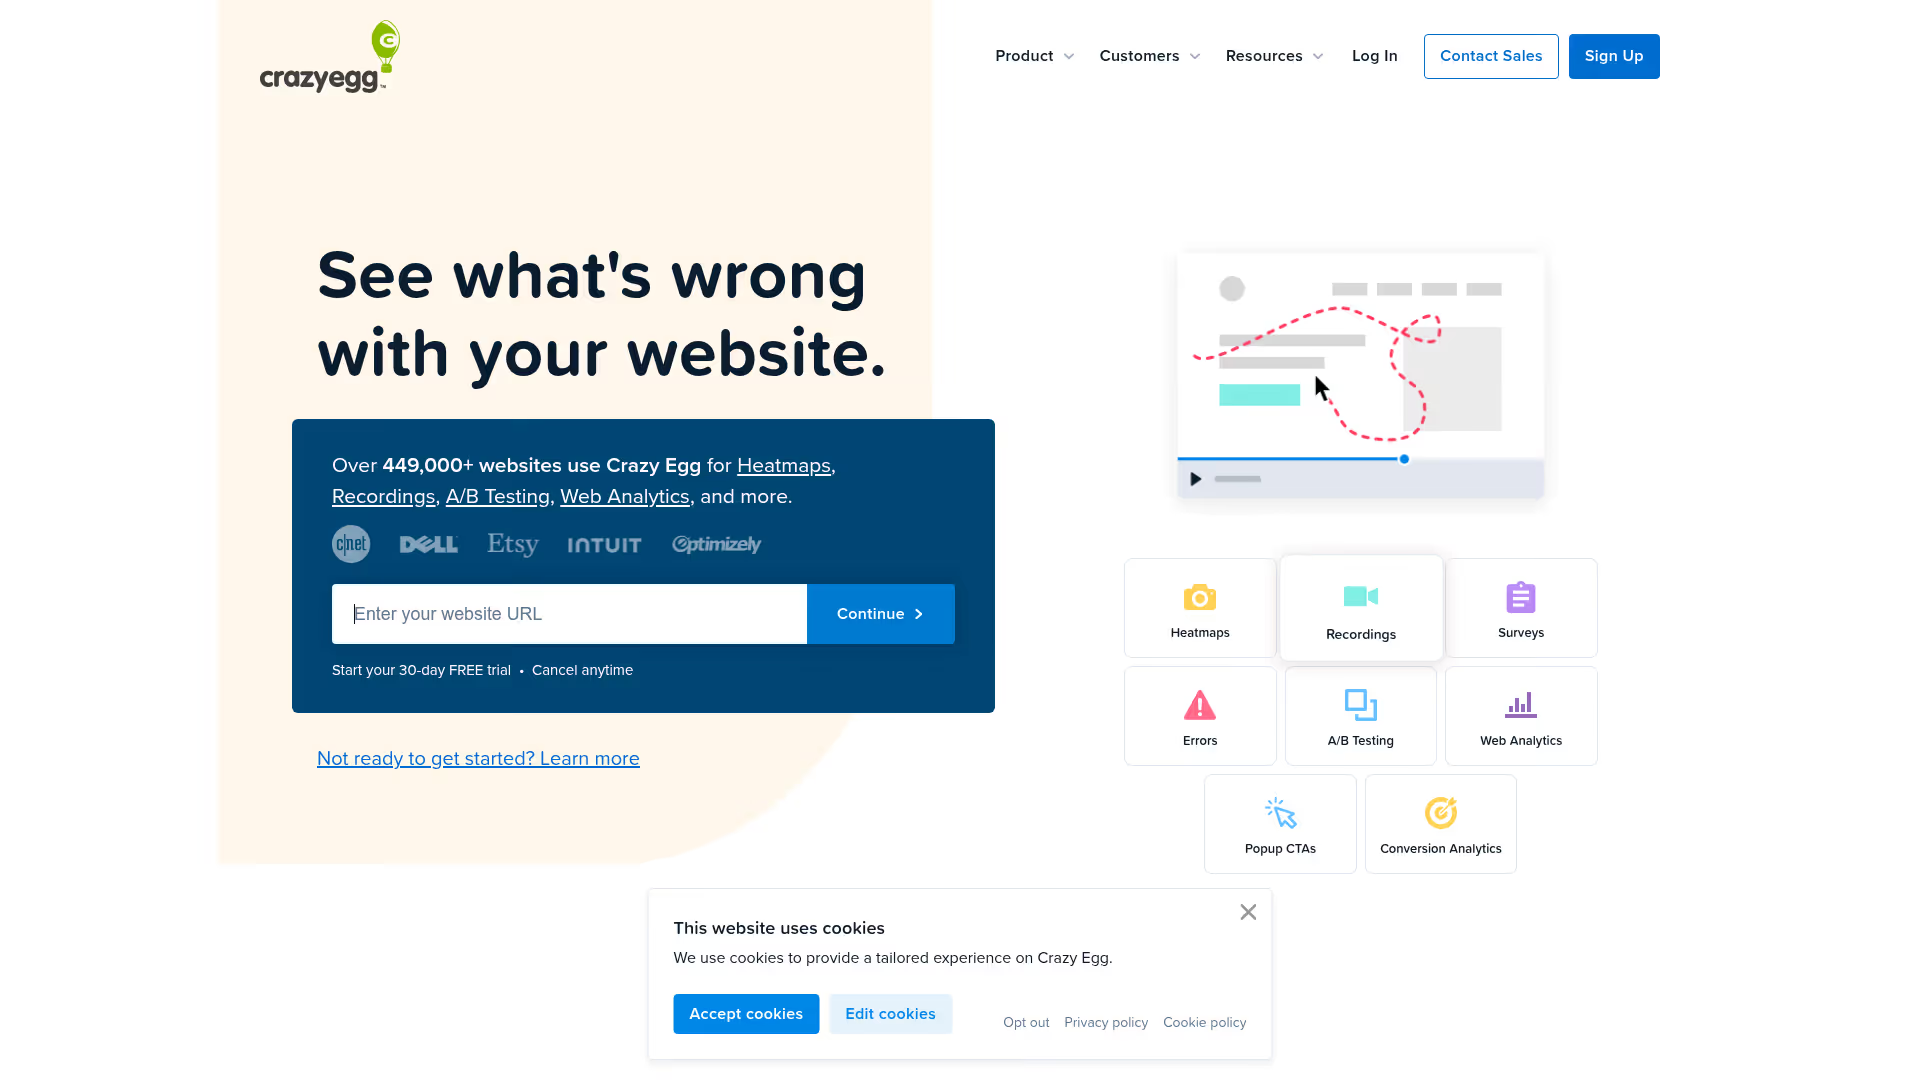
Crazy Egg is one of the original heatmap tools, founded by Neil Patel and Hiten Shah. The differentiator is the built-in A/B testing engine directly connected to heatmap data. See where users click, form a hypothesis, launch a test, measure the result - all in one platform.
Confetti reports segment clicks by referral source, device, and time. These are genuinely useful for paid media teams trying to understand how different traffic sources behave on the same page.
Best for: Teams who want the full "see behavior → hypothesize → test → measure" loop in one tool.
Key strengths
- Click, scroll, and confetti heatmaps
- Built-in A/B testing tied to heatmap insights
- Overlay and list reports for link-level click analysis
- Snapshots capturing page state at recording time
- Traffic analysis with referral source segmentation
Why choose: Your CRO workflow is observe, hypothesize, test, measure - and you want the full loop without switching tools. The confetti reports are a unique strength for multi-channel teams.
Honest trade-off: Session recording quality is behind FullStory and Hotjar. No survey or feedback features. The UI feels dated compared to newer tools. No free plan - 30-day trial only.
Pricing: From $29/month. 30-day free trial.
4. Lucky Orange
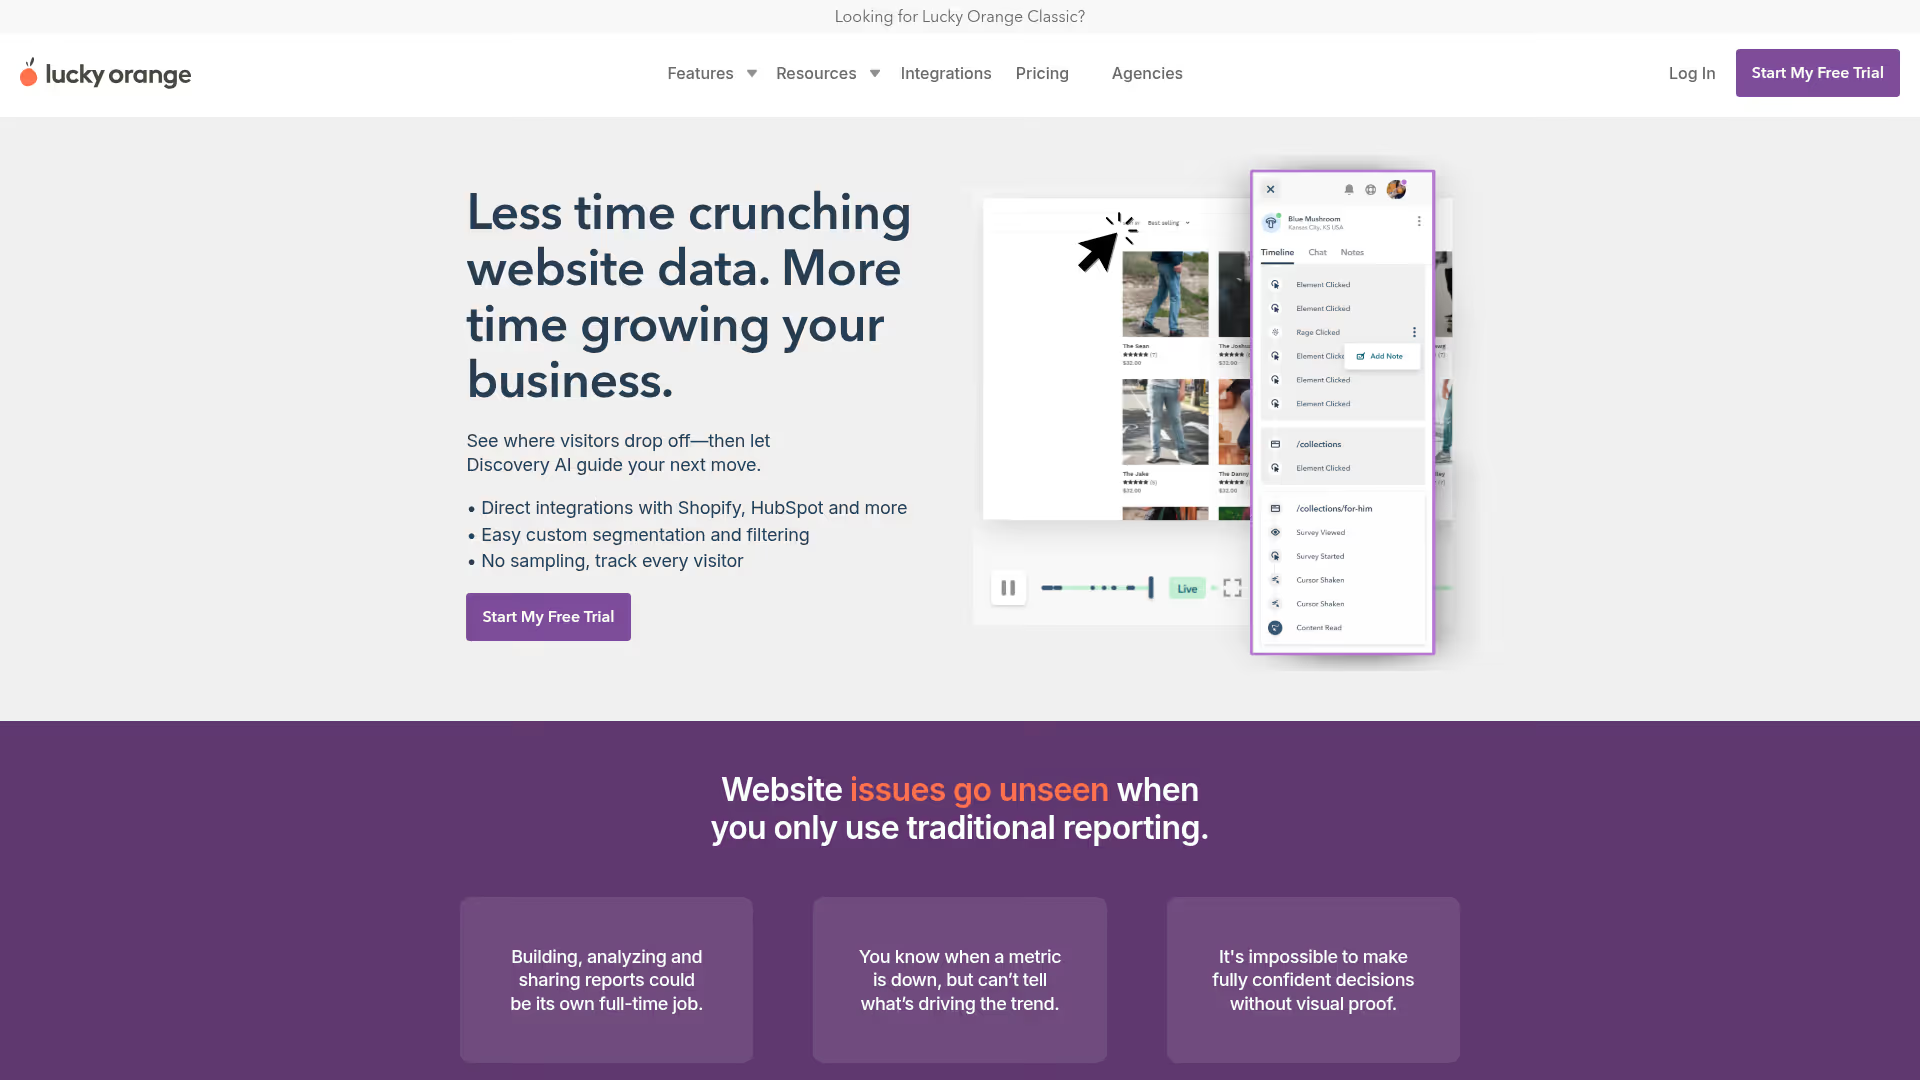
Lucky Orange combines heatmaps and recordings with a live chat widget and real-time visitor dashboard. The standout feature: watch visitors browse in real time and trigger a chat conversation based on their behavior - for example, when someone is stuck on the pricing page for 30+ seconds.
This positioning as a heat mapping tool plus engagement platform is unique on this list.
Best for: E-commerce and lead gen teams who want to see what visitors are doing and react in the moment.
Key strengths
- Dynamic heatmaps (click, scroll, move) updating in real time
- Session recordings with event-based filtering
- Live visitor dashboard with real-time chat integration
- Form analytics with field-level drop-off tracking
- Conversion funnels and built-in announcements
Why choose: You want behavior data and the ability to act on it immediately. Behavior-triggered live chat is a genuine differentiator for conversion-focused teams.
Honest trade-off: Breadth of features means none are as deep as dedicated tools. Heatmap granularity is behind Hotjar and Crazy Egg. The UI can feel overwhelming with so many features competing for attention.
Pricing: Free tier (100 sessions/month). Paid from $32/month.
5. Mouseflow
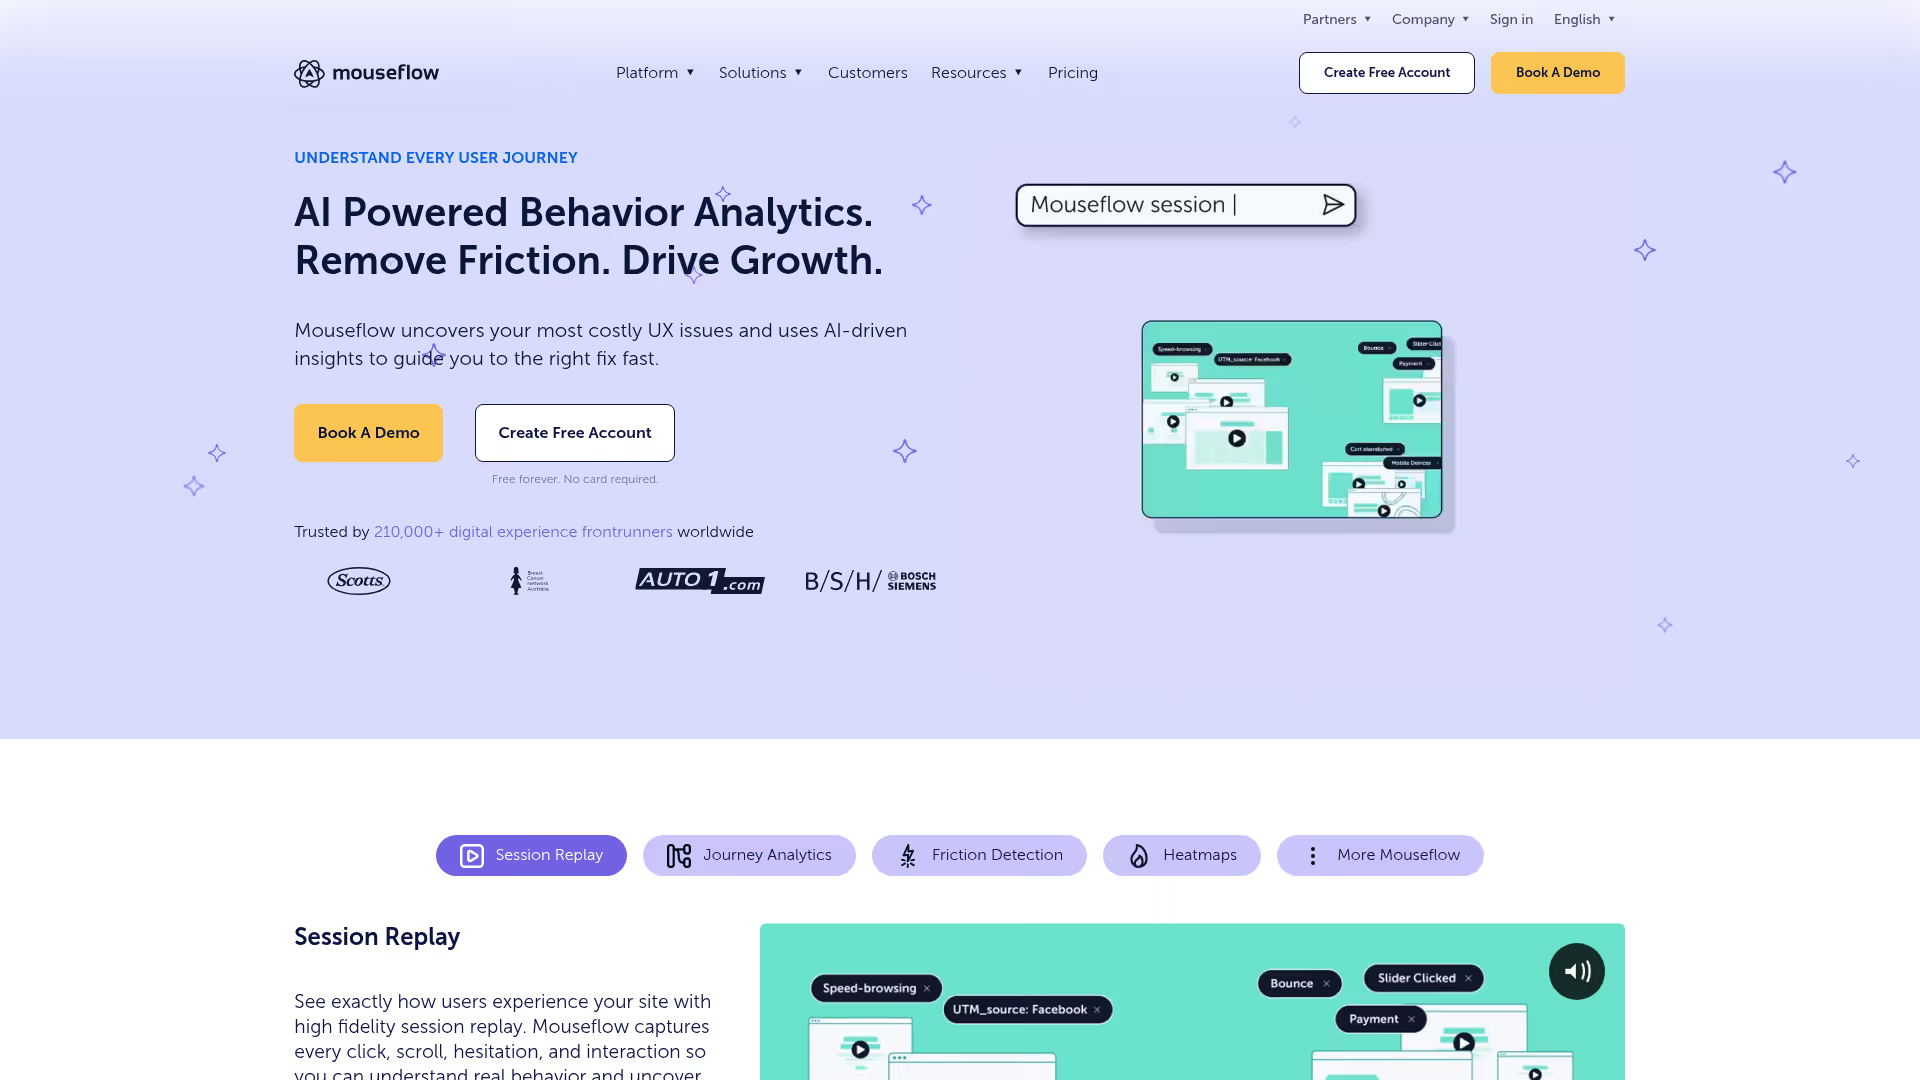
Mouseflow is a session recording-first platform with strong heatmaps, funnel analytics, and the deepest form analytics on this list. It expanded mobile capabilities in recent years. The friction scoring feature auto-flags problematic sessions, saving hours of manual review.
If forms are your conversion bottleneck - lead gen, checkout, signup - Mouseflow's field-level data (hesitation time, refills, blank submissions) is unmatched here.
Best for: Teams whose biggest conversion gap lives in forms and multi-step funnels.
Key strengths
- Six heatmap types: click, scroll, move, attention, geo, and live
- Session recordings with friction score auto-tagging
- Form analytics with field-level drop-off data
- Funnel analysis with built-in conversion tracking
- Feedback campaigns and NPS surveys
Why choose: Your forms are leaking conversions and you need field-level data to diagnose why. Mouseflow's form analytics are deeper than any competitor here. Friction scoring saves hours of manual session review.
Honest trade-off: Depth comes with a steeper learning curve. Pricing scales with recorded sessions, which gets expensive for high-traffic sites. The platform is still unifying capabilities across its expanded product suite.
Pricing: Free tier (500 recordings/month). Paid from $31/month.
6. FullStory
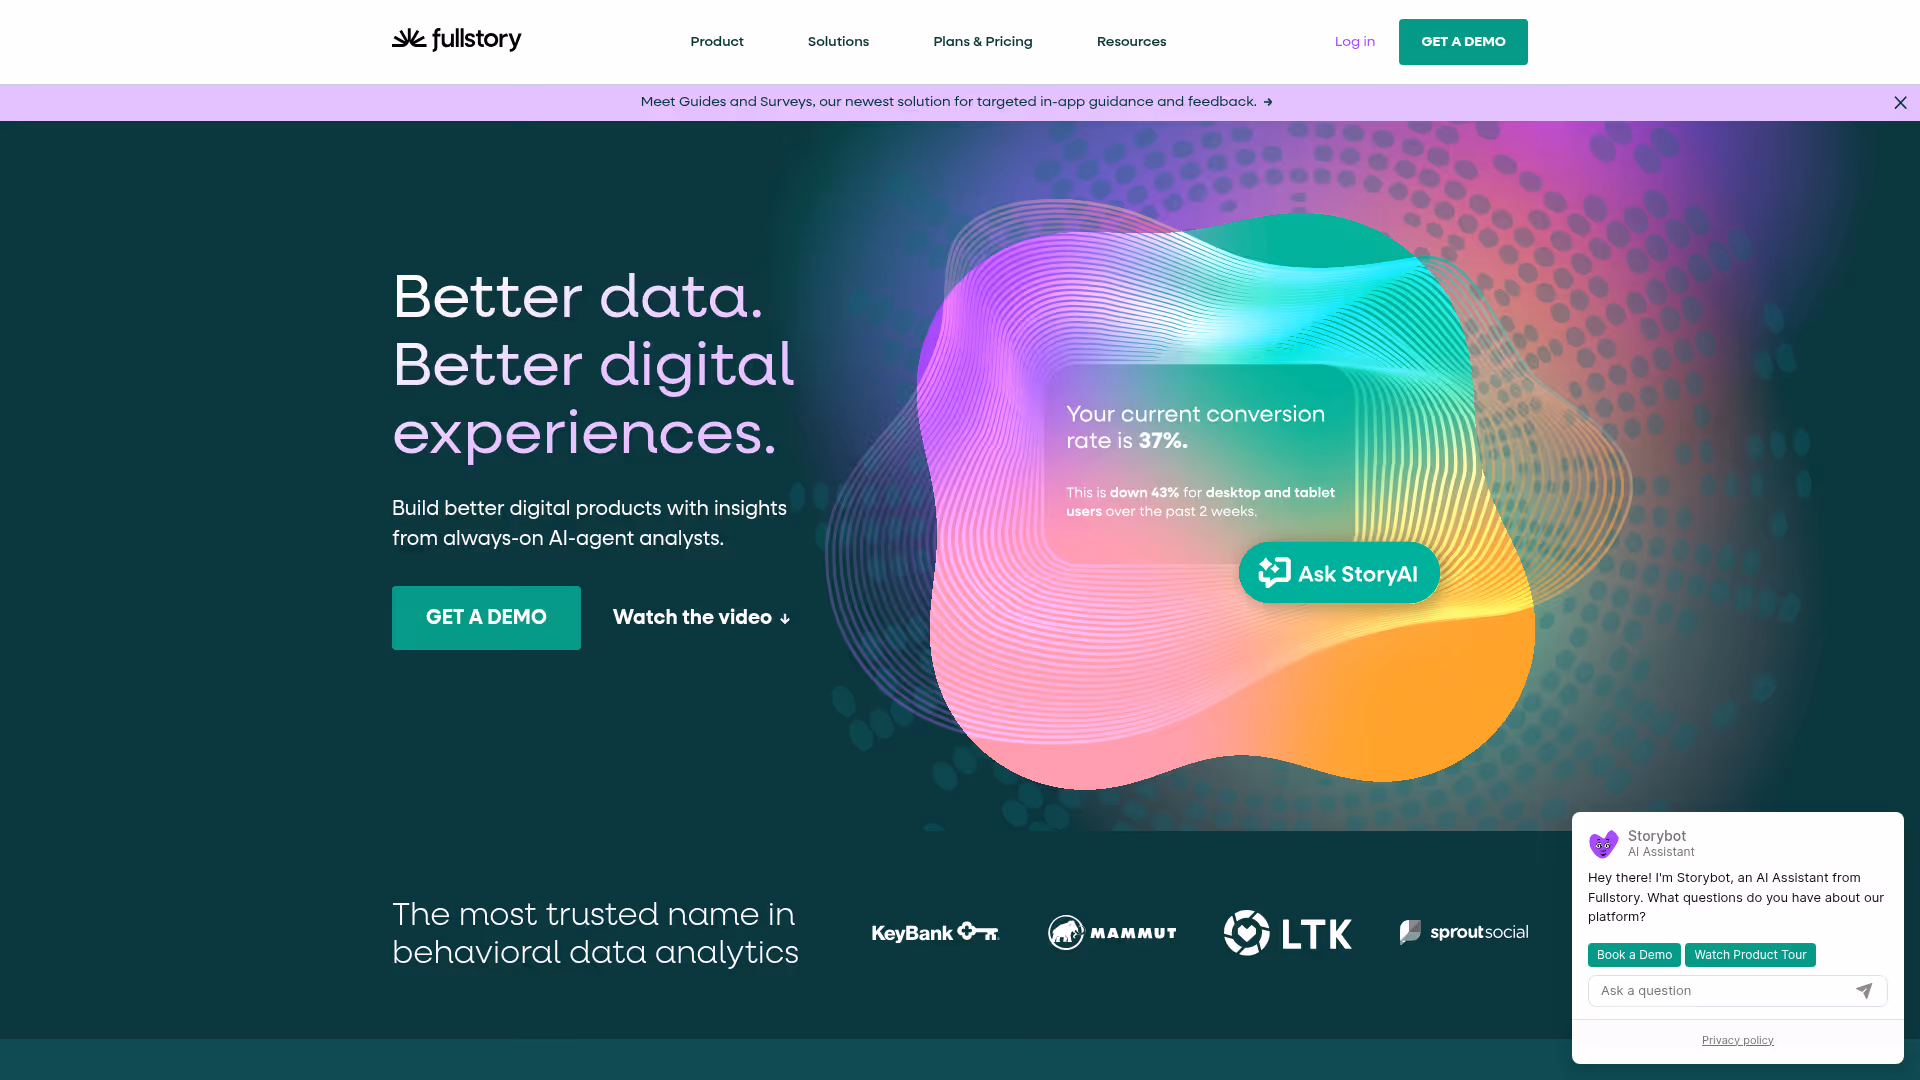
FullStory is a digital experience intelligence platform where heatmaps are one feature within a much larger product analytics suite. Autocapture records every user interaction without pre-defining events - you never miss something you forgot to instrument.
This is positioned for product and UX teams at mid-market to enterprise companies that need behavior data connected to engineering workflows and customer data platforms.
Best for: Product teams that have outgrown standalone heatmap tools and need behavior data tied to product analytics.
Key strengths
- Autocapture records every click, scroll, and interaction automatically
- Heatmaps, session replays, and journey mapping in one platform
- Error and frustration signal detection including rage clicks
- Custom event and conversion funnel analysis
- Integrations with Segment, Salesforce, Slack, Jira, and data warehouses
Why choose: You've outgrown standalone heat mapping software and need behavior data connected to product analytics and engineering workflows. Autocapture means you never miss an event you forgot to set up.
Honest trade-off: Significant overkill if you only need heatmaps. Enterprise pricing with custom quotes. The platform depth requires dedicated onboarding time - this isn't a "set up in 10 minutes" tool.
Pricing: Custom pricing. Free trial available.
7. Contentsquare
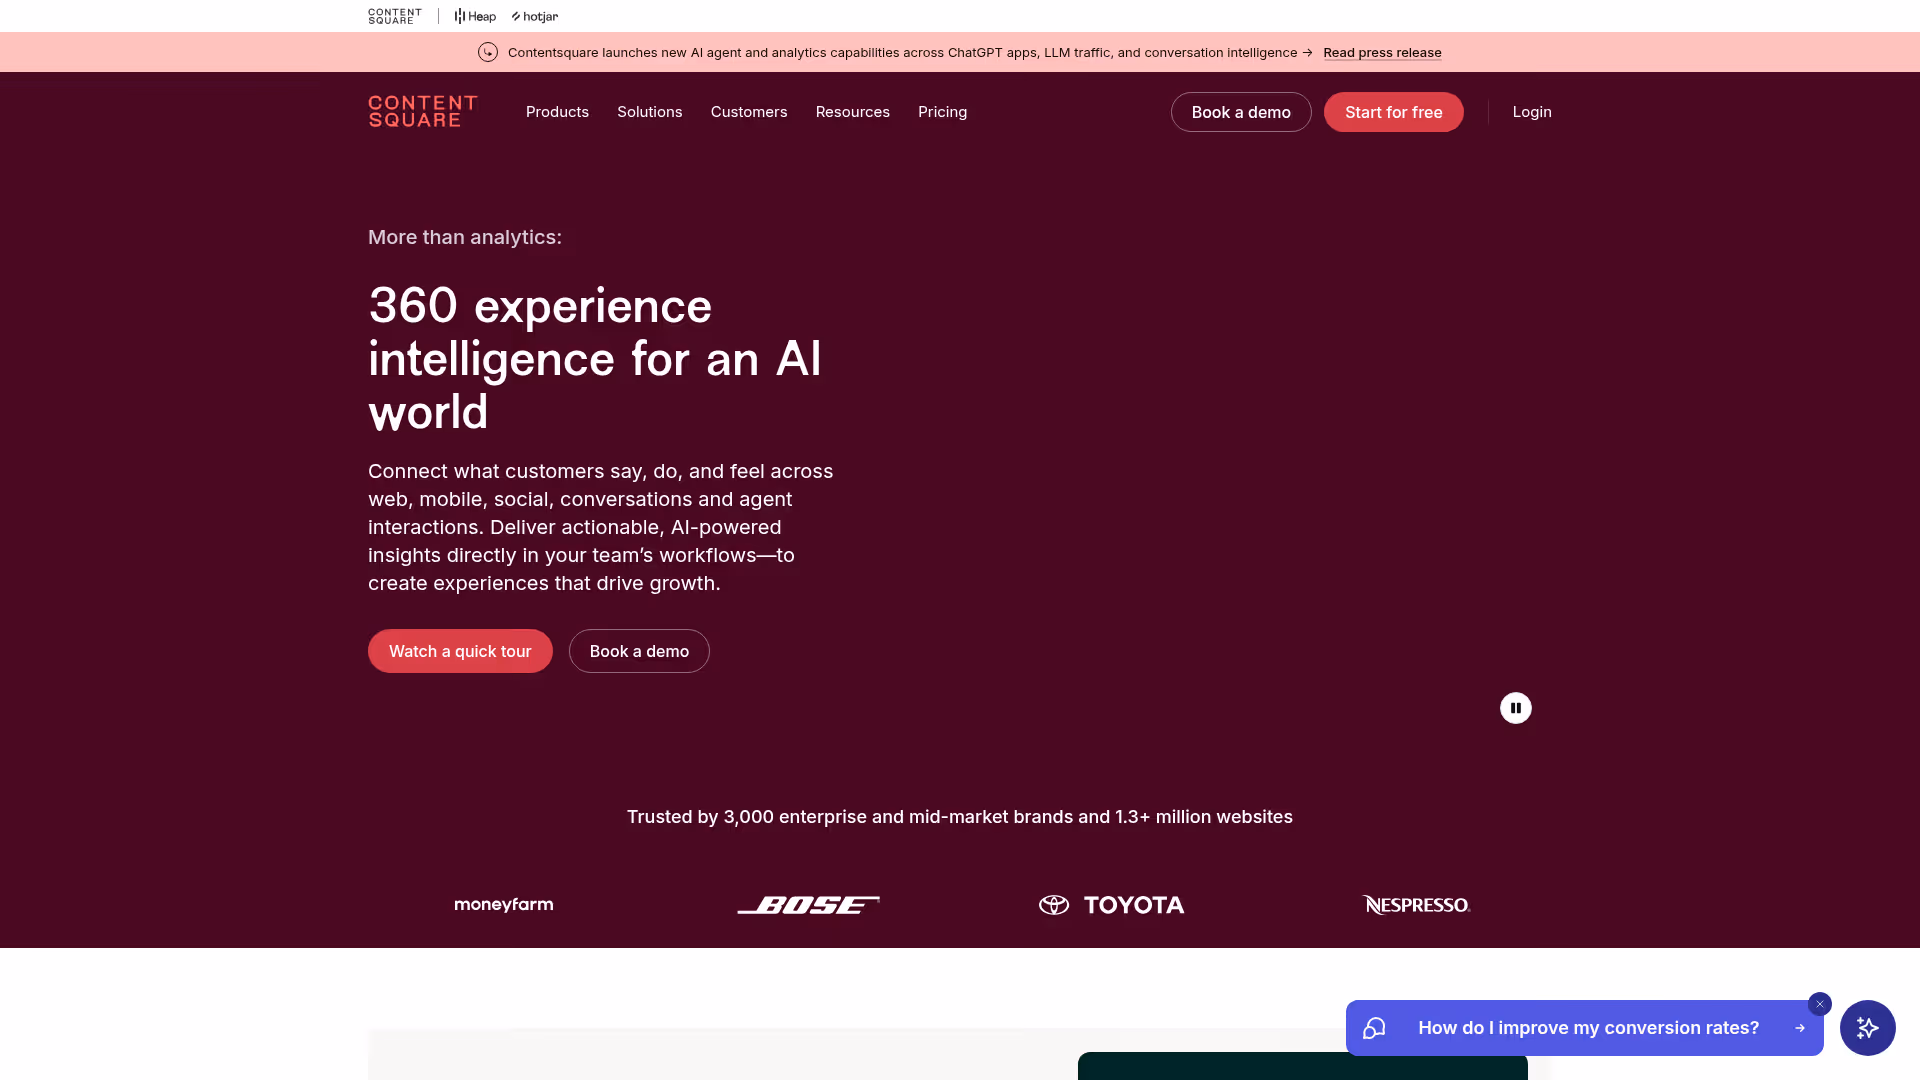
Contentsquare is enterprise-grade experience analytics. It acquired Hotjar in 2021 and operates as the enterprise sibling. Zone-based heatmaps analyze page sections rather than individual clicks, providing aggregate engagement and revenue attribution per zone.
AI-powered anomaly detection surfaces issues automatically - you don't have to go looking for problems.
Best for: Enterprise teams operating at millions of sessions who need heatmap data tied directly to revenue.
Key strengths
- Zone-based heatmaps with revenue and conversion attribution per page section
- AI-driven insights auto-surfacing anomalies and opportunities
- Journey analysis across multi-page flows
- Merchandising and product performance analytics
- Enterprise compliance: SOC 2, GDPR, ISO 27001
Why choose: You're operating at scale and need to answer "which page section drives the most revenue" - not just "where do people click." Zone-based analysis is a different category of insight.
Honest trade-off: Not accessible for small teams. No public pricing. Implementation requires professional services and weeks of setup. If you need simple click heatmaps, this is overkill.
Pricing: Custom pricing. Demo required.
8. VWO Insights
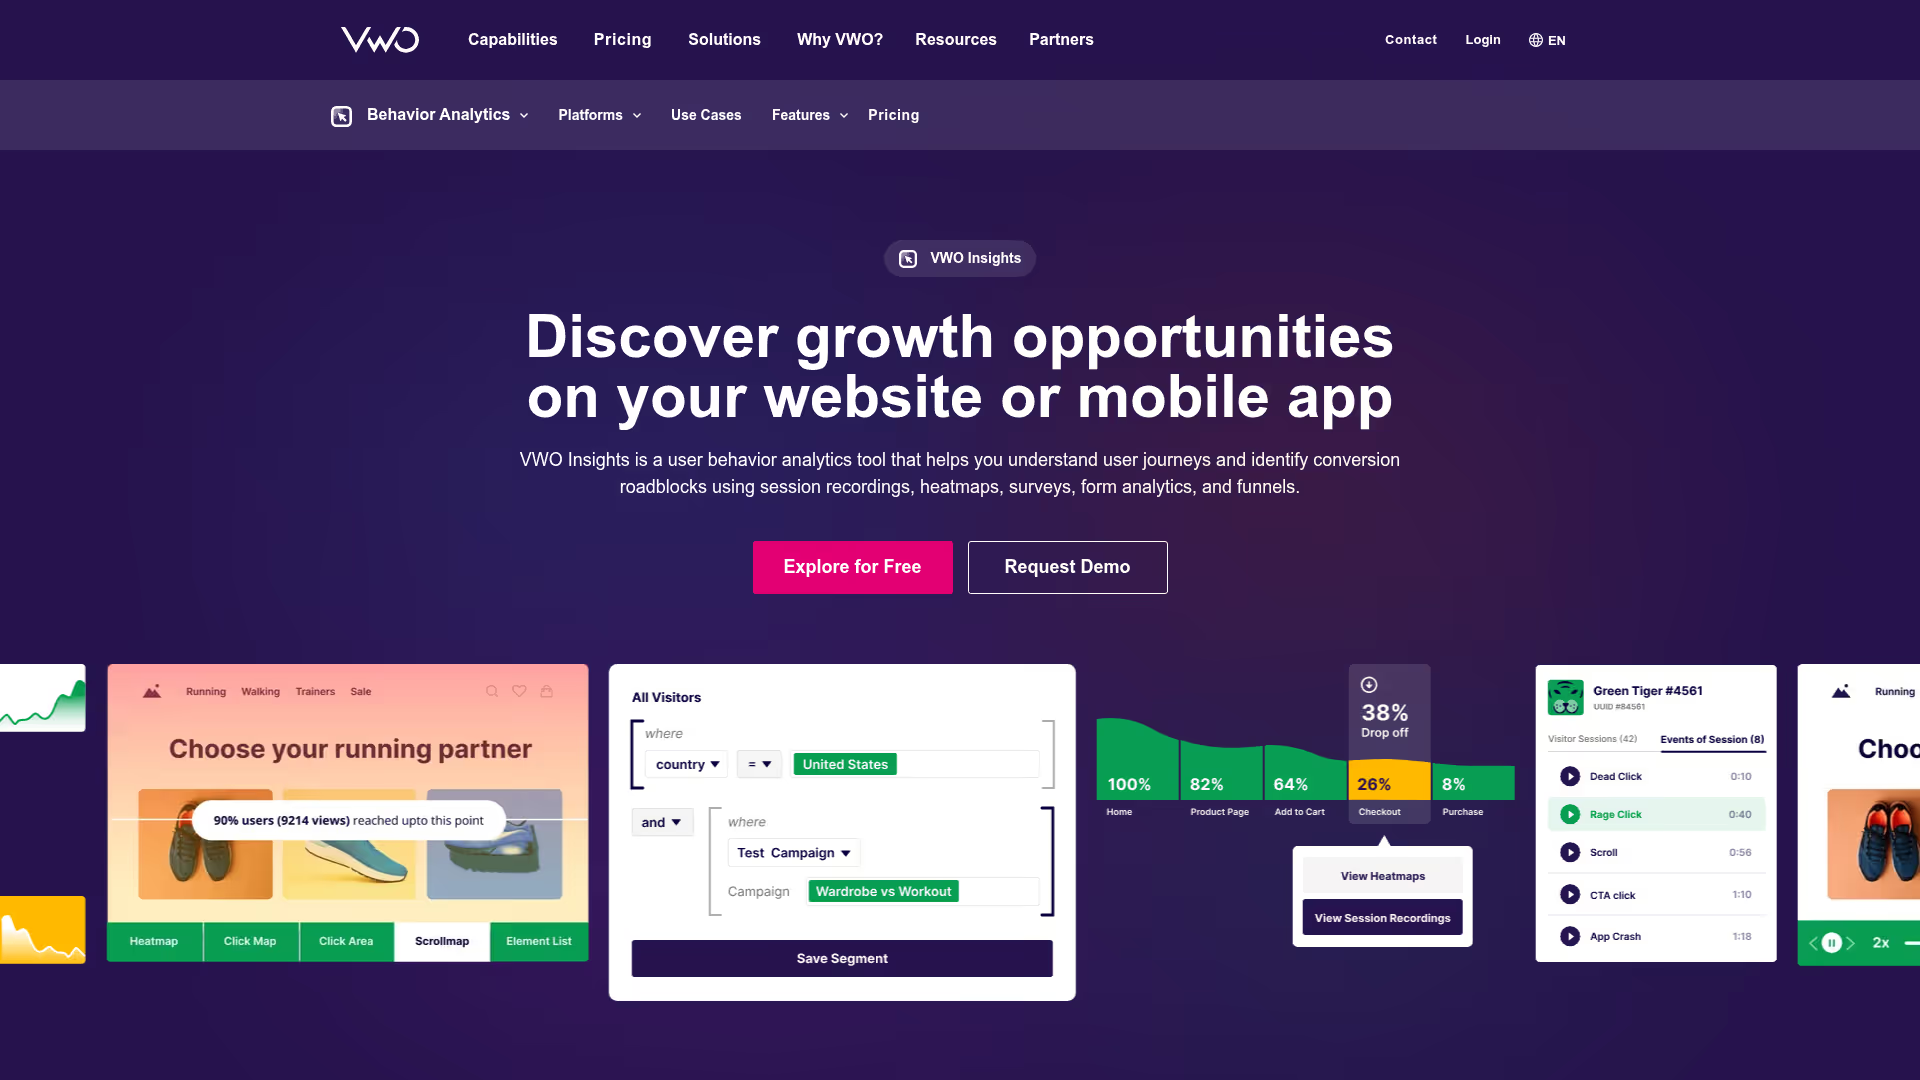
VWO Insights is part of VWO's broader CRO suite covering testing, personalization, planning, and insights. The advantage is tight integration with VWO's A/B testing and personalization - heatmap data feeds directly into experiment design.
This is built for teams running structured CRO programs who want the full observe → test → personalize loop under one roof.
Best for: CRO teams running structured experimentation programs who want heatmaps, testing, and personalization unified.
Key strengths
- Click, scroll, and element-level heatmaps
- Session recordings with advanced filters
- Form analytics and funnel analysis
- Tight integration with VWO Testing and Personalization
- Segmentation by audience, device, and campaign source
Why choose: You're running a structured CRO program and want the data flow from "observe" to "test" to "personalize" to be smoother than stitching separate tools together.
Honest trade-off: Pricing starts at $173/month for Insights alone. Heatmaps don't justify that cost on their own - you need the testing and personalization modules for ROI. If you only want heatmaps, this is the wrong tool.
Pricing: From $173/month for VWO Insights.
9. Plerdy
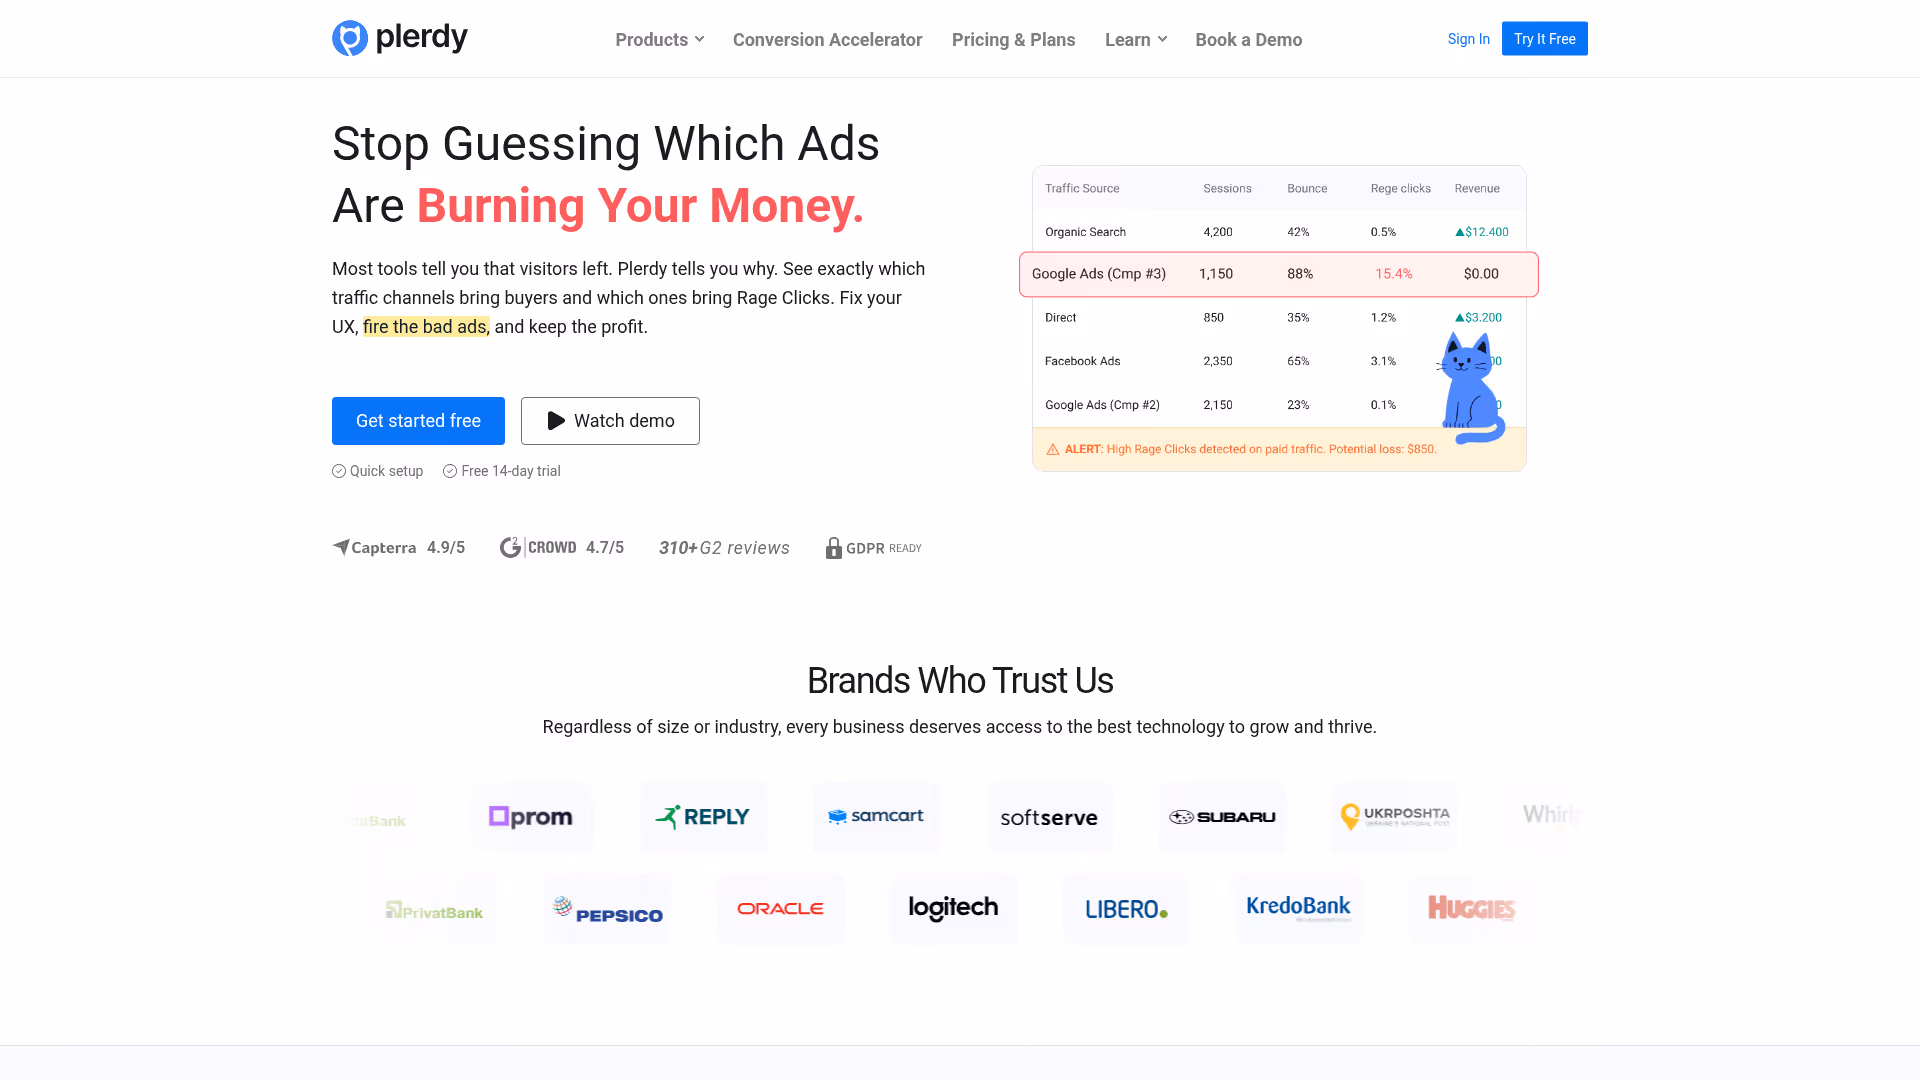
Plerdy is a budget-friendly heat mapping tool bundling SEO auditing, pop-up forms, and conversion funnels alongside heatmaps and recordings. The SEO + heatmap combination is unusual in the market and popular with small businesses and agencies managing multiple client sites.
Best for: Small teams or agencies needing heatmaps and basic SEO auditing without paying for two separate tools.
Key strengths
- Click and scroll heatmaps with element-level tracking
- Session recordings with user segmentation
- Built-in SEO site audit tool
- Pop-up forms and smart lead capture
- Multi-site management for agencies
Why choose: You need heatmaps and basic SEO auditing on a tight budget. Pricing is hard to beat, and multi-site management makes it practical for agencies.
Honest trade-off: SEO features are basic compared to dedicated tools like Ahrefs or Semrush. Heatmap visualization and recording depth lag behind Hotjar and Mouseflow. The UI is functional but not polished.
Pricing: Free tier (limited). Paid from $21/month.
10. Glassbox
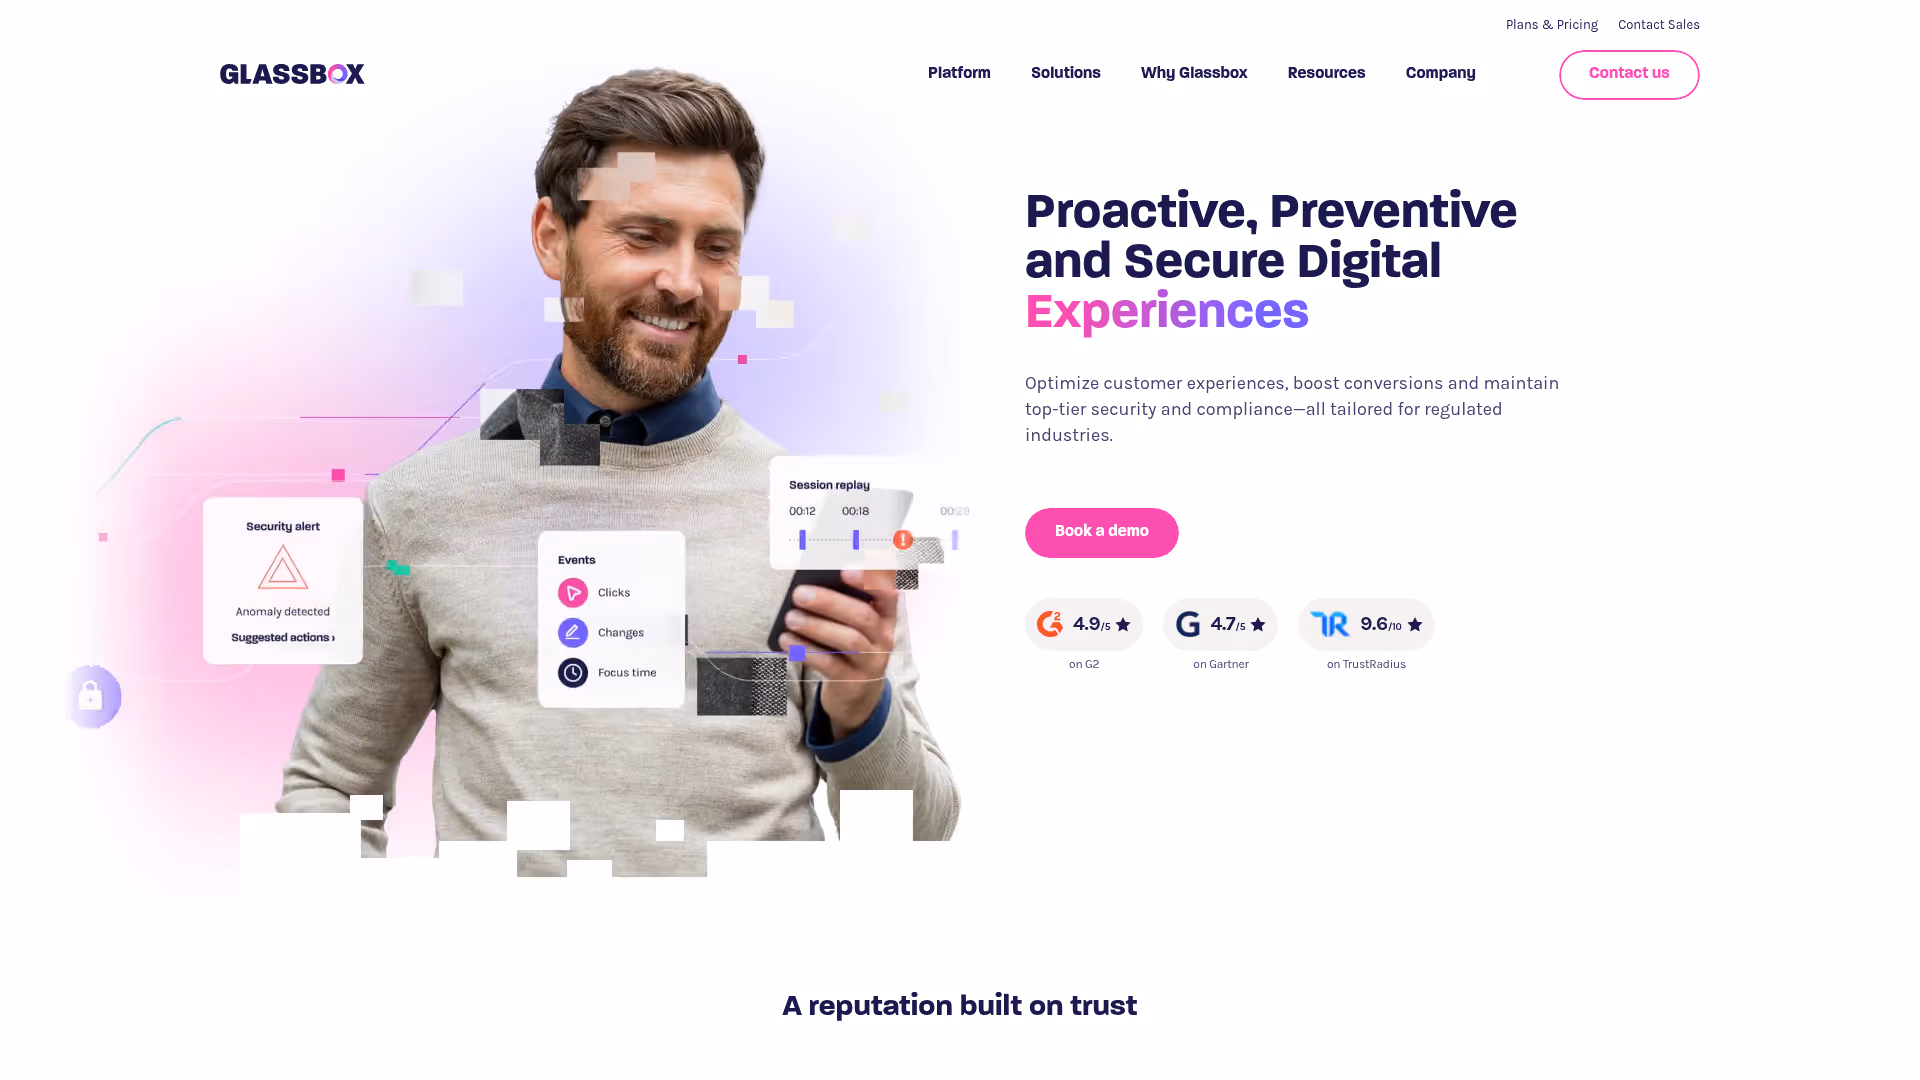
Glassbox is enterprise digital experience analytics built for regulated industries: financial services, insurance, healthcare, and telecom. The defining feature is 100% session capture with zero sampling. When your compliance team needs audit-grade behavioral data, sampling isn't acceptable.
Best for: Regulated industries where full-fidelity behavioral data and audit-grade compliance are non-negotiable.
Key strengths
- 100% session capture, zero sampling
- Interaction maps (Glassbox's heatmap variant) and session replays
- AI-powered struggle and anomaly detection
- Journey analytics across channels
- Compliance: SOC 2, PCI DSS, HIPAA, GDPR
Why choose: You're in a regulated industry and need full-fidelity behavioral data with compliance that satisfies your legal and security teams. "Capture everything, sample nothing" means no data gaps.
Honest trade-off: Enterprise pricing with no self-serve signup. Implementation takes weeks, not minutes. If you don't need regulatory compliance, you're paying for overhead you won't use.
Pricing: Custom pricing. Enterprise sales process.
11. PostHog
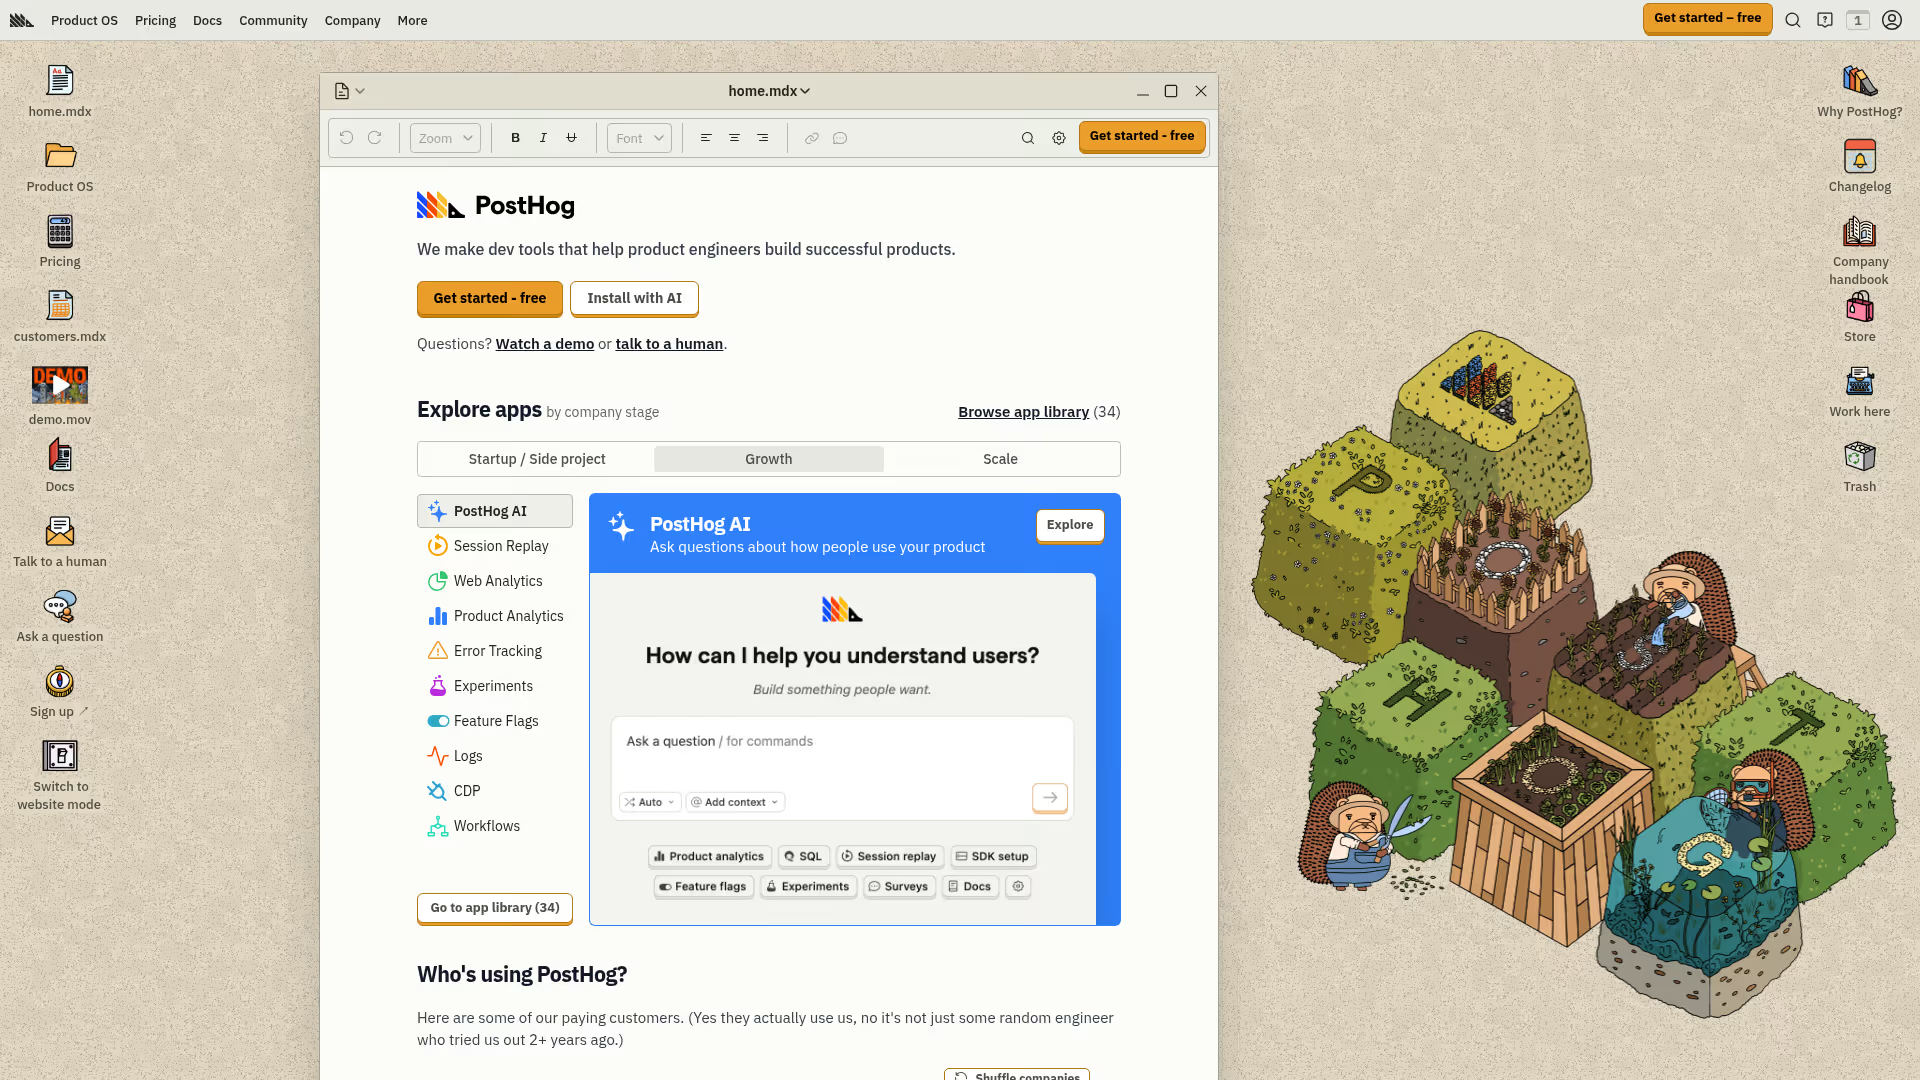
PostHog is the open-source product analytics platform with heatmaps (toolbar-based click maps), session recordings, feature flags, A/B testing, and product analytics - all in one stack. Self-hosted or cloud. This is the option every competitor article misses.
It's growing fast among dev-friendly SaaS teams who want data ownership and hate vendor lock-in.
Best for: Engineering-forward teams who value open-source, want to self-host behavioral data, or need heatmaps + feature flags + experiments without vendor lock-in.
Key strengths
- Open-source with self-hosted or cloud deployment
- Click heatmaps via PostHog Toolbar
- Session recordings with console log capture
- Feature flags, A/B testing, and product analytics in one stack
- Event autocapture plus custom event tracking
- Transparent usage-based pricing
Why choose: You want open-source, self-hosted behavioral data, or you need heatmaps alongside feature flags and experiments without stitching five tools together.
Honest trade-off: Heatmap visualization is less polished than Hotjar or Crazy Egg. Click heatmaps only via toolbar - no scroll or move maps as of early 2026. Self-hosting requires engineering resources. The "all-in-one" approach means no single feature matches the depth of a dedicated tool.
Pricing: Free tier (1M events/month). Usage-based paid plans.
12. Inspectlet
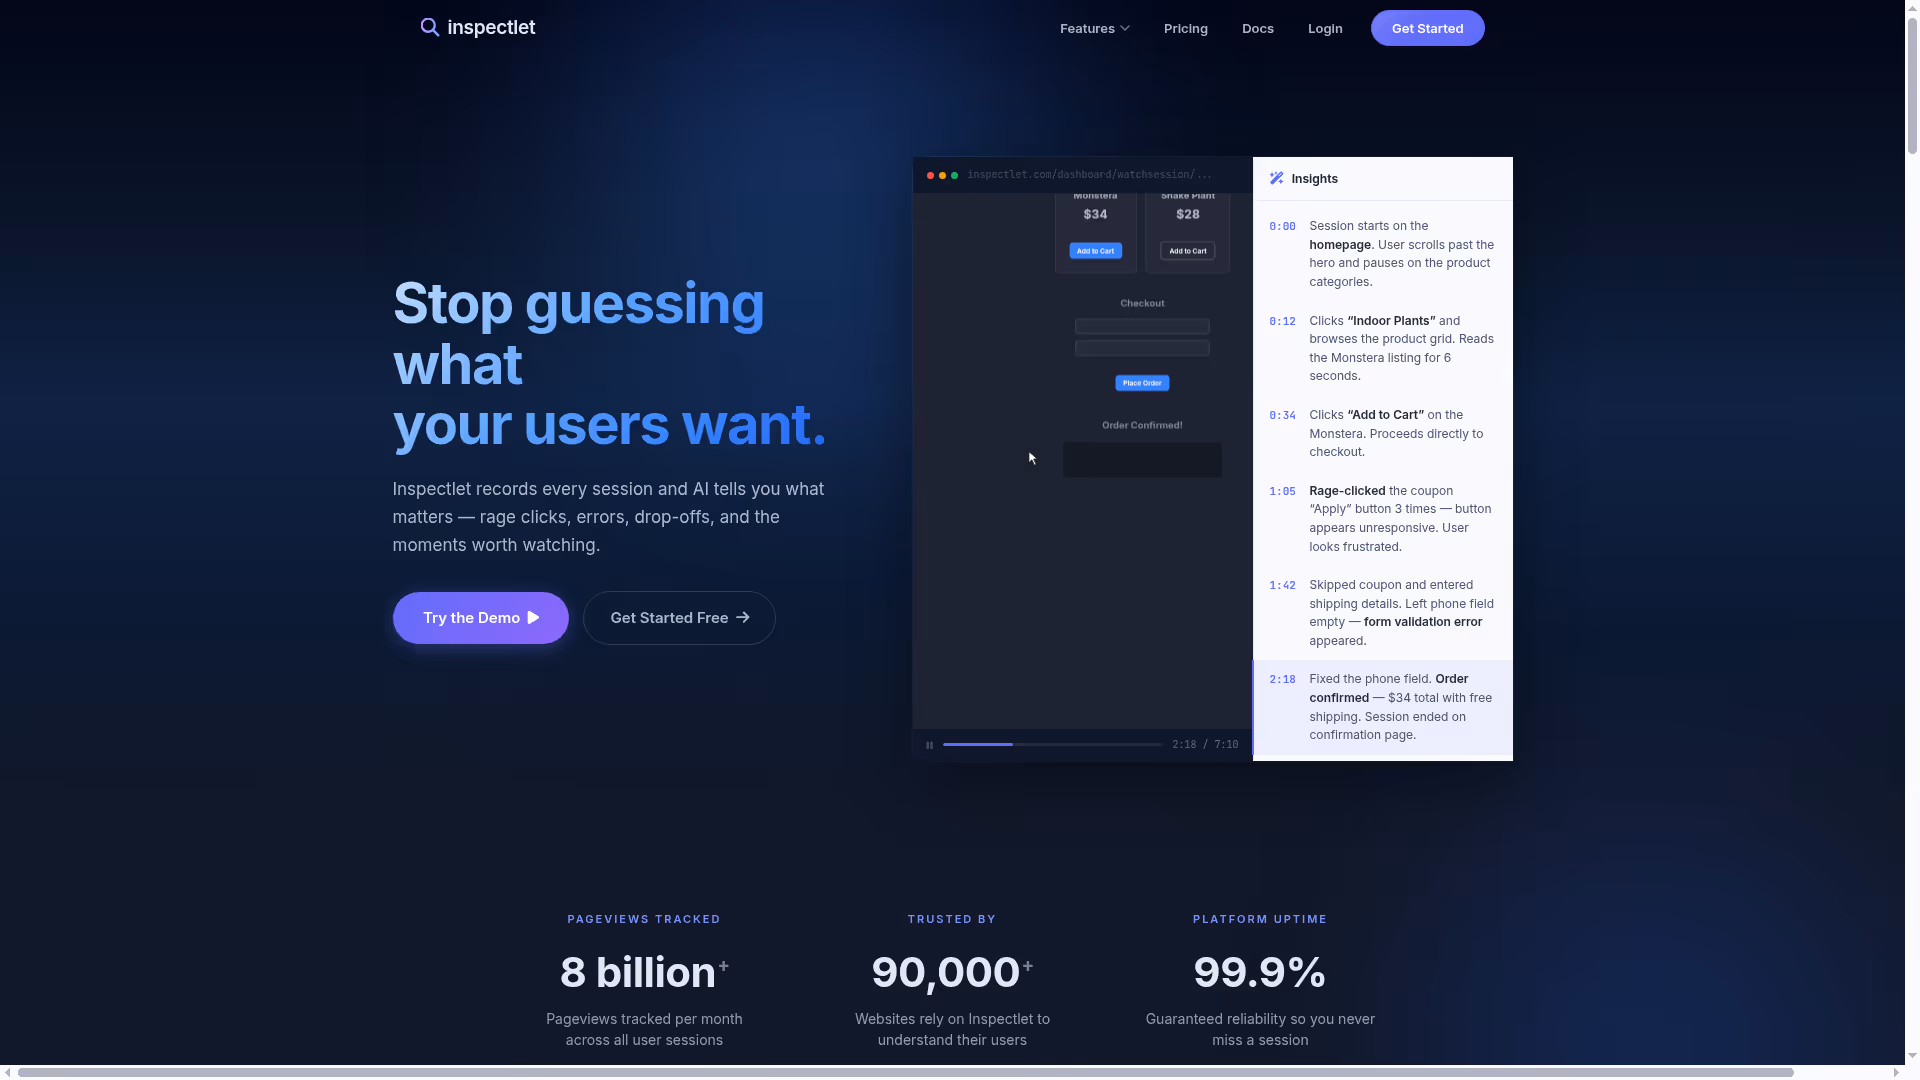
Inspectlet is a lightweight, no-frills heat map application for teams that want simplicity. Around since 2012, it offers predicted eye-tracking heatmaps (gaze patterns based on mouse movement), form analytics, and error logging. The feature is the lack of feature bloat.
Best for: Teams who want heatmaps and recordings that work without becoming a platform to manage.
Key strengths
- Click, scroll, and eye-tracking (predicted gaze) heatmaps
- Session recordings with search and filter
- Form analytics with field-level data
- Error logging alongside session recordings
- A/B test heatmap comparison
Why choose: You want heatmaps and recordings that do the job without a complex onboarding process. The simplicity is the feature.
Honest trade-off: UI and feature set feel dated compared to Hotjar, Lucky Orange, and FullStory. Limited integrations. No survey or feedback capabilities. Development pace is slow. The free plan is limited to 100 sessions/month.
Pricing: Free tier (100 sessions/month). Paid from $33/month.
How to choose the right heatmap tool
Match the tool to your traffic volume
Free tools like Clarity handle any scale. Paid tools price by sessions - and high-traffic sites (100K+ monthly visitors) need to calculate actual monthly cost at their volume, not just look at the base tier. Quick mental model: take your monthly pageviews, multiply by the average pages per session you'd track, and compare to each heat map tool's session limits.
Evaluate integration fit
A heatmap tool that doesn't connect to your analytics and CRM stack creates a data silo you'll resent within a month. Map integrations against your must-haves: GA4, CRM (HubSpot or Salesforce), ad platforms, Segment, Slack. If the website analytics tools you're evaluating don't connect to where your data already lives, move on. For teams already using a CRM platform, ensuring your heatmap tool integrates cleanly is non-negotiable.
Consider the full behavior analytics picture
Don't buy a heatmap tool in isolation. Do you also need session replay software, form analytics, surveys, or A/B testing? Some tools bundle everything (FullStory, VWO); others specialize. Buying a heatmap-only tool when you'll need form analytics in three months means re-evaluating and migrating.
Factor in privacy and compliance
EU operations or sensitive data means GDPR compliance, cookie consent management, and data residency matter. Check auto-PII masking in recordings. Clarity and Hotjar have compliance built in. Glassbox is the pick for HIPAA and PCI DSS requirements.
Test before you buy
Every tool on this list offers a free tier or free trial. Set up 2–3 on the same pages for one week. Compare data quality, visualization clarity, and how intuitive the insights feel. The tool that makes you want to check the data daily is the one that'll actually get used.
Turning heatmap data into conversion improvements
Diagnose with heatmaps, hypothesize with data, test with experiments
Here's one concrete workflow. Your scroll map shows only 28% of visitors reach the CTA at the bottom of the page. Hypothesis: moving the CTA above the fold and strengthening the value proposition in the first viewport will increase conversions. You A/B test the new layout. The test runs for two weeks, and the variant with the repositioned CTA converts at 4.7% versus the original's 2.1%.
That's heatmap analysis turned into a measurable conversion rate optimization win. The heatmap identified the problem. The experiment confirmed the fix. Teams looking to build a structured testing program should also explore dedicated CRO tools that complement heatmap data.
When static content fails, show instead of tell
Heatmap data often reveals a specific pattern: visitors click on product screenshots, hover over feature descriptions, and scroll past static explanations without engaging. Click maps light up around visual elements - but when those elements are non-interactive, you get dead clicks and drop-offs.
One approach that addresses this pattern: replacing static product content with interactive demos that let visitors experience the product themselves. Teams embedding interactive demos on pages they're already analyzing with heatmaps can measure the before-and-after impact directly - and tools like Guideflow make it possible to create and embed these experiences without engineering dependencies. You can even build a demo center to centralize all your product experiences in one place.
Prioritize changes by impact, not ease
Use heatmap data to build a CRO backlog prioritized by estimated conversion impact, not by implementation ease. Rage clicks on a broken element affecting 40% of visitors should rank higher than a font size tweak on a low-traffic page. Tag each heatmap finding with: (a) what percentage of visitors it affects, (b) how close the affected area is to a conversion event, and (c) estimated effort to fix. This framework turns a wall of heatmap observations into a ranked list of experiments. For teams pairing heatmap insights with product analytics software, the prioritization becomes even more data-driven.
Closing
The right heatmap tool depends on your traffic volume, budget, stack, and whether you need heatmaps alone or as part of a broader behavior analytics platform. No budget: Microsoft Clarity. All-in-one: Hotjar. CRO loop: Crazy Egg or VWO. Enterprise: Contentsquare or Glassbox. Open-source: PostHog.
Heatmaps show you the problem. What you build to respond - better copy, restructured pages, interactive product experiences - is what actually moves conversion rates.
Want to see how interactive demos can improve the pages your best heatmap tools are already tracking? Start with Guideflow.