Your activation funnel dropped on Monday. The dashboard updated Tuesday morning. By then, the users you could have nudged through onboarding have already churned or gone quiet.
This is not a data quality problem. It is a timing problem. Batch pipelines process yesterday's events, which means product decisions that depend on user behavior arrive too late to matter. The real question is not whether you need streaming. It is whether you need a decision within seconds, minutes, or hours, and what the lowest-complexity architecture looks like to get there.
The global streaming analytics market reached $44.55 billion in 2025 and is projected to hit $57.08 billion in 2026, according to Fortune Business Insights. That growth reflects a real shift: Teams that instrument product telemetry, fraud signals, and operational events are moving from nightly jobs to continuous pipelines because the decision window has compressed.
Which stream analytics software gives you the latency you need without creating a platform your product team cannot operate?
What's inside
This guide is for product managers, data platform leads, and engineering managers evaluating streaming analytics tools for real-time product telemetry, operational events, or fraud and anomaly workflows.
- Nine stream analytics software tools covering open source engines, managed cloud services, CDC platforms, and graph databases
- How the tools differ by layer: Event transport, processing engine, managed service, or integration platform
- Selection criteria: Latency target, operational ownership, downstream integrations, and pricing model
- A buyer checklist for instrumentation quality, schema governance, and release cadence
The list does not treat every tool as interchangeable. A managed cloud service and an open source processing framework require different evaluation criteria.
TL;DR
- Best for enterprise event streaming: Confluent handles managed Kafka with governance, ecosystem connectors, and multi-cloud deployment for organizations standardizing event infrastructure across teams.
- Best for complex stateful processing: Apache Flink excels at event-time logic, windowed aggregations, and durable stateful jobs where out-of-order events matter.
- Best for event transport backbone: Apache Kafka fits teams building an event-driven architecture that multiple downstream systems will consume.
- Best for teams already on Spark: Apache Spark unifies batch, SQL, and streaming workloads without switching execution models.
- Best for cloud-native streaming: Choose Amazon Kinesis Data Streams, Google Cloud Dataflow, or Azure Stream Analytics based on your cloud commitment.
- Best for CDC-led pipelines: Striim moves operational database changes into warehouses or cloud destinations with low latency and built-in transformation.
- Best for graph-based event relationships: Memgraph handles streaming workloads where relationships between entities, such as fraud rings or recommendation graphs, drive the query.
What is stream analytics software?
Stream analytics software ingests, processes, enriches, and analyzes continuous event data while it is still arriving, allowing teams to trigger decisions or update systems with low latency.
Rather than waiting for a scheduled batch job, stream analytics software reads events as they flow from sources such as product clickstreams, app logs, database changes, IoT devices, payment transactions, and support interactions. It then filters, aggregates, joins, and enriches those events before delivering outputs to warehouses, operational databases, dashboards, alerting systems, or machine learning pipelines.
How stream analytics software works
- Event sources: Product events, app logs, database changes, IoT sensors, payment streams, and clickstreams enter the system continuously
- Ingestion or transport: Events land in a broker, managed stream, or platform that holds them durably
- Processing: The engine applies filters, windowed aggregations, joins, enrichments, event-time logic, or pattern detection
- Delivery: Processed outputs reach data warehouses, operational databases, alerting systems, dashboards, or customer-facing features
- Measurement: Teams track latency, completeness, error rates, cost, and whether the downstream product metric moved
Key features to look for
- Event-time and processing-time support
- Stateful transformations and windowing
- Exactly-once or at-least-once delivery options
- Schema registry and data contract support
- Change data capture connectors
- Warehouse, lakehouse, and BI integrations
- Monitoring, replay, and recovery controls
- Managed scaling and security controls
- SQL, Java, or Python development options
Stream processing vs batch processing
| Dimension | Stream analytics | Batch analytics |
|---|---|---|
| Data arrival | Continuous events | Scheduled files or tables |
| Typical latency | Milliseconds to minutes | Hours to days |
| Best for | Alerts, personalization, fraud, operational workflows | Reporting, historical analysis, large backfills |
| Operational complexity | Higher | Lower |
| Main risk | Cost and maintenance without a clear decision window | Decisions arrive too late |
Batch still wins for historical reporting, lower-urgency workloads, and cost-sensitive pipelines. Do not add streaming infrastructure for a dashboard that refreshes every two hours.
When to use stream analytics software
Trigger an action while the event still matters
Fraud scoring, inventory alerts, account security events, in-product guidance triggers, and operational anomaly detection all share one trait: The action loses value if it waits until morning. Define the action before choosing the engine. If no system behavior changes when data arrives sooner, streaming may not justify its operational cost.
Keep product telemetry current enough for experimentation
Activation funnel drops, feature adoption gaps, trial-to-paid conversion signals, and lifecycle interventions require lower-latency event pipelines to support real decisions. Instrument carefully first. Faster bad data only creates faster confusion, and a product analytics stack cannot compensate for broken event schemas.
Combine operational changes with analytical destinations
Change data capture turns database inserts, updates, and deletes into a continuous event feed. Teams use this to sync account status, entitlement changes, and support context into warehouses, search indexes, or operational dashboards without waiting for nightly ETL. This is distinct from a scheduled extract: The data moves when the change happens, not when the clock hits midnight.
Stream analytics software comparison
These nine tools occupy different layers of the stack. Kafka and Confluent provide event transport and governance. Flink and Spark process events. Kinesis, Dataflow, and Azure Stream Analytics manage execution in specific clouds. Striim specializes in CDC and integration. Memgraph handles graph-based relationship queries. Evaluate each against the layer your bottleneck actually sits in.
Pricing and G2 ratings verified October 2026 from vendor pricing pages and live G2 listings.
| # | Product | Best for | Key differentiator | Pricing | G2 rating |
|---|---|---|---|---|---|
| 1 | Confluent | Enterprise event streaming platform | Managed Kafka with Schema Registry and 120+ connectors | Free tier; paid from \~$385/month | 4.4/5 |
| 2 | Apache Flink | Complex stateful, event-time processing | Advanced stream processing with exactly-once semantics | Open source; infrastructure costs vary | 4.3/5 |
| 3 | Apache Kafka | Durable event streaming backbone | Distributed event log with broad connector ecosystem | Open source; infrastructure costs vary | 4.5/5 |
| 4 | Apache Spark | Teams already running Spark workloads | Unified batch, SQL, ML, and streaming engine | Open source; infrastructure costs vary | 4.3/5 |
| 5 | Amazon Kinesis Data Streams | AWS-native stream ingestion | Fully managed AWS streaming with on-demand scaling | From $0.032/GB ingested | 4.3/5 |
| 6 | Google Cloud Dataflow | Google Cloud streaming and ETL pipelines | Managed Apache Beam for batch and streaming | From $0.06/count (batch) | 4.2/5 |
| 7 | Azure Stream Analytics | SQL-first Azure stream processing | Managed SQL-based processing with edge support | Pay-as-you-go per Streaming Unit | N/A |
| 8 | Striim | CDC and continuous data integration | Low-latency ingestion, transformation, and delivery | Free Developer tier; paid plans via sales | 5.0/5 |
| 9 | Memgraph | Relationship-heavy streaming workloads | In-memory graph database with real-time graph queries | Free Community Edition; Enterprise via sales | 5.0/5 |
Best 9 stream analytics software tools for 2026
1. Confluent
Confluent is a cloud-native streaming data platform built on Apache Kafka. It packages managed Kafka clusters, stream processing via Apache Flink and ksqlDB, Schema Registry governance, and more than 120 pre-built connectors into a single managed service. Teams use it across AWS, Google Cloud, and Azure without maintaining their own Kafka infrastructure.
Best for: Product and data organizations standardizing event streams across multiple teams, products, and downstream systems.
Key features
- Fully managed Kafka clusters with autoscaling
- 120+ connectors for data integration via Kafka Connect
- Stream processing with Apache Flink and ksqlDB
- Schema Registry for data discovery and governance
- Enterprise security: RBAC, encryption, audit logs, and private networking
Why choose Confluent: It fits teams where Kafka is becoming shared infrastructure rather than a single-team project pipeline. Schema governance and reusable event topics reduce metric drift across product, data, and lifecycle teams, which matters when multiple squads instrument the same product surface. The tradeoff is cost: Shared event platforms can become expensive when topic standards, retention policies, and consumer ownership are undefined from the start.
Confluent pricing: A Basic serverless cluster starts free. Standard clusters run approximately $385/month as an estimated starting cost, Enterprise approximately $895/month, and Freight approximately $2,300/month. Actual spend scales with compute, data transfer, storage, connector usage, governance features, and support tier. Confluent publishes consumption-based pricing at confluent.io/pricing.
G2 rating: 4.4/5 (verified October 2026).
2. Apache Flink
Apache Flink is an open source distributed processing engine for stateful computations over unbounded and bounded data streams. It supports both stream and batch processing from one runtime, with native event-time handling, late-data correction, and exactly-once state consistency. Many managed Kafka and streaming platforms, including Confluent, now offer Flink as their processing layer.
Best for: Engineering teams that need fine-grained control over continuous calculations and can own a sophisticated stream-processing environment.
Key features
- Exactly-once state consistency with checkpoint snapshots
- Event-time processing and late-data handling
- Windowed aggregations: Tumbling, sliding, session windows
- SQL and DataStream APIs for flexible development
- Stateful stream operations with durable state backends
Why choose Apache Flink: Choose Flink when product or operational logic depends on out-of-order events, session windows, or state that must survive failures. For product managers: Event-time support matters when users go offline, mobile events arrive late, or multi-device actions need accurate sequencing before they reach a retention metric. It is not a quick dashboard tool.
Apache Flink pricing: Flink is open source with no paid tiers from the Apache project. Production cost comes from infrastructure, managed service providers such as AWS Managed Service for Apache Flink or Confluent, observability tooling, storage, and engineering time.
G2 rating: 4.3/5 (verified October 2026).
3. Apache Kafka
Apache Kafka is an open source distributed event streaming platform and durable event log. It provides the transport and storage layer for events: Producers write to topics, consumers read at their own pace, and the log retains events for replay. Many organizations pair Kafka with a processing engine or analytics destination for richer event-time computation.
Best for: Teams building an event-driven architecture or consolidating high-volume application events into a shared, reliable stream that multiple systems can consume independently.
Key features
- Durable, fault-tolerant event log with configurable retention
- Topic partitioning for parallel consumption and ordering
- Consumer groups for independent, scalable reads
- Kafka Connect for importing and exporting data
- Kafka Streams library for lightweight stream processing
Why choose Apache Kafka: Kafka prevents teams from building one-off event exports for every downstream use case. When multiple systems, such as a warehouse, a real-time dashboard, and an alerting service, need the same event stream, Kafka makes that possible without duplicating producers. Keep in mind it does not provide a query layer, transformation engine, or warehouse. A plan for downstream consumption, governance, and schema management is still required.
Apache Kafka pricing: Kafka is open source. Production costs come from self-managed infrastructure or a managed Kafka provider, plus storage, network traffic, operations, and connector usage. Managed providers include Confluent Cloud, AWS MSK, and others with their own pricing structures.
G2 rating: 4.5/5 (verified October 2026).
4. Apache Spark
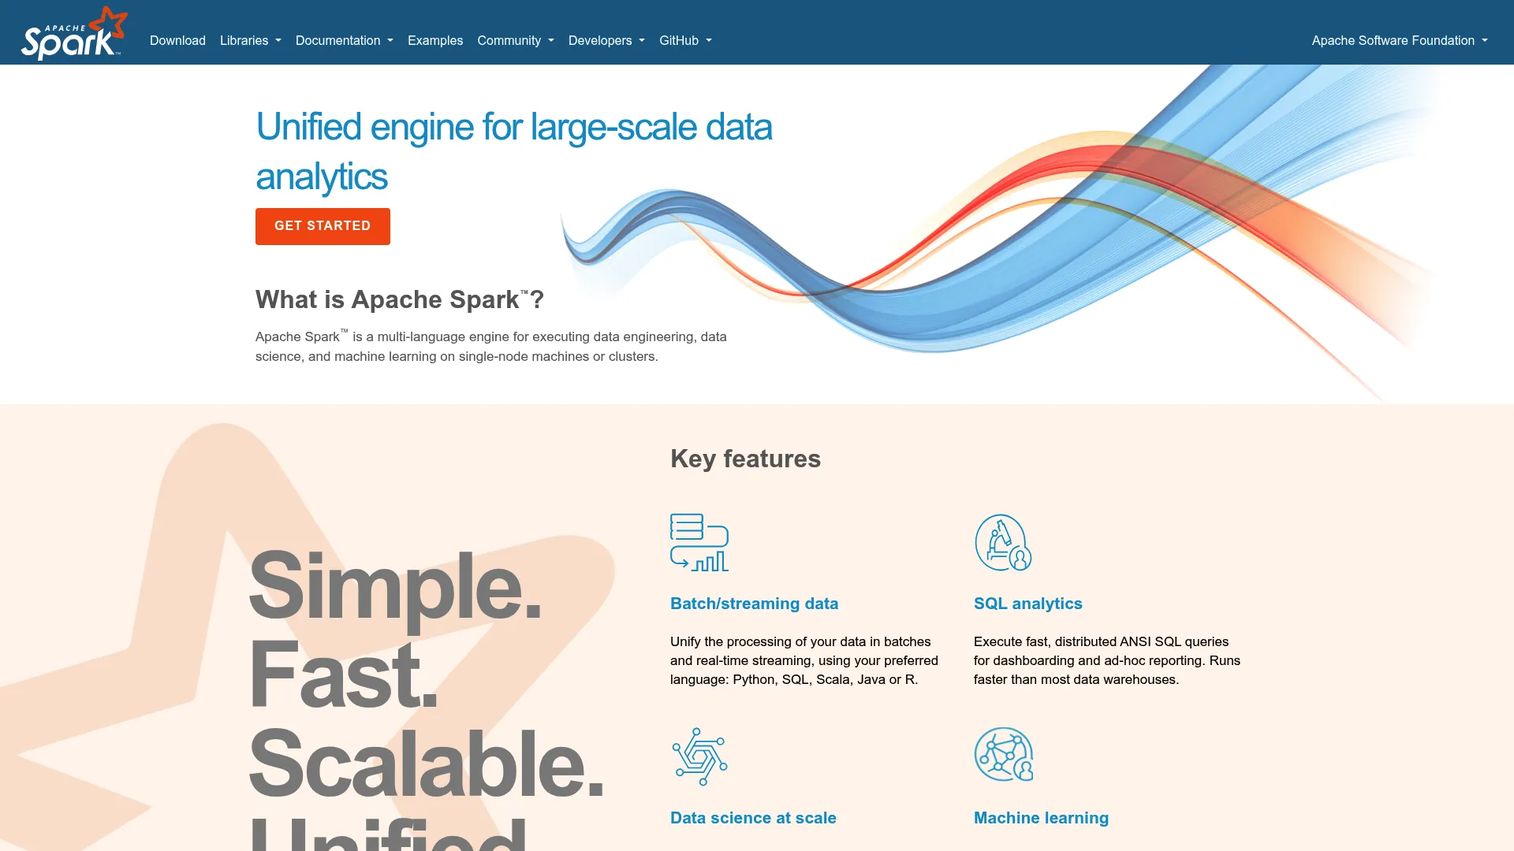
Apache Spark is an open source unified analytics engine that handles batch processing, SQL queries, machine learning, and structured streaming from one runtime. Teams already invested in Spark for data engineering or lakehouse workflows can extend the same execution model to streaming without switching frameworks.
Best for: Data teams that want one execution model for historical analysis and near-real-time streaming workloads, particularly those already running Spark on managed platforms.
Key features
- Structured Streaming API for incremental stream processing
- Spark SQL for distributed ANSI SQL analytics
- Batch and streaming workloads from a single runtime
- MLlib for scalable machine learning pipelines
- Broad storage integrations with lakehouses and warehouses
Why choose Apache Spark: Operational consolidation is the main argument. When the team already has Spark skills, data assets in a lakehouse, and a managed Spark cluster, extending to streaming avoids introducing a second execution model. For product analytics teams, unified batch and streaming workflows help reconcile near-real-time activation indicators with historical cohort analysis in the same job.
Apache Spark pricing: Spark is open source. Cost drivers are infrastructure, managed platform fees (such as Databricks or AWS EMR), compute hours, storage, and job runtime. Teams seeking ultra-low-latency event processing should validate Spark's processing semantics against their specific workload before committing.
G2 rating: 4.3/5 (verified October 2026).
5. Amazon Kinesis Data Streams
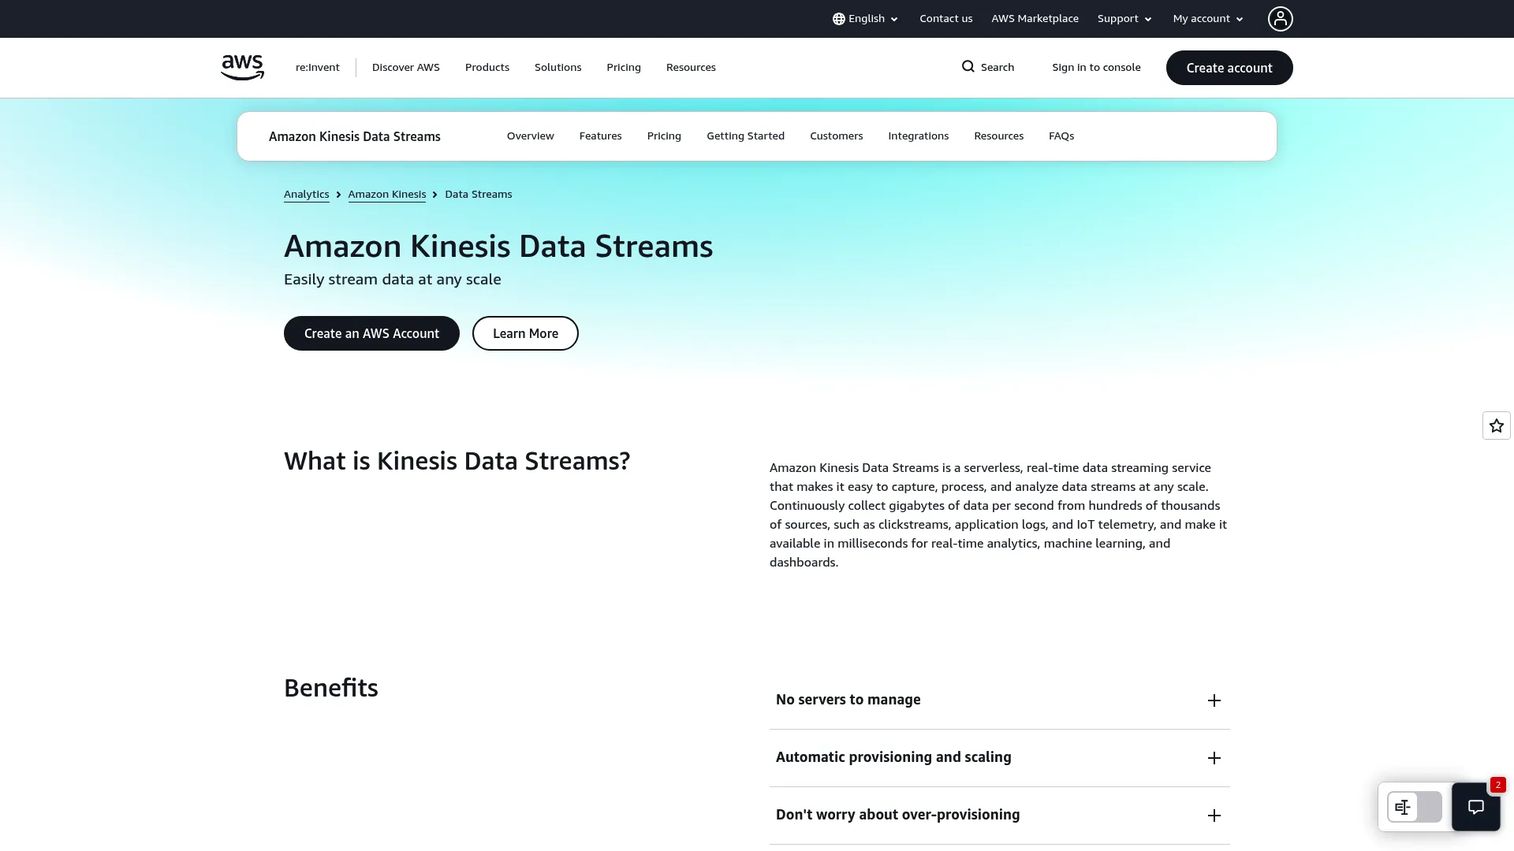
Amazon Kinesis Data Streams is a managed service for collecting and processing real-time data streams within AWS. It handles clickstream capture, application telemetry, IoT data, and operational events without requiring cluster management. The service synchronously replicates across three Availability Zones and delivers data to consumers within 70 milliseconds.
Best for: Product and platform teams committed to AWS that need managed event ingestion tightly integrated with Lambda, S3, CloudWatch, and other AWS services.
Key features
- Serverless on-demand mode with automatic capacity scaling
- Shard-based provisioned mode for predictable throughput
- Data retention up to 365 days with replay controls
- Up to 20 consumers with dedicated read throughput
- Native integrations with AWS Lambda, S3, and CloudWatch
Why choose Amazon Kinesis Data Streams: If the product already runs on AWS and the team wants to avoid Kafka cluster management, Kinesis reduces operational overhead while staying inside the AWS security and IAM model. Ask whether the cloud commitment fits the long-term platform strategy before selecting it, because migrating event infrastructure later is expensive.
Amazon Kinesis Data Streams pricing: The on-demand Standard tier starts at $0.032 per GB ingested and $0.016 per GB retrieved. Provisioned mode runs $0.015 per shard hour plus $0.014 per million PUT Payload Units. Extended retention and enhanced fan-out add separate charges. Total cost scales with throughput, retention, and consumer count.
G2 rating: 4.3/5 (verified October 2026).
6. Google Cloud Dataflow
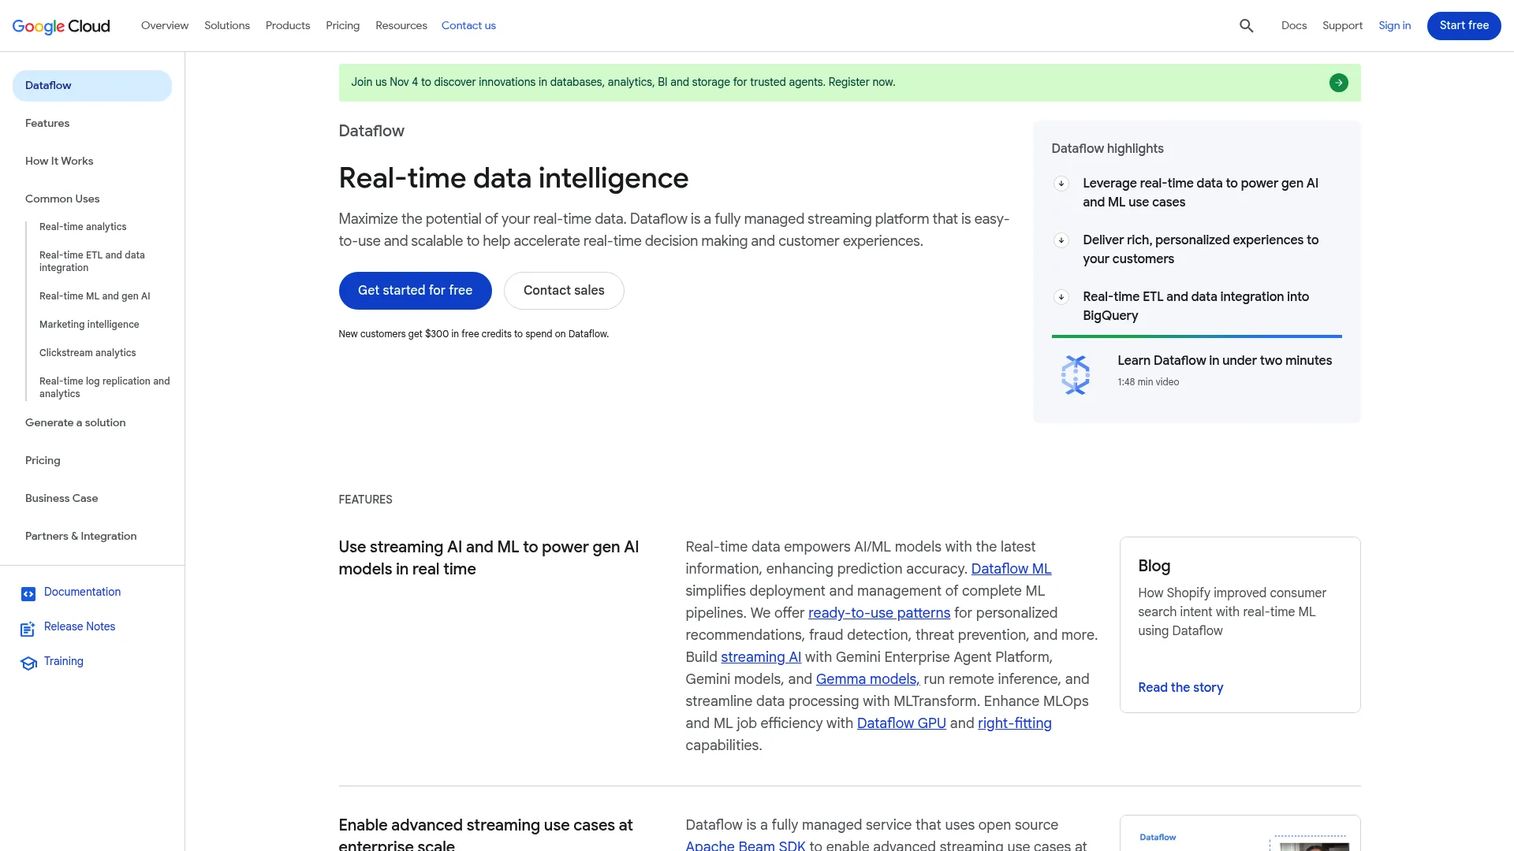
Google Cloud Dataflow is a fully managed service for running Apache Beam pipelines across batch and streaming workloads. It handles autoscaling, resource management, and execution, while developers write pipelines using the Beam SDK in Java or Python. The service integrates with Pub/Sub, BigQuery, Cloud Storage, and other Google Cloud products.
Best for: Teams building streaming ETL, data enrichment, and warehouse delivery pipelines on Google Cloud who want managed execution with a portable programming model.
Key features
- Apache Beam programming model for batch and streaming
- Managed autoscaling and serverless resource management
- Windowing and watermark support for event-time processing
- Streaming Engine and Dataflow Shuffle for efficiency
- Integration with Pub/Sub, BigQuery, and Cloud Storage
Why choose Google Cloud Dataflow: The Apache Beam model is portable across runners, which matters if the team may want to run the same pipeline logic on a different execution engine later. For product telemetry pipelines that need to clean, enrich, and route events into BigQuery before they reach predictive analytics or operational systems, Dataflow removes cluster administration. Pipeline design directly affects cost, so a well-structured pipeline matters more than raw pricing.
Google Cloud Dataflow pricing: Batch jobs start at $0.06 per count. Streaming jobs run $0.089 per count, with one-year committed use discounts bringing that to $0.0712 and three-year to $0.0534. Dataflow Prime uses Data Compute Units for an alternative billing model. New Google Cloud customers receive $300 in free credits.
G2 rating: 4.2/5 (verified October 2026).
7. Azure Stream Analytics
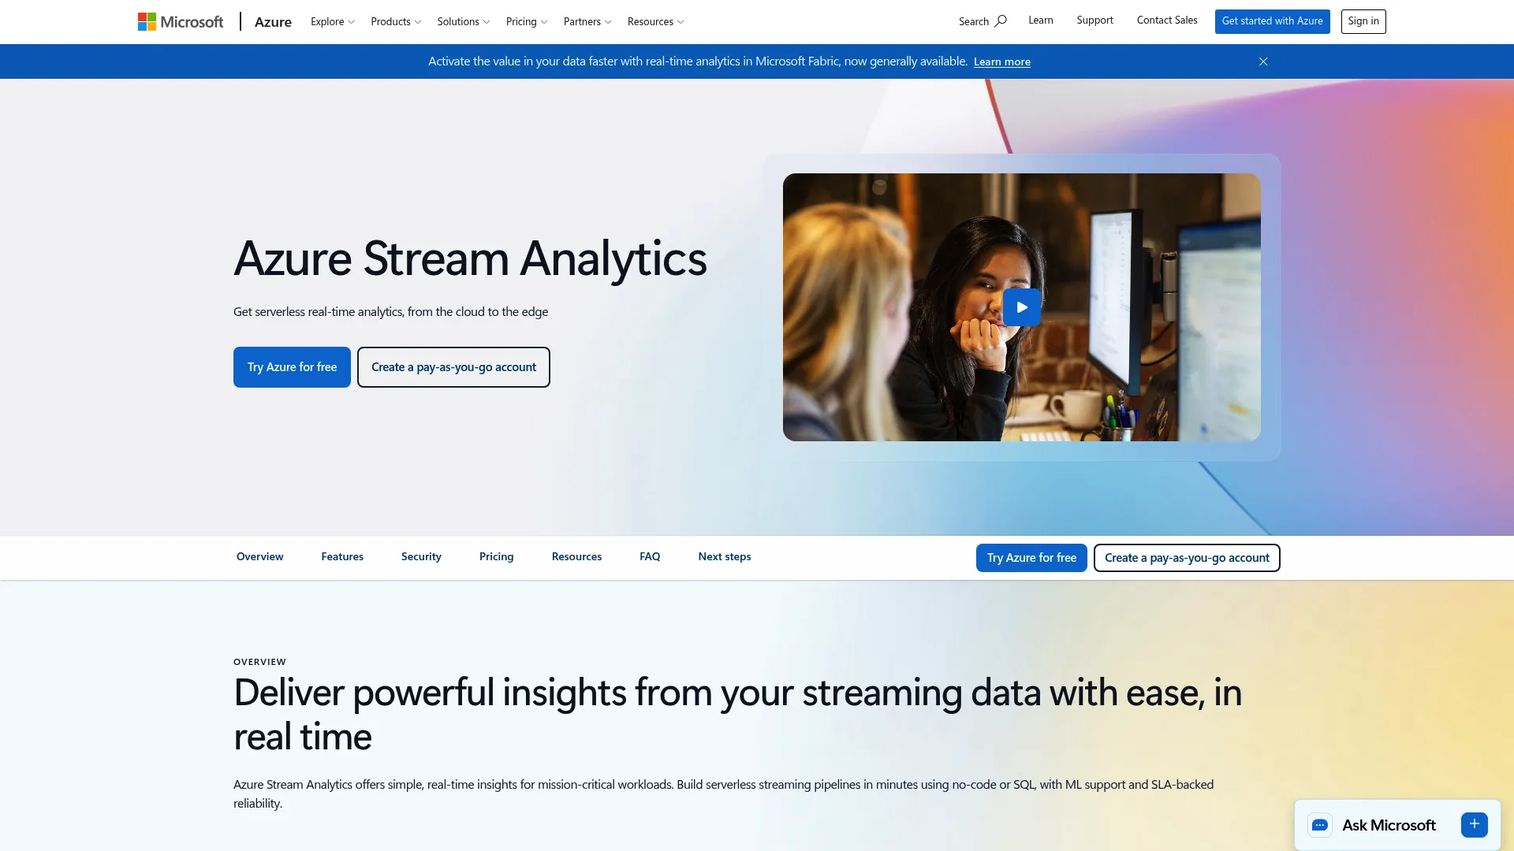
Azure Stream Analytics is a managed Azure service for real-time stream processing using SQL-like queries. It reads from Azure Event Hubs and IoT Hub, processes events using a declarative query language, and delivers results to Azure storage, databases, Power BI, and other destinations. Edge deployment allows the same processing logic to run closer to the data source.
Best for: Teams using Azure services that prefer SQL-based stream processing for dashboards, operational alerting, and continuous analytics without writing custom application code.
Key features
- SQL-like query language for stream transformations
- Built-in anomaly detection using machine learning capabilities
- Elastic scaling with pay-as-you-go Streaming Units
- Integration with Azure IoT Hub and Event Hubs
- Edge and cloud deployment options with CI/CD support
Why choose Azure Stream Analytics: SQL accessibility shortens the path from a product question to a production data flow. Teams that already use Azure services and want to aggregate events, detect anomalies, or feed near-real-time dashboards without a Java or Python job can get there faster with a query-based approach. Validate late-event handling and stateful complexity before committing, because the SQL model has limits for sophisticated event-time logic.
Azure Stream Analytics pricing: The service uses pay-as-you-go Streaming Unit pricing. Microsoft's pricing page renders numerical values that vary by tier (Standard V2, Dedicated V2) and region. Check the Azure pricing calculator at time of planning because the figures are region-dependent and the official page displayed placeholder values during October 2026 verification.
8. Striim
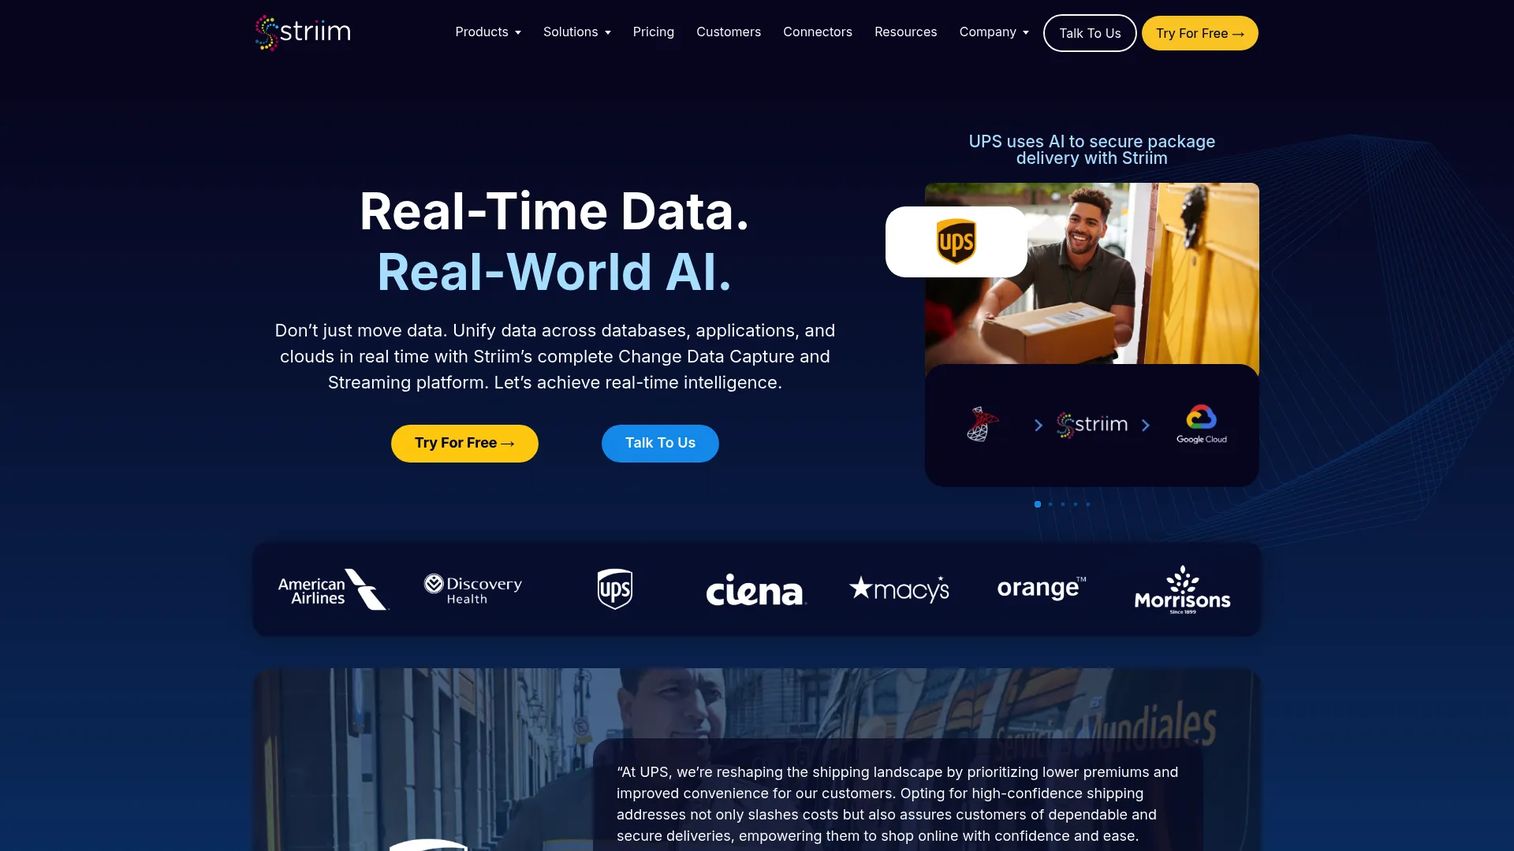
Striim is a real-time data integration and streaming platform built around change data capture and continuous data movement. It reads inserts, updates, and deletes directly from operational databases, applies SQL-based transformations and enrichment in flight, and delivers the results to cloud data warehouses, streaming systems, and analytics destinations. This is different from a nightly ETL job: The data moves when the change happens.
Best for: Data and platform teams moving operational database changes into warehouses, lakehouses, or analytics systems with lower latency than scheduled replication.
Key features
- Change data capture connectors for major databases
- SQL-based streaming transformations, filtering, and enrichment
- Hundreds of connectors for databases, warehouses, and streaming systems
- Schema evolution support and distributed pipeline recovery
- Real-time dashboards, anomaly detection, and AI agent capabilities
Why choose Striim: When the source of truth is an operational database and the business needs downstream updates without waiting for overnight replication, Striim fits that gap. Faster operational data can improve customer status visibility, onboarding orchestration, entitlement updates, and support context availability. The platform does not resolve unclear data ownership. CDC pipelines still require source database access, schema change coordination, and recovery testing.
Striim pricing: The Striim Developer plan is free, covering up to 25 million events per month. Striim Cloud, which is fully managed and usage-based, requires contacting sales. Striim Platform, the self-hosted option, is also priced through sales. The Striim pricing page is at striim.com/pricing.
G2 rating: 5.0/5 based on 1 review (verified October 2026).
9. Memgraph
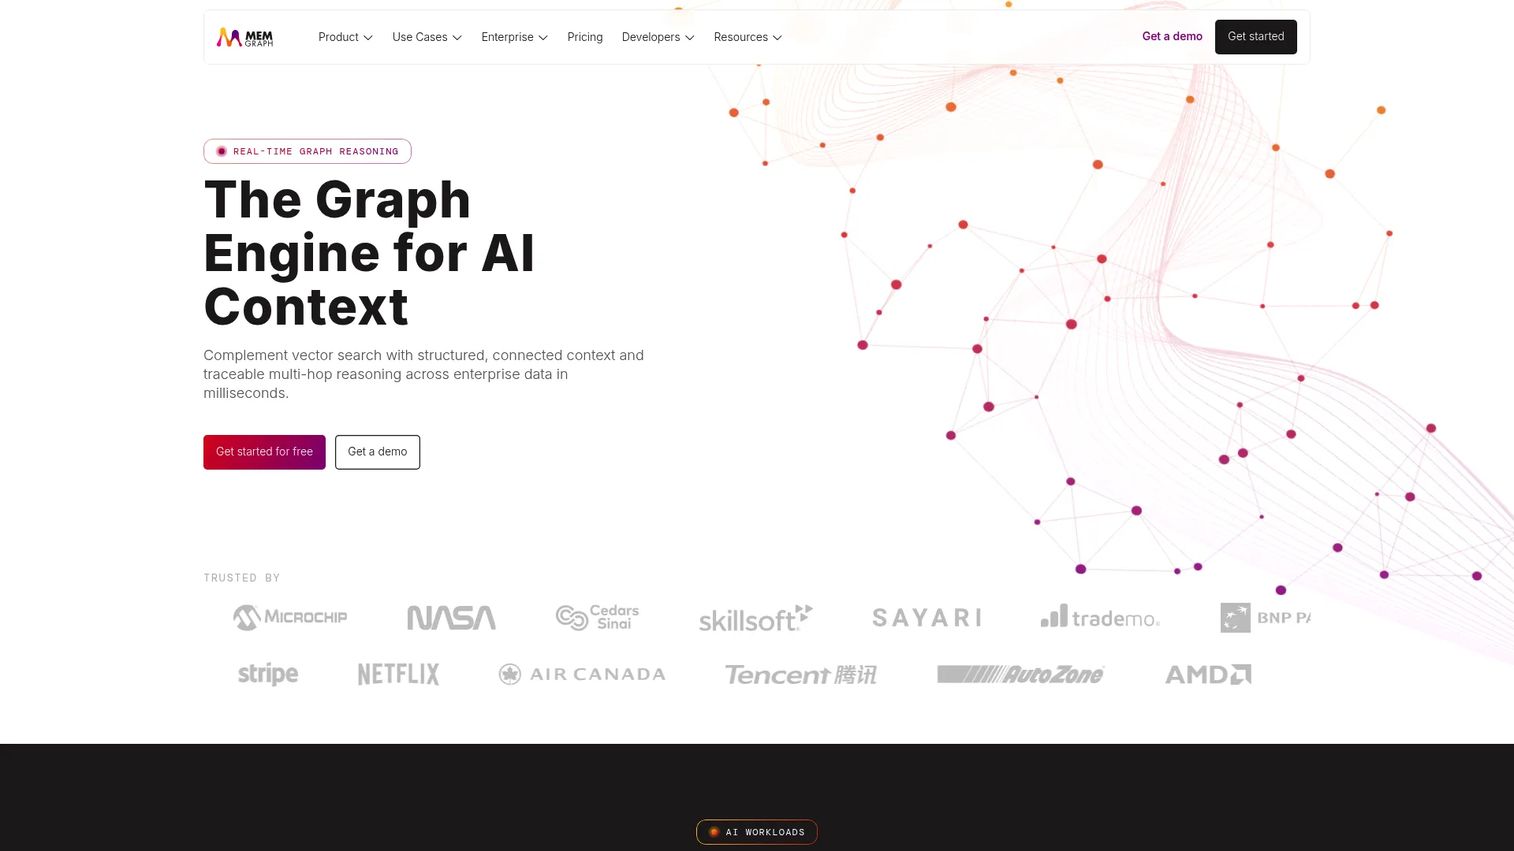
Memgraph is a high-performance, in-memory graph database built for real-time graph analytics and AI context. Unlike a general event stream processor, Memgraph focuses on relationships between entities: Who is connected to whom, how accounts relate, and what patterns emerge across nodes and edges. It ingests streaming data and runs Cypher queries against the resulting graph in real time.
Best for: Teams whose key product or operational questions depend on relationships between entities rather than aggregates over an individual event stream.
Key features
- In-memory graph database with ACID transactions and on-disk persistence
- Cypher query language with streaming connectors and vector search
- Built-in graph algorithms through MAGE (Memgraph Advanced Graph Extensions)
- Role-based and label-based access controls
- Fully managed AWS-hosted cloud service option
Why choose Memgraph: Graph databases address use cases that tabular aggregation handles poorly: Detecting connected fraud patterns across accounts and devices, identifying relationship structures that indicate churn risk, or powering recommendations based on graph proximity. If the core analytical question is "how are these entities connected," a graph database produces better answers than filtering event logs. Memgraph is a specialized tool. Do not position it as a replacement for a general event streaming platform or data visualization layer.
Memgraph pricing: The Community Edition is free and open source. Enterprise Edition is priced by memory capacity through sales. Memgraph Cloud includes a 14-day free trial followed by usage-based pricing. Check memgraph.com/pricing for current cloud plan structures.
G2 rating: 5.0/5 based on 2 reviews (verified October 2026).
Considerations when choosing stream analytics software
Define the latency target before you compare tools
"Real time" covers everything from 50 milliseconds to 15 minutes. Document the specific decision window your workflow requires. A five-second fraud alert and a fifteen-minute dashboard refresh are different requirements that point to different architectures. If scheduled batch processing already meets the decision window, a streaming stack adds cost and maintenance without changing an outcome.
Separate transport, processing, storage, and consumption
Many teams compare tools that occupy different layers. Draw a simple decision map: Where events enter, where they are retained, where transformations run, where queries happen, and where users or systems consume results. Buying a powerful event broker when the actual bottleneck is a warehouse transformation or inconsistent product instrumentation solves the wrong problem. Cross-referencing with a customer data platform evaluation can clarify which layer is actually missing.
Treat schema changes as part of release management
Every product release can alter event names, properties, and expected behaviors. Establish who owns event definitions, who approves changes, how consumers are notified, and how old events stay compatible. A stream pipeline cannot compensate for an undefined metric contract, and product analytics that depends on broken schemas produces unreliable activation and retention signals.
Model cost around volume, retention, and consumers
Usage pricing changes with throughput, stored data, retention duration, processing compute, egress, and the number of downstream consumers. Build a cost forecast using normal volume, planned growth, and a spike scenario. For analytics platforms that feed into business metrics, cost surprises during a traffic spike can become a product incident.
Verify observability and recovery before production
Evaluate dead-letter handling, replay, backfill, monitoring, alerting, state recovery, and visibility into dropped or late events. A low-latency pipeline that cannot be debugged creates pressure on product, engineering, and support teams during incidents. Ask vendors for incident runbooks, not just uptime SLAs.
Conclusion
Stream analytics software is not one category. It is a set of complementary layers that serve different architectural roles.
Confluent and Apache Kafka fit the event transport decision, where the question is how events move between producers and consumers reliably. Apache Flink and Apache Spark fit the processing engine decision, where the question is how to compute something meaningful from those events. Amazon Kinesis Data Streams, Google Cloud Dataflow, and Azure Stream Analytics fit the managed deployment decision, where the cloud provider is already chosen and operational overhead matters. Striim fits the operational data movement decision, particularly when database changes need to flow downstream faster than overnight ETL allows. Memgraph fits the graph-specific decision, where relationships between entities drive the analytical question.
Before scheduling vendor calls, write a one-page streaming use-case brief. Include the decision window, event sources, required transformations, downstream destinations, expected volume, who owns it, and the metric you will use to measure success. That document will tell you which layer needs attention and which tools belong in your shortlist.
Also see the best agentic analytics software guide for teams exploring AI-driven pipeline automation alongside stream processing infrastructure.
FAQs
Stream analytics software ingests and processes continuous event data as it arrives, rather than waiting for a scheduled batch job. It allows teams to trigger actions, update systems, or analyze user behavior with latency measured in seconds or minutes rather than hours. Common outputs include alerts, warehouse updates, operational dashboards, and machine learning signals.
Stream analytics is the technical method of processing continuous event streams, typically using a distributed processing engine or managed service. Real-time analytics is the business outcome, meaning that dashboards, alerts, or decisions reflect current data. You can achieve real-time analytics through stream processing, but also through fast databases, query caches, or frequent micro-batches depending on the latency requirement.
Kafka is primarily an event streaming platform and durable distributed log. It transports and stores events reliably, and it includes Kafka Streams for lightweight processing. Most organizations pair Kafka with a dedicated processing engine such as Apache Flink, a managed service, or a warehouse destination to perform the analytics. Kafka handles the transport layer; analytics typically happen downstream.
The answer depends on your cloud provider, event volume, latency target, existing warehouse, and engineering capacity. Teams on AWS often start with Kinesis. Teams on Google Cloud reach for Dataflow. Teams building a multi-team event backbone tend toward Confluent. For complex event-time logic tied to activation funnels or session analysis, Apache Flink provides the most control. Establish the latency target and the downstream destination first, then match the tool to those constraints.
Use batch when data can arrive later without changing the decision. Use streaming when an alert, a user experience trigger, a risk control, or an operational workflow loses value if it waits for the next scheduled run. A concrete test: Write down what action the data enables, then ask whether that action is less effective if it runs twelve hours later. If the answer is yes, streaming is worth the investment.
Change data capture (CDC) captures inserts, updates, and deletes from operational databases and publishes those changes downstream continuously rather than on a schedule. Teams use change data capture software to keep warehouses, search indexes, analytics systems, and operational workflows current with source database state. It is common in scenarios where account status, entitlement, or customer profile changes need to reach downstream systems within seconds rather than overnight.
Tools like Apache Flink and Google Cloud Dataflow use event-time processing, watermarks, and windowing to handle events that arrive after their logical timestamp suggests they should. The system waits a configurable amount of time before closing a window, then processes or discards late arrivals based on policy. Kafka retains events for replay, allowing reprocessing if a consumer missed events. The right approach depends on acceptable data completeness tradeoffs in your specific workload.
Connect the project to a defined product or operational outcome before implementation, then measure the delta. Examples include: Time to detect a fraud pattern, reduction in support tickets from stale account status, improvement in activation intervention timing because events arrive sooner, or reduction in manual data exports per week. Require a baseline measurement before the project starts. A faster pipeline that does not change a product metric is infrastructure cost with no return.