You have a launch stat that would land better as a visual. A quarterly report nobody reads because it is a wall of text. A LinkedIn post that needs a chart, not another paragraph. And the person who could design it is booked for the next two weeks.
That gap between having something worth showing and actually shipping it is where most marketing content stalls. The graphic design software market, which includes infographic tools, is valued at USD 10.51 billion in 2026 and projected to reach USD 19.59 billion by 2033, growing at a 9.3% CAGR, according to Coherent Market Insights (2026). Marketing and advertising users already hold the largest share of that market, per Maximize Market Research (2025). Which tells you something: marketers are the ones buying these tools, and they are buying them to move faster.
The right infographic software lets you turn a data point into a shareable asset in minutes, without filing a design ticket. The wrong one adds another subscription and another login to a stack that is already too crowded. This guide sorts the difference. If your work touches data visualization, campaign creative, or AI content creation, you will find a tool here that fits how you actually work, not how a designer wishes you did. For teams leaning harder on generative workflows, our roundup of AI design tools covers the adjacent territory.
What's inside
This guide is for marketers, growth teams, and operators who need polished visual assets without waiting on design. It covers seven infographic software tools, ranked by how well they fit a real marketing workflow, not a studio.
We chose each tool on four criteria that matter for campaign velocity:
- Template quality and library depth so you start from something usable, not a blank canvas
- Data visualization strength for charts, graphs, and maps that carry real numbers
- AI assistance that speeds up drafting, layout, and copy
- Sharing, export, and collaboration so assets move from draft to published without friction
Every price and rating below was verified against the vendor's own pricing page and live G2 listing.
TL;DR
Short on time? Here is the fast version:
- Best all-around free infographic maker: Canva, for its template depth and near-zero learning curve
- Best for branded reports and repeatable team workflows: Piktochart
- Best for anyone already in the Adobe ecosystem: Adobe Express
- Best for data-heavy, interactive visuals: Infogram
- Best for business one-pagers and client-ready collateral: Venngage
- Best for teams that want one tool for infographics, decks, and reports: Visme
- Best for fast, lightweight social and ad graphics: Snappa
Most of these have a free tier worth testing before you pay. Match the tool to your dominant use case, not to the longest feature list.
What is infographic software?
Infographic software is a tool that turns data, text, and visual elements into a single designed graphic that communicates information faster than plain copy. It combines a drag-and-drop editor, a template library, and charting tools so people without design training can produce professional visuals.
Most infographic makers share a common set of capabilities:
- Template library: pre-built layouts for infographics, reports, one-pagers, and social posts
- Drag-and-drop editor: move, resize, and restyle elements without code
- Charts and graphs: bar, line, pie, donut, and more, often fed from a spreadsheet
- Maps and diagrams: geographic and process visuals for data storytelling
- Icons and illustrations: libraries of assets to replace stock-photo clutter
- AI assistance: generated layouts, copy, and design suggestions
- Brand kit: saved colors, fonts, and logos to keep every asset on-brand
- Export and share: PNG, PDF, and interactive embeds for web, email, and social
Marketers use these tools to build campaign visuals, turn reports into shareable summaries, produce lead magnets, and create social media graphics at the pace a content calendar demands. The best infographic software removes the design bottleneck without removing brand control.
When to use infographic software
Not every asset needs a designer. These are the moments where an infographic maker earns its place in a marketer's stack.
Launch campaigns and announcements
A product launch, a feature update, or a milestone stat lands harder as a visual than a paragraph. Infographic software lets you package the key numbers into a graphic you can drop into a blog post, an email, or a social campaign the same day the news breaks. No back-and-forth with design, no lost momentum.
Turn data into content assets
A report full of tables is a report nobody shares. Charts, maps, and visual summaries travel further because they are scannable and quotable. When you turn a survey result or a benchmark into a clean infographic, you give your audience something they can screenshot, cite, and pass along, which is exactly how top-of-funnel content earns reach.
Create branded assets without design dependency
The real value for a lean team is independence. With a brand kit locked in, a marketer can produce five on-brand assets in the time it used to take to brief one. That means campaign visuals ship on your timeline, not the design queue's, and your brand stays consistent across every touchpoint.
Comparison table
The table below ranks the shortlist by fit for a marketing workflow: how fast you can produce a branded asset, how well it handles data, and what it costs to get started. Pricing and G2 ratings were verified at the time of writing.
| # | Product | Intent | Key use case | Pricing | G2 rating |
|---|---|---|---|---|---|
| 1 | Canva | Fast, template-driven visuals | Broad creative work, quick infographics, social graphics | Free; Pro US$144/year | 4.7/5 |
| 2 | Piktochart | Branded reports and team workflows | Infographics, reports, presentations | Free; Pro from $10/member/mo | 4.4/5 |
| 3 | Adobe Express | Brand-safe creation in the Adobe ecosystem | Social, photo, and video content plus infographics | Free; Premium US$9.99/mo | 4.5/5 |
| 4 | Infogram | Data-led interactive visuals | Interactive charts, maps, embedded reports | Free; Pro $19/mo | 4.7/5 |
| 5 | Venngage | Business visuals and one-pagers | Infographics, reports, client collateral | Free; Premium $10/mo | 4.7/5 |
| 6 | Visme | All-in-one branded content | Infographics, decks, documents, data visuals | Free; Starter $12.25/mo | 4.5/5 |
| 7 | Snappa | Fast social and ad graphics | Social posts, ad creative, lightweight infographics | Free; Pro from $10/mo | 4.6/5 |
1. Canva
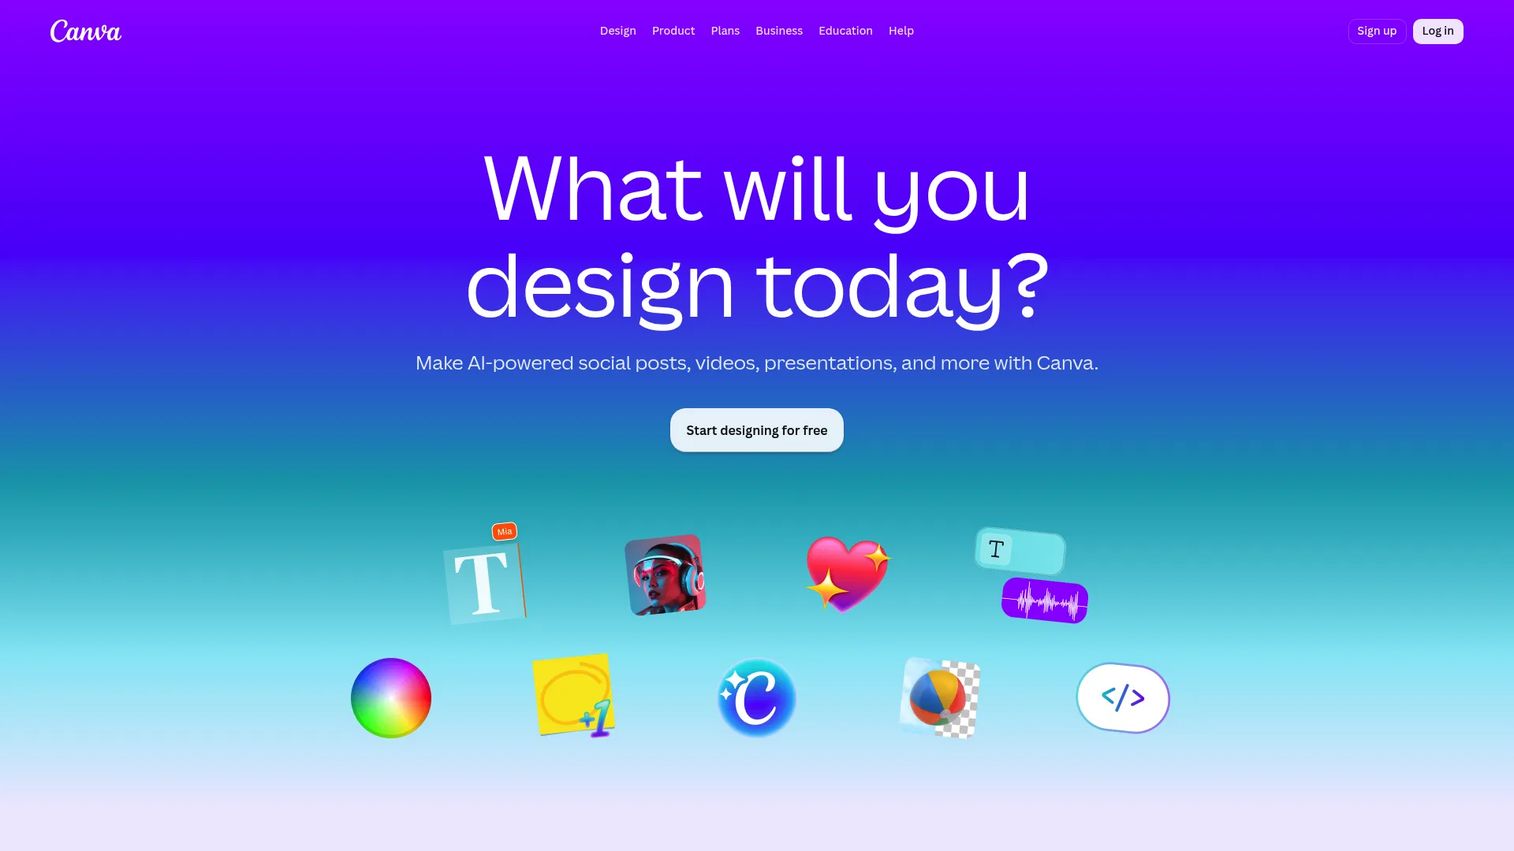
Canva is the online visual design platform most marketers reach for first, and for good reason. It pairs a massive template library with a drag-and-drop editor that anyone can learn in an afternoon. Beyond infographics, it covers presentations, social graphics, documents, and video, which makes it the closest thing to a single creative workspace for a small team. If consolidation is on your mind, Canva often replaces two or three narrower tools at once.
For a marketer, the appeal is speed. You search a template, swap in your data, apply your brand colors, and export, all inside one browser tab. The AI-powered design tools help when you are staring at a blank canvas, generating layouts and copy suggestions so you are editing rather than starting from scratch.
Best for: Teams and individuals who need fast, template-driven visual content across many formats, not just infographics.
Key strengths
- Template and asset library: One of the deepest libraries available, so most infographics start from something close to finished.
- Drag-and-drop editor: Low enough learning curve that non-designers ship on day one.
- AI-powered design tools: Generated layouts and copy that cut blank-canvas paralysis.
Why choose Canva: If your team produces a wide mix of visual content and you want one tool that covers infographics, decks, and social posts, Canva is the safest default. It is the entry point that scales with you, from a solo marketer to a full brand team using shared templates and a locked brand kit.
Canva pricing: The Free plan is US$0/year and genuinely usable for most one-off infographics. Canva Pro runs US$144/year for one person and unlocks the brand kit, premium templates, and more export options. Additional business and education plans are listed on Canva's pricing page. Canva holds a 4.7/5 rating on G2.
2. Piktochart
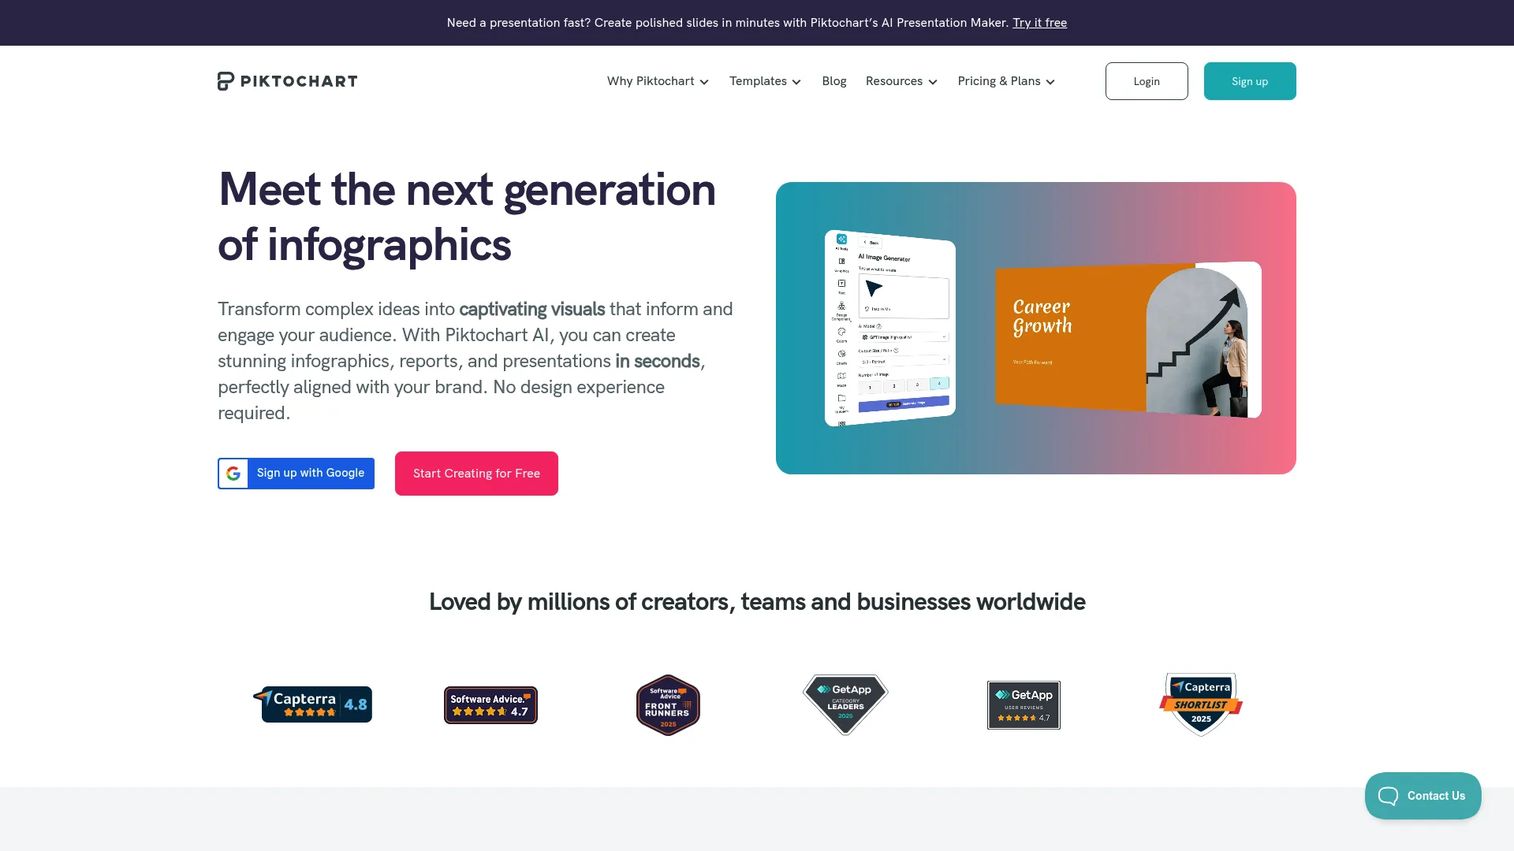
Piktochart is an online visual communication platform built specifically around infographics, reports, and presentations. Where Canva spreads across every format, Piktochart leans into the business-visual use case, which is exactly what a marketer producing a monthly report or a data-backed one-pager needs. Its templates skew toward structured, information-dense layouts rather than purely decorative ones.
The tool's AI studio and chart builders make it straightforward to move from a spreadsheet to a branded visual. For teams, the collaboration and brand asset features keep everyone pulling from the same fonts, colors, and logos, which matters when five people are producing content off one brand system.
Best for: Teams and individuals creating branded infographics, reports, and presentations quickly.
Key strengths
- Infographic-first templates: Layouts built for information density, not just aesthetics.
- Report and presentation support: One tool for the recurring report cadence marketers own.
- Brand assets and collaboration: Shared brand controls keep team output consistent.
Why choose Piktochart: Choose Piktochart when your output is skewed toward reports and structured business visuals rather than a broad creative mix. Teams pick it for repeatable content workflows: the same monthly report, refreshed with new data, on-brand every time, without rebuilding from scratch.
Piktochart pricing: The Free plan is $0. Pro is $10 per member/month billed annually or $15 billed monthly. Business runs $17 per member/month billed annually or $20 monthly. Education, Nonprofit, Enterprise, and Campus plans are also available, with Enterprise and Campus on custom pricing. Piktochart holds a 4.4/5 rating on G2.
3. Adobe Express
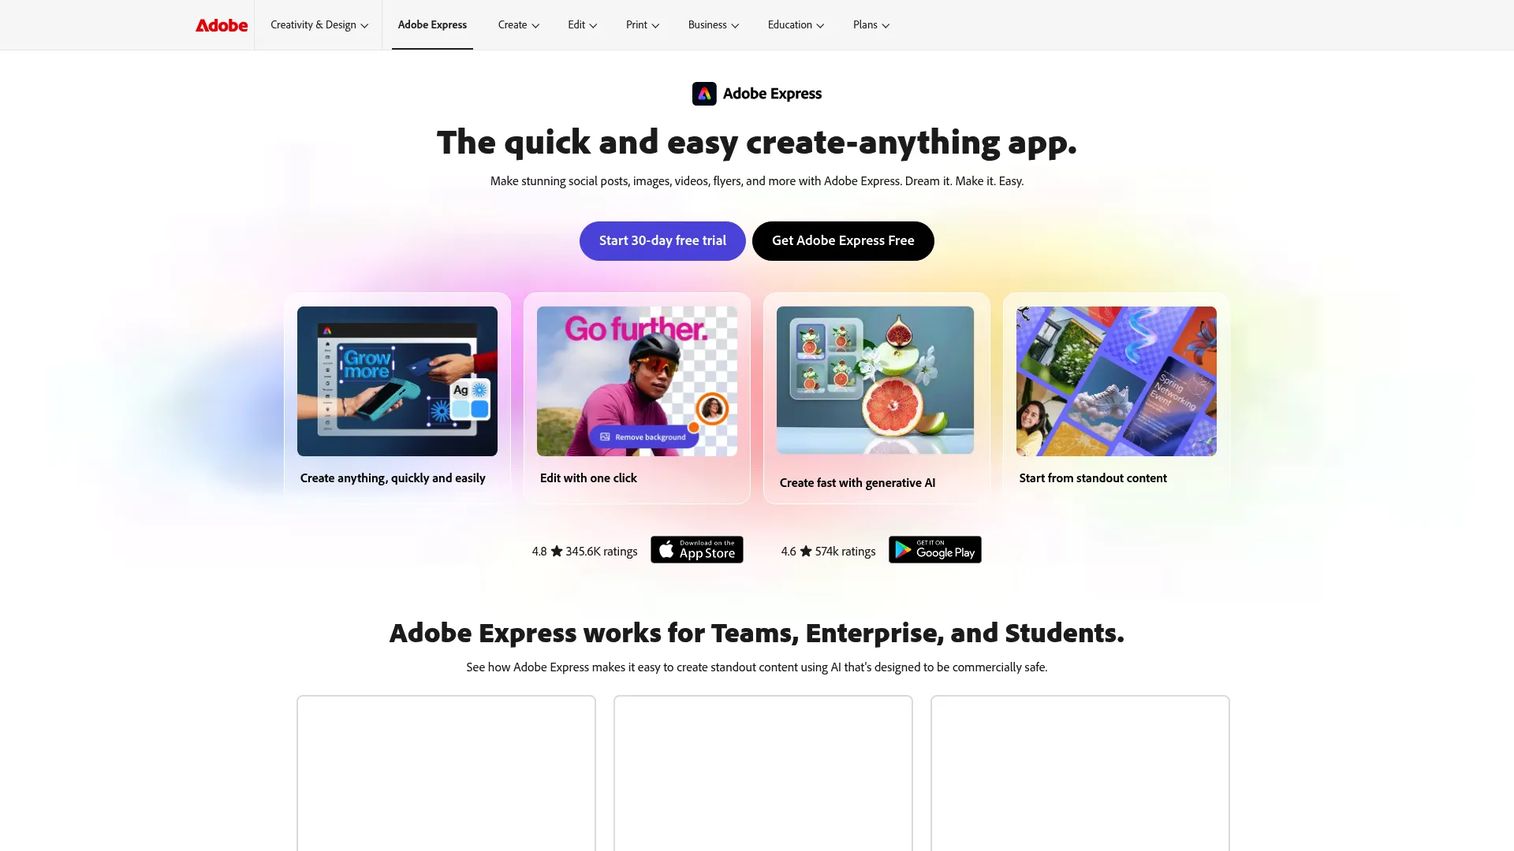
Adobe Express is Adobe's all-in-one design, photo, and video content tool built for people who want the Adobe name without the Creative Cloud learning curve. It handles quick infographic creation alongside social posts, photo editing, and short video, with a template library and stock assets baked in. For marketers already living in the Adobe ecosystem, it slots in cleanly and pulls from familiar fonts and brand assets.
The generative AI credits and quick-action editing tools are the draw here. You can remove a background, generate an image, or restyle a layout without leaving the editor, which keeps a campaign asset moving from idea to export in one session.
Best for: Individuals and teams creating branded social, photo, and video content quickly, with infographics as part of the mix.
Key strengths
- Free and Premium plans: A capable free tier plus a low monthly Premium step-up.
- Templates, stock assets, and fonts: A broad starting library that reduces sourcing time.
- Generative AI and editing tools: Background removal, image generation, and quick edits in-editor.
Why choose Adobe Express: If your team already uses Adobe products or you want a trusted creative tool with low setup friction, Adobe Express is the natural pick. It keeps brand consistency tight for teams that need photo, video, and infographic work living under one roof.
Adobe Express pricing: The Free plan is US$0.00. Adobe Express Premium is US$9.99/month with no annual commitment required. Adobe Firefly Pro, which adds more generative capacity, runs US$19.99/month. Adobe Express holds a 4.5/5 rating on G2.
4. Infogram
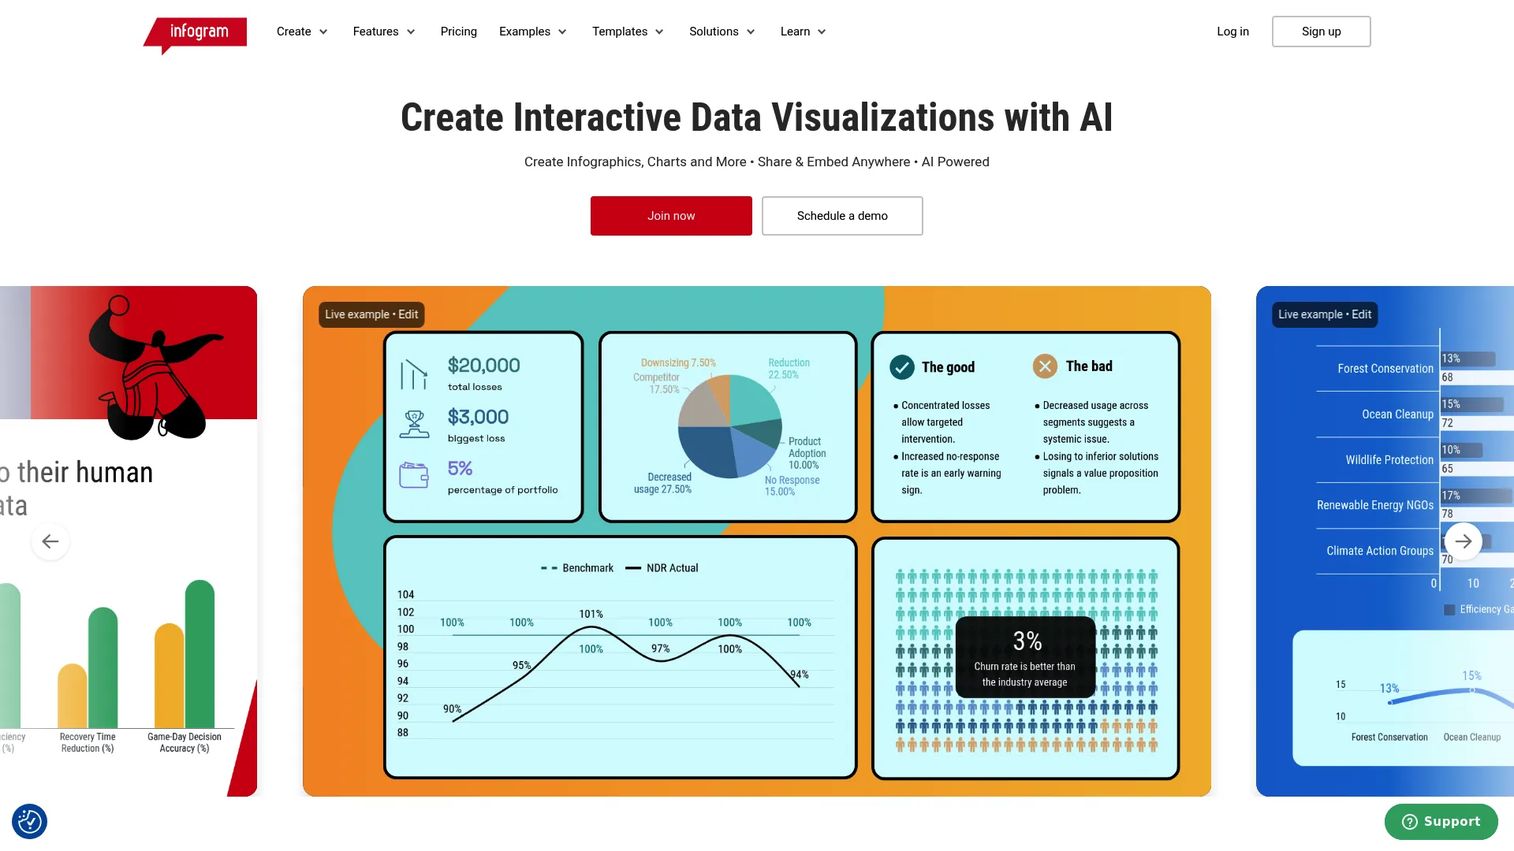
Infogram is data visualization software built for creating interactive infographics, charts, maps, and reports. This is the tool for marketers whose content leads with numbers. Where other tools treat charts as one element among many, Infogram treats data as the point, with a specialized library of chart and map types and the ability to publish visuals that readers can hover, filter, and interact with.
That interactivity is the differentiator. An embedded, animated chart on a blog post or landing page keeps readers engaged with the data instead of skimming past a flat image. For content teams running data-driven campaigns, that is the difference between a stat people scroll past and one they explore.
Best for: Teams that need quick, branded interactive data visuals and reports.
Key strengths
- Interactive and animated visuals: Charts readers can explore, not just view.
- Share and embed anywhere: Drop live visuals into web pages, posts, and reports.
- Specialized charts and maps library: Depth of chart types most general tools do not match.
Why choose Infogram: Choose Infogram when interactivity and data fidelity matter more than pure decorative polish. It is the strongest fit for data-led marketers, research reports, and any content asset where the numbers are the story and you want readers to engage with them directly.
Infogram pricing: The Basic plan is free. Pro is $19/month billed yearly, Business is $67/month billed yearly, and Team is $149/month billed yearly. An Enterprise tier is available on request. Infogram holds a 4.7/5 rating on G2.
5. Venngage
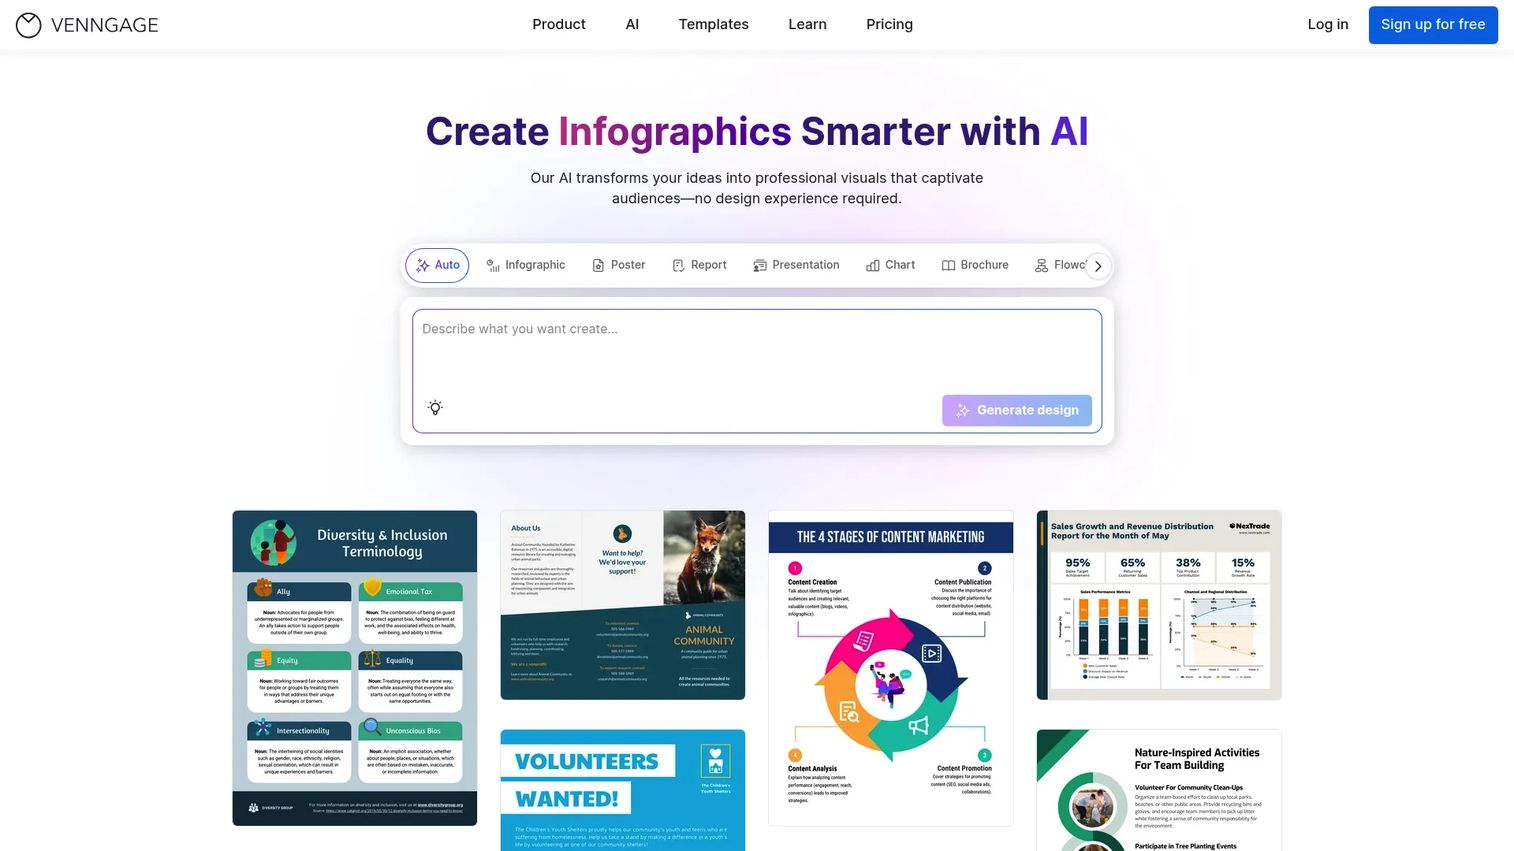
Venngage is an AI-powered visual communication platform focused on infographics, reports, and business visuals. It is built for the non-designer who needs client-ready output: one-pagers, process diagrams, statistical infographics, and reports that look professional without a design background. The template selection leans heavily toward business and marketing collateral, which is where most marketing teams actually spend their time.
The AI generation and drag-and-drop editor lower the barrier to a finished asset, and the brand kit support keeps everything aligned to your palette and fonts. For agencies or in-house teams producing client-facing visuals, that combination of speed and polish is the selling point.
Best for: Teams and individuals creating infographics and business visuals quickly.
Key strengths
- Infographic maker with AI generation: Fast drafts from a prompt or a template.
- Drag-and-drop editor: Approachable for anyone with no design experience.
- Templates, charts, and brand kits: Business-focused layouts kept on-brand.
Why choose Venngage: Choose Venngage when your output is business-heavy: reports, one-pagers, and client-ready marketing collateral. It is a practical pick for non-designers who need polished, defensible visuals without learning a design suite or briefing a designer for every request.
Venngage pricing: The Free plan is $0. Premium is $10 per month, and Business is $24 per month per user. An Enterprise plan is available on request. Venngage holds a 4.7/5 rating on G2.
6. Visme
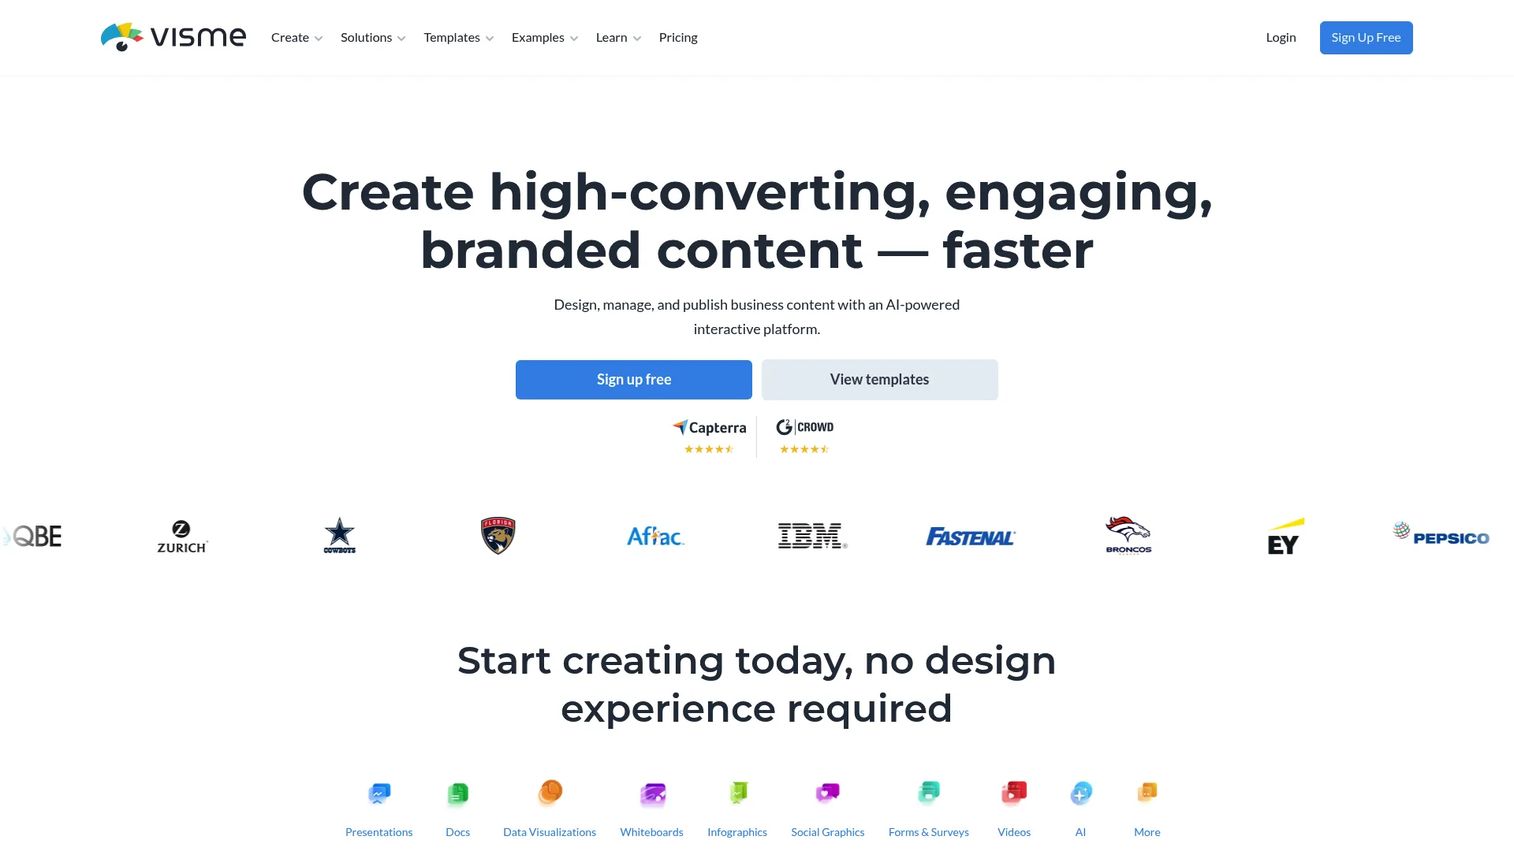
Visme is an AI-powered visual content platform that stretches well beyond infographics into presentations, documents, and full branded content systems. If your team is tired of switching between a deck tool, a doc tool, and an infographic tool, Visme's pitch is consolidation: one workspace for infographics, presentations, reports, and data visualization, all governed by shared brand controls.
The AI Designer and data visualization features handle the heavy lifting on layout and charts, while the brand design tools keep a team's output uniform. For a marketing function that produces a wide range of assets and wants fewer subscriptions, that breadth is the reason to look here.
Best for: Teams needing an all-in-one branded content creation platform.
Key strengths
- AI Designer: Generated layouts that shorten time from brief to draft.
- Data visualization: Chart and graph tools for data-backed assets.
- Brand design tools: Central brand controls across every content type.
Why choose Visme: Choose Visme when infographics are one part of a broader content load that includes decks and documents. Teams that want to consolidate several creative tools into one platform, with consistent branding across all of them, get the most value from its range.
Visme pricing: The Basic plan is $0/month per person. The Starter plan is US$12.25/month per person billed annually ($147/year), and Pro is US$24.75/month per person billed annually ($297/year). An Enterprise plan offers custom pricing for teams of 10 or more users. Visme holds a 4.5/5 rating on G2.
7. Snappa
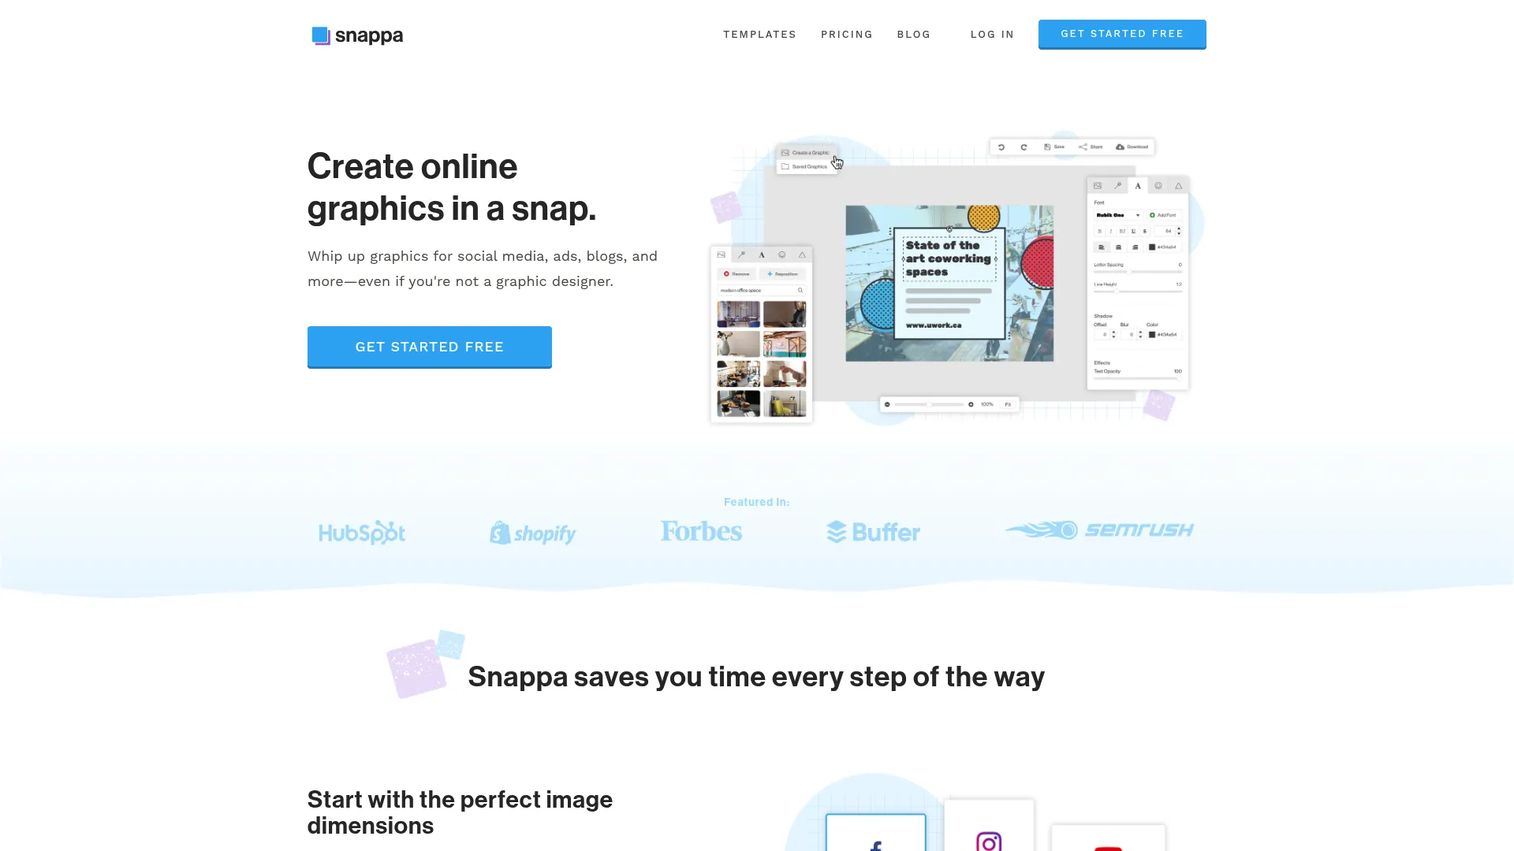
Snappa is an online graphic design tool built for quickly creating social media and marketing visuals. It is the lightweight option on this list, and that is the point. When you need a social post, an ad graphic, or a simple infographic out the door fast, Snappa's stripped-down editor and large template set get you there without the depth or the learning curve of a full design suite.
With thousands of templates, millions of stock photos and graphics, and integrations like Buffer for social sharing, it is tuned for marketers who care more about campaign velocity than advanced data storytelling. It is best for simpler use cases: the fast, repeatable social and ad creative that fills a content calendar.
Best for: Marketers and small teams creating quick social and ad graphics.
Key strengths
- 6,000+ templates: A deep starting set for social and ad formats.
- 5,000,000+ HD photos and graphics: Built-in stock so you skip external sourcing.
- Font uploads and social integrations: Custom fonts, background removal, and Buffer sharing.
Why choose Snappa: Choose Snappa when speed and simplicity beat depth. It is a clear fit for teams that live in the social and ad-creative lane and want to skip the heavier data-storytelling features they would rarely use. For lightweight, high-volume visual output, it does exactly what it promises.
Snappa pricing: Every account starts on the free Starter plan. Pro is $15/month billed monthly or $10/month billed yearly, and adds unlimited downloads. Team is $30/month billed monthly or $20/month billed yearly for collaborative work. Snappa holds a 4.6/5 rating on G2.
What to look for before choosing infographic software
Before you add another subscription, run the shortlist through the criteria that actually predict whether a tool sticks in a marketing workflow.
Template library depth
A thin template library means more time spent designing from scratch, which defeats the purpose. Check that the tool has layouts for the specific assets you produce most, whether that is statistical infographics, reports, or social graphics.
Data visualization strength
If your content leads with numbers, the charting engine matters more than the sticker library. Look for the chart and map types you actually use, spreadsheet import, and, if it fits your distribution, interactive or embeddable output. Our guide to data visualization tools goes deeper if this is your primary need.
AI assistance
An AI infographic maker that drafts layouts and copy saves the most time at the blank-canvas stage. Test whether the generated output is close enough to usable that you are editing rather than rebuilding.
Brand controls and collaboration
For any team, a brand kit and shared templates are non-negotiable. They are what keep ten people's output looking like one brand. Check for saved colors, fonts, logos, and role-based collaboration before you commit.
Export, sharing, and pricing fit
Confirm the export formats you need, PNG, PDF, or interactive embed, are available on the plan you can afford. Then weigh whether the tool replaces something you already pay for, because consolidation is often the strongest reason to switch.
Conclusion
There is no single best infographic software, only the best fit for how your team works. If you want one flexible tool with the shallowest learning curve, Canva is the default. For structured reports and repeatable team workflows, Piktochart earns its place. Teams inside the Adobe ecosystem get the cleanest fit from Adobe Express, while data-led marketers who want interactive visuals should start with Infogram. Venngage handles business one-pagers and client collateral, Visme consolidates infographics with decks and docs, and Snappa keeps fast social and ad graphics moving.
The practical next step is to shortlist two tools that match your dominant use case, then run a real asset through each free tier before you pay. Match the tool to the work you do most, protect your brand controls, and pick the one that removes a design bottleneck without adding stack sprawl. As visual content and generative workflows keep converging, pairing the right infographic maker with a broader set of AI content creation tools is how lean teams keep shipping.
FAQs
There is no universal winner. Canva is the strongest all-around pick for speed and template depth, Infogram is best when your content leads with data, and Piktochart or Venngage fit teams producing branded reports and business collateral. Match the tool to your dominant use case rather than chasing the longest feature list.
Template-first tools with a drag-and-drop editor are the easiest entry point. Canva, Snappa, and Venngage all let a non-designer produce a polished asset on the first day because you start from a finished layout and swap in your own content rather than building from scratch.
Infogram is the strongest choice for charts, graphs, maps, and embeddable interactive visuals, since data is its core focus. Visme and Piktochart also offer solid charting for teams that want data visualization alongside broader content creation. For a deeper comparison, see our roundup of data visualization tools.
Yes. Modern infographic software is built for people with no design experience. Template libraries give you a professional starting layout, drag-and-drop editors let you edit without code, and AI assistance generates layouts and copy so you are refining rather than designing from a blank canvas.
Look for collaboration, brand kits, shared templates, and approval-friendly workflows. Piktochart, Visme, and Venngage all offer team plans with brand controls that keep multiple people's output consistent, which is what matters most when several marketers produce content off one brand system.
For one-off assets and low-volume needs, free tiers from Canva, Infogram, Snappa, and others are genuinely usable. You typically move to a paid plan when you need a full brand kit, team collaboration, premium templates, or higher-resolution and format-flexible exports for regular campaign work.
Evaluate template library depth, data visualization strength, AI assistance, export formats, and collaboration and brand controls, then weigh pricing against what the tool replaces. The best choice removes a design bottleneck and consolidates your stack rather than adding another standalone subscription and login.