Your customers asked for reporting inside the product six months ago. Engineering scoped it at three sprints minimum. The current workaround is a CSV export that nobody trusts anymore.
This is the shape of most embedded BI decisions. The request sounds simple: Put some charts in the product. The reality involves tenant isolation, semantic layers, release cadence, and a maintenance burden that compounds with every schema change.
The market reflects how seriously teams take this. According to Dresner Advisory Services (2024), 57% of organizations now use embedded BI, up from 49% in 2023, and 73% of users rate it as critical or very important to their work. The embedded analytics market itself reached $22.93 billion in 2025, per Fortune Business Insights.
Choosing the wrong platform means paying that opportunity cost twice: Once to ship, once to rebuild. This guide helps you avoid that.
What's inside
This guide covers nine embedded BI tools for SaaS products and customer-facing portals, evaluated for product managers who own the outcome, not just the ticket.
- What's covered: Nine platforms, with pricing and G2 ratings verified before publication
- How tools were selected: Fit for multi-tenant SaaS products, white-label control, API depth, and maintenance sustainability
- Who this is for: PMs and product leaders shortlisting platforms before a proof of concept or architecture review
- What you'll learn: How each tool differs on self-service depth, tenant modeling, engineering overhead, and the product-margin implications of each pricing model
TL;DR
- Best for enterprise embedded analytics: Sisense, for API-first composability and complex multi-tenant deployments
- Best for search and AI-led analytics: ThoughtSpot, for products where customers ask open-ended data questions
- Best embedded-first SaaS option: Luzmo, for B2B teams that want customer-facing dashboards with white-label control out of the box
- Best open-source route: Metabase, with a free tier and transparent pricing up to enterprise
- Best for pixel-perfect reporting: Bold Reports, when customers need formatted, auditable documents alongside dashboards
- Category split: Choose dashboard-first platforms when customers need exploratory analytics. Choose reporting-first platforms when they need scheduled, formatted, or regulated outputs.
What is embedded business intelligence?
Embedded business intelligence is the practice of placing dashboards, reports, data exploration, and analytics workflows inside another software product, portal, or operational application.
Users do not leave the product to find answers. Instead, data surfaces in the context where a decision happens: Inside a SaaS app, a customer portal, an internal operations tool, or a premium analytics tier.
How embedded BI differs from standalone BI
Standalone BI sends users to a separate analytics destination. Embedded BI keeps analytics inside the product where the user already works.
| Dimension | Embedded BI | Standalone BI |
|---|---|---|
| User experience | Analytics inside the product workflow | Separate analytics workspace |
| Authentication | Can inherit application identity and permissions | Often requires a separate login or role model |
| Product control | Can be branded and contextualized | Usually follows the BI tool's interface |
| Primary value | In-product decisions and customer experience | Organization-wide analysis |
| PM ownership | Product roadmap and adoption metrics | Data and analytics team workflow |
Core embedded BI capabilities
- Embedded dashboards and visualizations inside your application
- Parameterized reports by user, account, or product context
- Row-level security and tenant isolation
- APIs and SDKs for frontend integration
- White-labeling and theming controls
- Self-service report creation for end users
- Natural-language query or AI-assisted exploration
- Scheduled delivery, exports, and alerts
- Usage analytics for dashboards and reports
Where product teams use embedded BI
Product teams deploy embedded analytics across four primary contexts: Customer-facing SaaS dashboards, multi-tenant customer portals, internal operations tools, and premium reporting tiers sold as a paid product capability.
Build versus buy: The first product decision
Buy when analytics supports the product's core workflow but is not the differentiated experience itself.
Build when proprietary analytics interaction, custom data modeling, or specialized visualization is central to your product's market advantage.
Most teams buy the analytics layer, then build product-specific workflows around it. The PM test: Can a customer answer a job-critical question without leaving your product?
When to use embedded business intelligence
Move customer data into the workflow where decisions happen
Many SaaS users currently export data into spreadsheets or ask support for reports. Embedding analytics inside the product removes that friction and creates a measurable lift in time to first value, feature adoption, and ticket deflection.
This is the most common starting point. One high-value workflow, one governed metric set, validated by a narrow proof of concept before you scale.
Offer role-specific reporting without duplicating dashboards
Embedded BI supports permission-aware analytics segmented by user role, plan tier, or tenant. An administrator sees account-wide metrics. A frontline user sees only their own data. An executive sees aggregated summaries.
Strong governance matters here. One dashboard that tries to serve every persona usually serves none well. Define the decision each view supports before building.
Turn reporting into a monetizable product capability
Premium analytics tiers, exportable reports, and usage-based data access can each become revenue lines. Monetization only works when customers trust the data and can act on it without support intervention. That trust is an instrumentation and governance problem before it is a features problem.
Embedded business intelligence tools comparison
No platform wins on every dimension. The right choice depends on your product architecture, the complexity of your tenant model, your team's engineering capacity, and the analytics maturity of your customers.
| # | Product | Best for | Key differentiator | Pricing | G2 rating |
|---|---|---|---|---|---|
| 1 | Sisense | Complex enterprise embedded analytics | API-first composable analytics | Custom pricing | 4.2/5 |
| 2 | ThoughtSpot | Search and AI-led analytics | Natural-language search and AI Liveboards | From $25/user/month | 4.4/5 |
| 3 | Luzmo | SaaS customer-facing dashboards | Embedded-first, white-label design | From €995/month | 4.6/5 |
| 4 | Reveal | Developer-led embedded analytics | SDK-based integration across major frameworks | Custom pricing | 4.6/5 |
| 5 | Metabase | Open-source and SQL-friendly teams | Open-source with paid embedding tiers | Free; paid from $100/month | 4.4/5 |
| 6 | Tableau | Broad enterprise BI and visualization | Mature data connectivity and visual analytics | From $15/user/month | N/A (see entry) |
| 7 | Microsoft Power BI | Microsoft-stack organizations | Microsoft Fabric and Azure alignment | Free; Pro from $14/user/month | 4.5/5 |
| 8 | GoodData | Headless and composable analytics | Semantic layer and API-oriented architecture | Custom pricing | 4.2/5 |
| 9 | Bold Reports | Pixel-perfect embedded reporting | Report designer with scheduled delivery | Community license free; paid custom | 4.1/5 |
Pricing and G2 ratings verified October 2026 from each vendor's official pricing page and G2 listing.
Best embedded business intelligence tools for 2026
1. Sisense
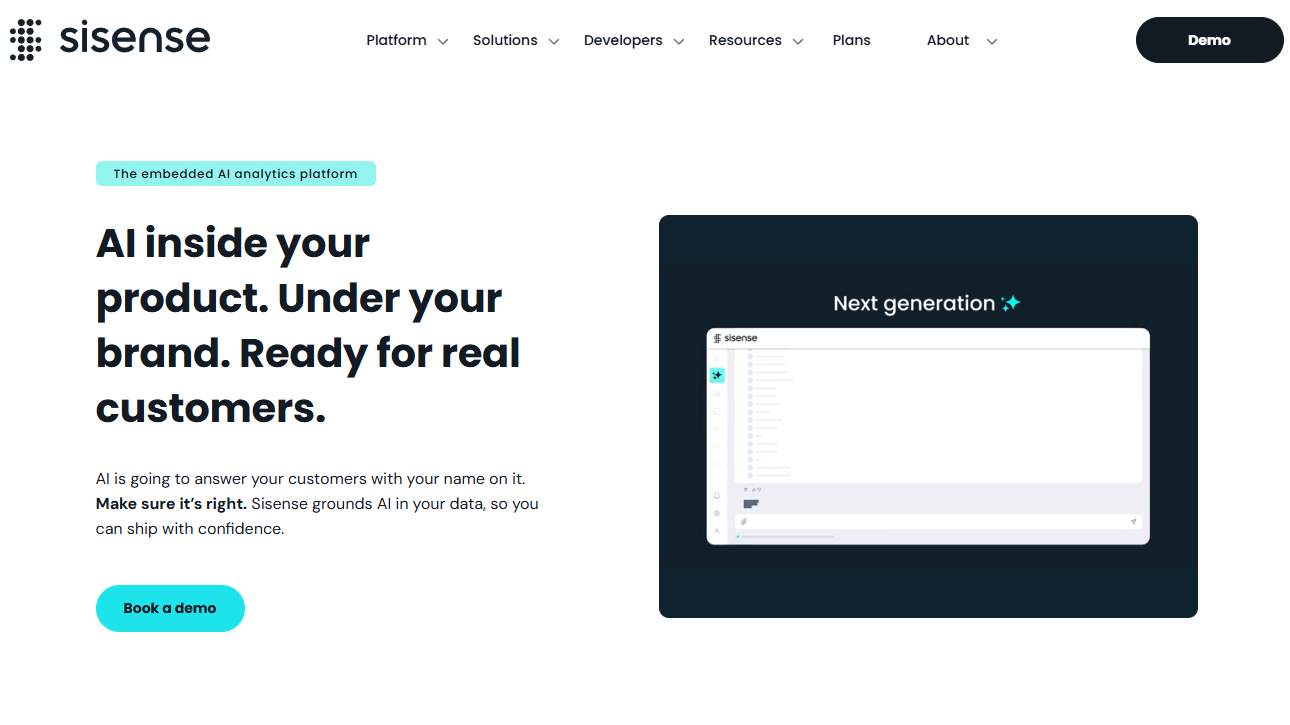
Sisense is an AI-powered analytics platform built for software companies and enterprises that need governed, customizable embedded analytics in their applications. It supports embedding via iFrames, an Embed SDK, and a Compose SDK, giving engineering teams multiple integration paths. The platform connects to more than 400 data sources and covers data modeling, blending, and AI-assisted conversational analytics in a single environment.
Best for: Product organizations embedding sophisticated analytics across multiple customer-facing applications or complex tenant architectures.
Key features
- API-first embedded analytics via Embed SDK and Compose SDK
- AI-powered conversational analytics with MCP connectivity
- Data modeling and blending across 400+ connectors
- White-label controls and customizable dashboard components
- Security certifications including SOC 2 Type II, ISO 27001, and ISO 27701
Why choose Sisense: Sisense is the right call when your product has complex multi-tenant requirements, when engineering needs fine-grained control over how analytics surfaces in the UI, or when governance and data model depth matter as much as dashboard rendering speed.
Sisense pricing: Sisense offers a Self-serve plan (with a 7-day full-featured trial) for growing teams, and an Enterprise plan at custom pricing. Contact Sisense directly for enterprise contract terms.
G2 rating: 4.2/5 on G2.
2. ThoughtSpot
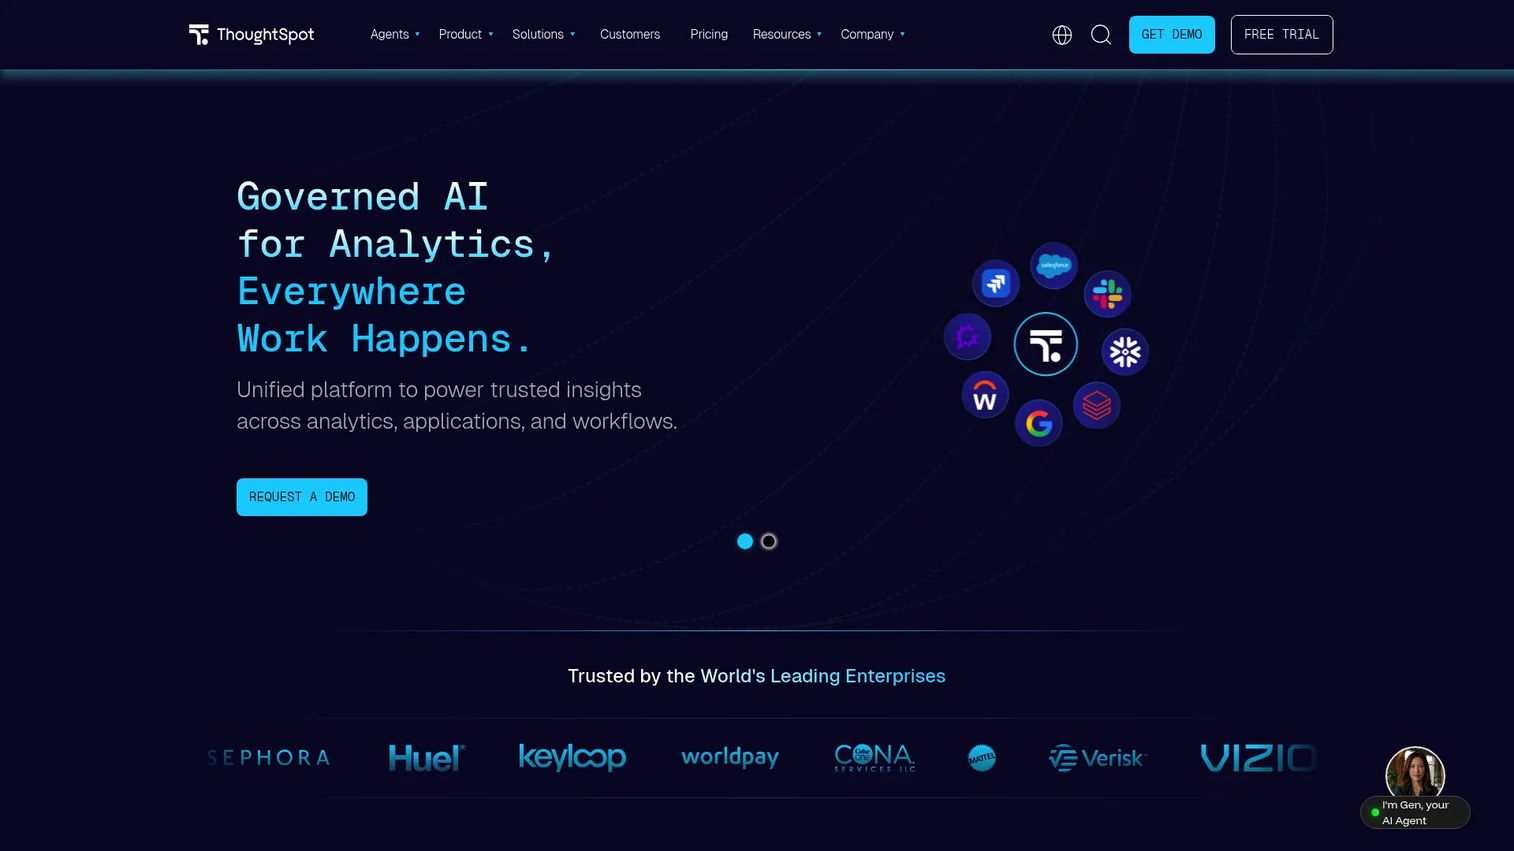
ThoughtSpot is an AI-powered analytics platform built around natural-language search and governed self-service exploration. Users type questions about their data and receive answers through interactive Liveboards, AI-assisted summaries, and cloud data warehouse integrations. It offers embedding via APIs and SDKs, with a Developer tier available at no cost for individuals and small teams.
Best for: Products where customers need to ask their own data questions rather than only consume curated dashboards.
Key features
- Natural-language search across connected data
- AI-powered dashboards and automated insight summaries
- Interactive Liveboards with drill-down capabilities
- Embedded analytics API and SDK
- Governed data modeling and row-level security controls
Why choose ThoughtSpot: Choose ThoughtSpot when your users' questions vary widely and a fixed dashboard library would generate a permanent backlog. The tradeoff: Your underlying metric definitions must be strong before self-service search goes live, because a weak semantic layer amplifies inconsistent answers as fast as it amplifies access.
ThoughtSpot pricing: The Developer tier is free for up to one year. Essentials starts at $25 per user per month (billed annually). Pro costs $50 per user per month (billed annually). Enterprise pricing is custom.
G2 rating: 4.4/5 on G2.
3. Luzmo
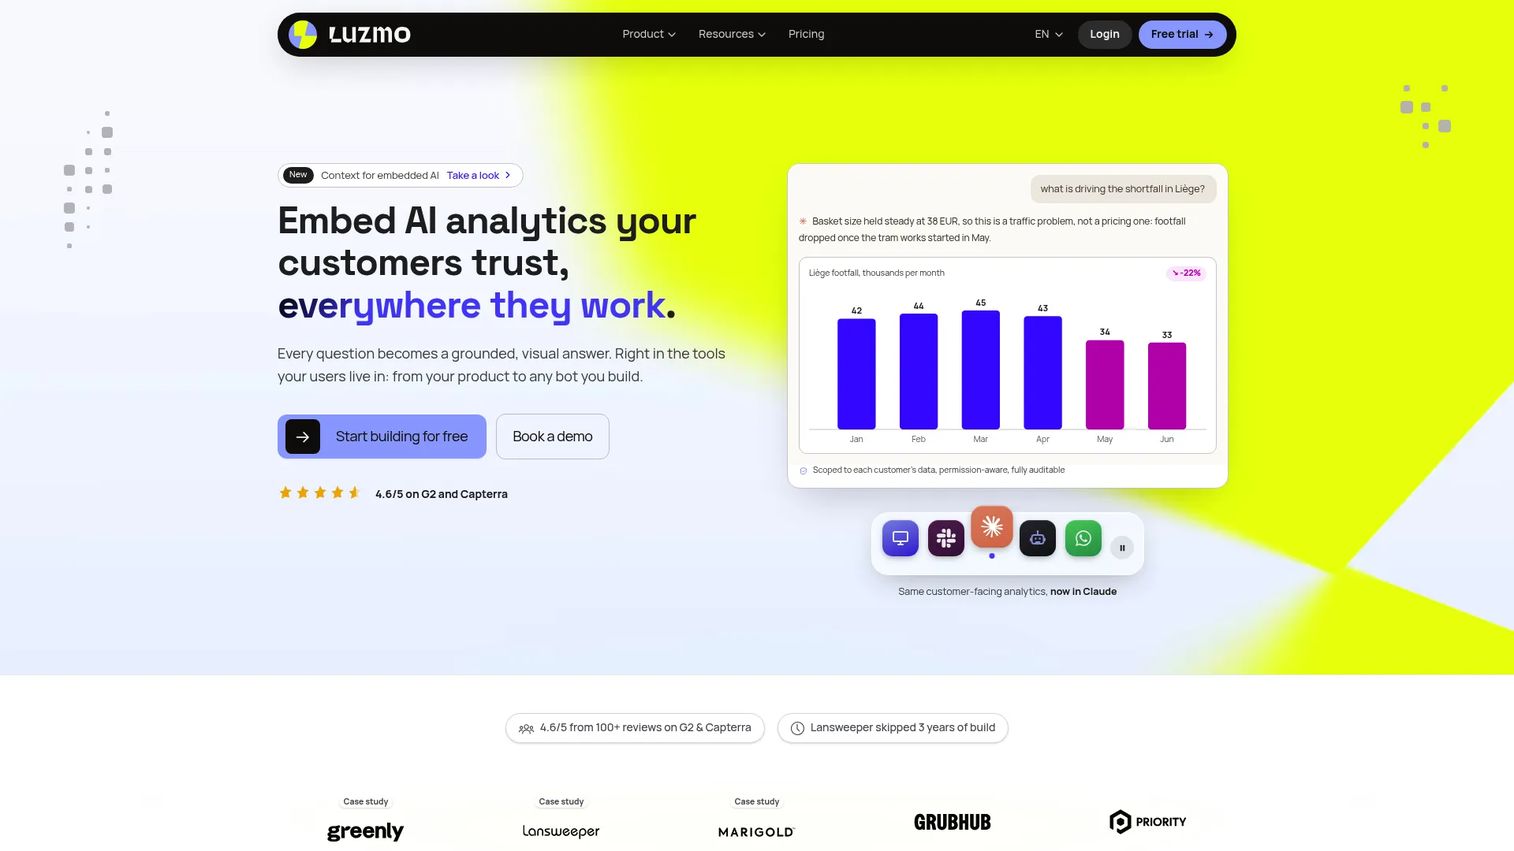
Luzmo is an embedded analytics platform built specifically for SaaS companies that need customer-facing dashboards with white-label control, multi-tenant security, and natural-language AI exploration. It is designed to minimize engineering setup time while giving product teams visual customization and governed data access without a heavy configuration layer.
Best for: B2B SaaS product teams that want to ship branded, multi-tenant analytics without building every dashboard component from scratch.
Key features
- Fully white-label, responsive embedded dashboard UI
- Secure multi-tenant data access controls
- Self-service dashboard creation and editing for end users
- Natural-language AI analytics with visual query answers
- Agentic APIs, MCP server, and developer integrations
Why choose Luzmo: Luzmo is the shortest path to customer-facing embedded dashboards when your team wants brand control without extensive SDK integration work. Evaluate whether non-technical team members can maintain governed dashboard templates across tenants before committing.
Luzmo pricing: Basic starts at €995 per month. Pro is €2,050 per month. Elite is €3,100 per month. A 10-day free trial is available. Pricing is in euros, so factor in currency conversion for budget models.
G2 rating: 4.6/5 on G2.
4. Reveal
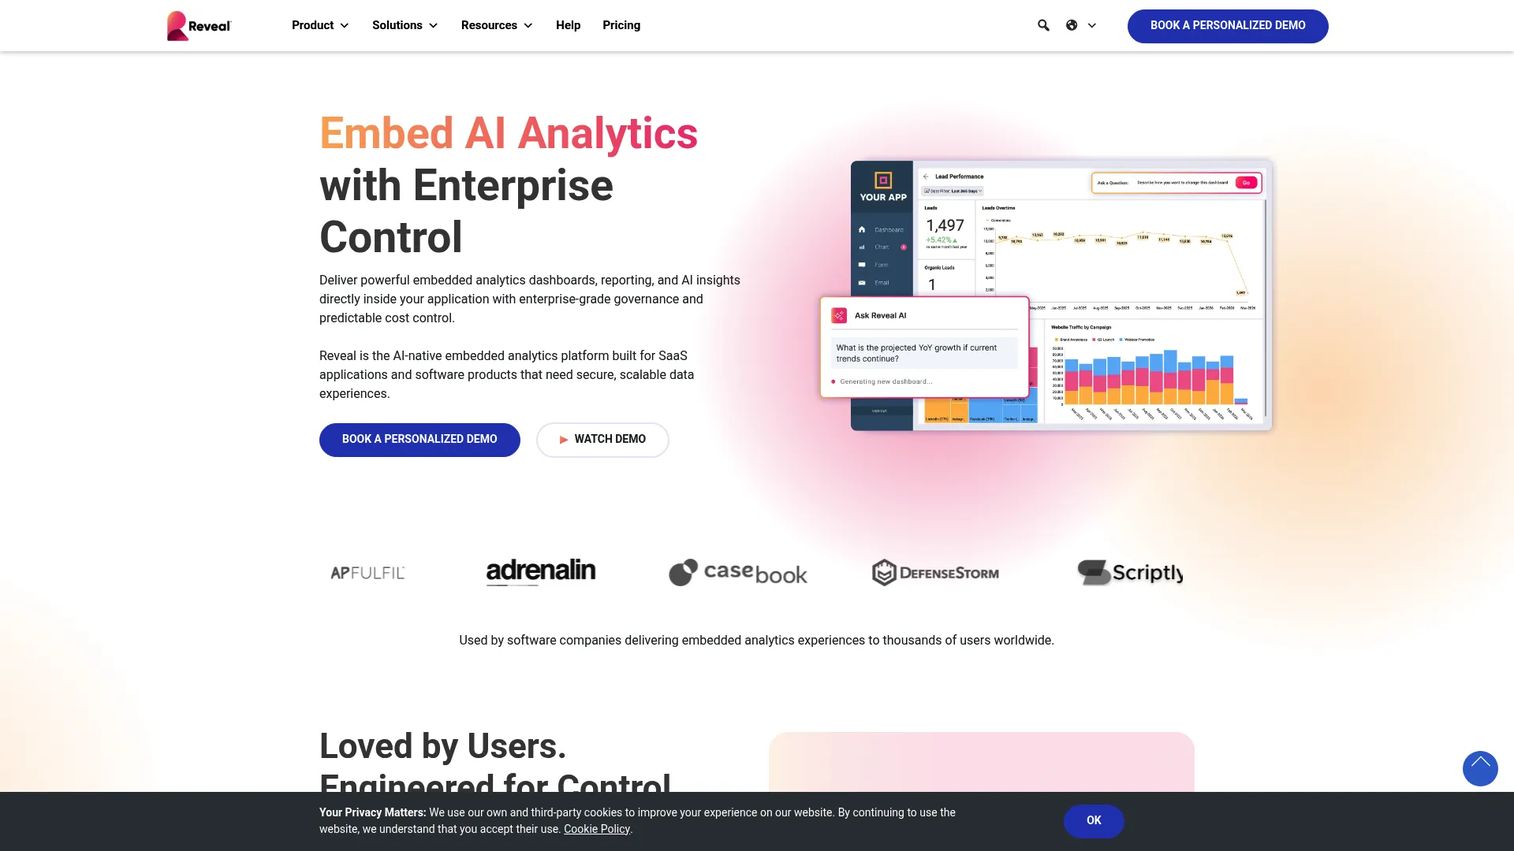
Reveal is an embedded business intelligence platform for adding dashboards, reporting, self-service analytics, and AI-assisted insights directly into software applications. It provides SDK support for React, Angular, Vue, Web Components, Blazor, Windows Forms, and WPF, giving frontend engineering teams broad framework flexibility. More than 25 data sources and live-data connectivity are supported out of the box.
Best for: Product teams with frontend engineering capacity that want analytics to feel native to the application rather than bolted on.
Key features
- SDK support across React, Angular, Vue, Blazor, and WPF
- White-label interface and theming controls
- Embedded dashboards and self-service editing for users
- AI-powered KPI summaries, anomaly detection, and recommendations
- Cloud, private-cloud, and on-premises deployment options
Why choose Reveal: Reveal works best when the engineering team can own the integration layer and sustain it across frontend framework upgrades. The SDK depth is its primary advantage. The key question before committing: Can your team maintain the integration through your next major frontend change?
Reveal pricing: Reveal operates on a flat yearly fee with unlimited users and dashboards per application, priced by custom quote. A 30-day SDK trial is available. Contact Reveal for a personalized quote.
G2 rating: 4.6/5 on G2.
5. Metabase
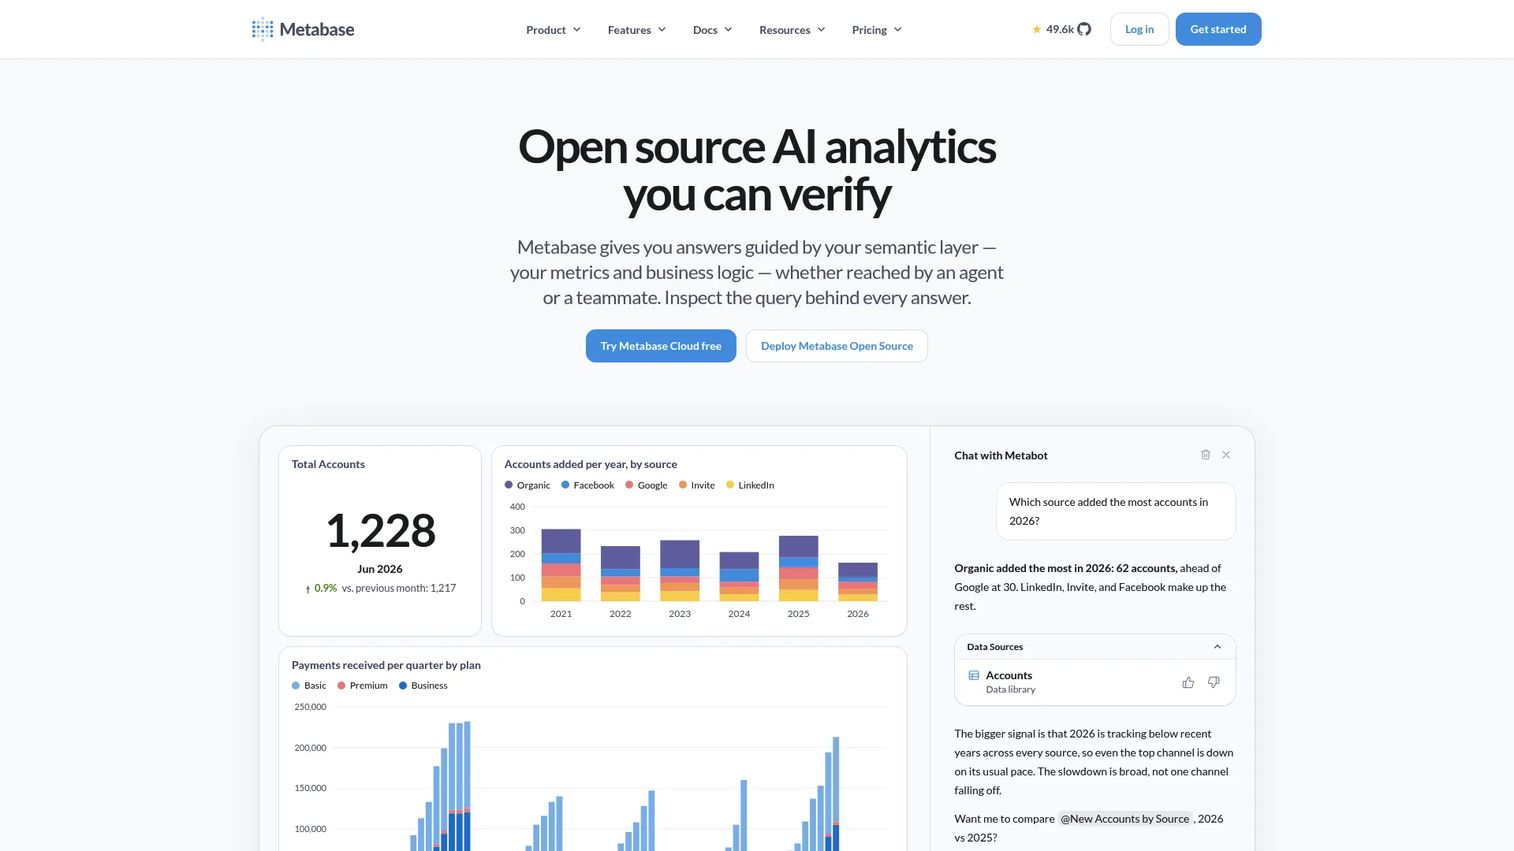
Metabase is an open-source business intelligence and embedded analytics platform for querying, visualizing, sharing, and embedding data. It ships with a visual query builder, a native SQL editor, and AI-assisted natural-language exploration. The open-source edition is free with unlimited users, making it a practical entry point for data-aware teams evaluating embedded BI without a procurement cycle.
Best for: Teams that value open-source deployment control, SQL access, and internal analytics, with embedded options for governed customer-facing use cases.
Key features
- Open-source edition with unlimited users at no cost
- Visual query builder and native SQL editor
- AI-assisted natural-language data exploration
- Embedded analytics with customizable multi-tenant components
- Row- and column-level security, SSO, and usage analytics (Pro and Enterprise)
Why choose Metabase: Metabase is the strongest open-source embedded BI option when your team has data engineering resources to own deployment and permissions. Validate white-label depth, tenant management behavior, and secure embedding session handling early in your proof of concept.
Metabase pricing: The open-source edition is free. The Starter plan costs $100 per month (or $1,080 per year). Pro is $575 per month (or $6,210 per year). Enterprise starts at $20,000 per year.
G2 rating: 4.4/5 on G2.
6. Tableau
Tableau is a visual analytics platform for connecting to data, exploring it, and sharing insights through interactive visualizations. It supports embedded analytics via APIs and role-based permissions, and connects to a broad range of databases, flat files, and data warehouses. Tableau is often compelling for organizations already standardized on Tableau for internal analytics that want to extend that investment into customer-facing experiences.
Best for: Organizations that already run enterprise-wide analytics on Tableau and need to surface that investment in product-facing contexts.
Key features
- Advanced visual analytics and interactive visualizations
- Extensive data connectors across databases and warehouses
- Embedded analytics API with role-based permissions
- Enterprise governance and audit controls
- Tableau Desktop Free Edition for local data analysis
Why choose Tableau: Tableau fits when the embedded use case is an extension of an existing Tableau investment, not a greenfield product decision. Before committing, confirm that the external-viewer licensing model maps cleanly to your customer volume. Viewer seat costs can turn a product analytics feature into a margin problem at scale.
Tableau pricing: Tableau Standard starts at $15 per user per month (billed annually). Tableau Enterprise is $35 per user per month (billed annually). Tableau Next is $40 per user per month (billed annually). The Tableau+ Bundle requires a sales conversation. A Tableau Desktop Free Edition is available for local analysis.
G2 rating: Capterra reviewers rate Tableau at 4.6/5. A current G2 rating could not be verified at publication; check the live G2 listing before you evaluate.
7. Microsoft Power BI
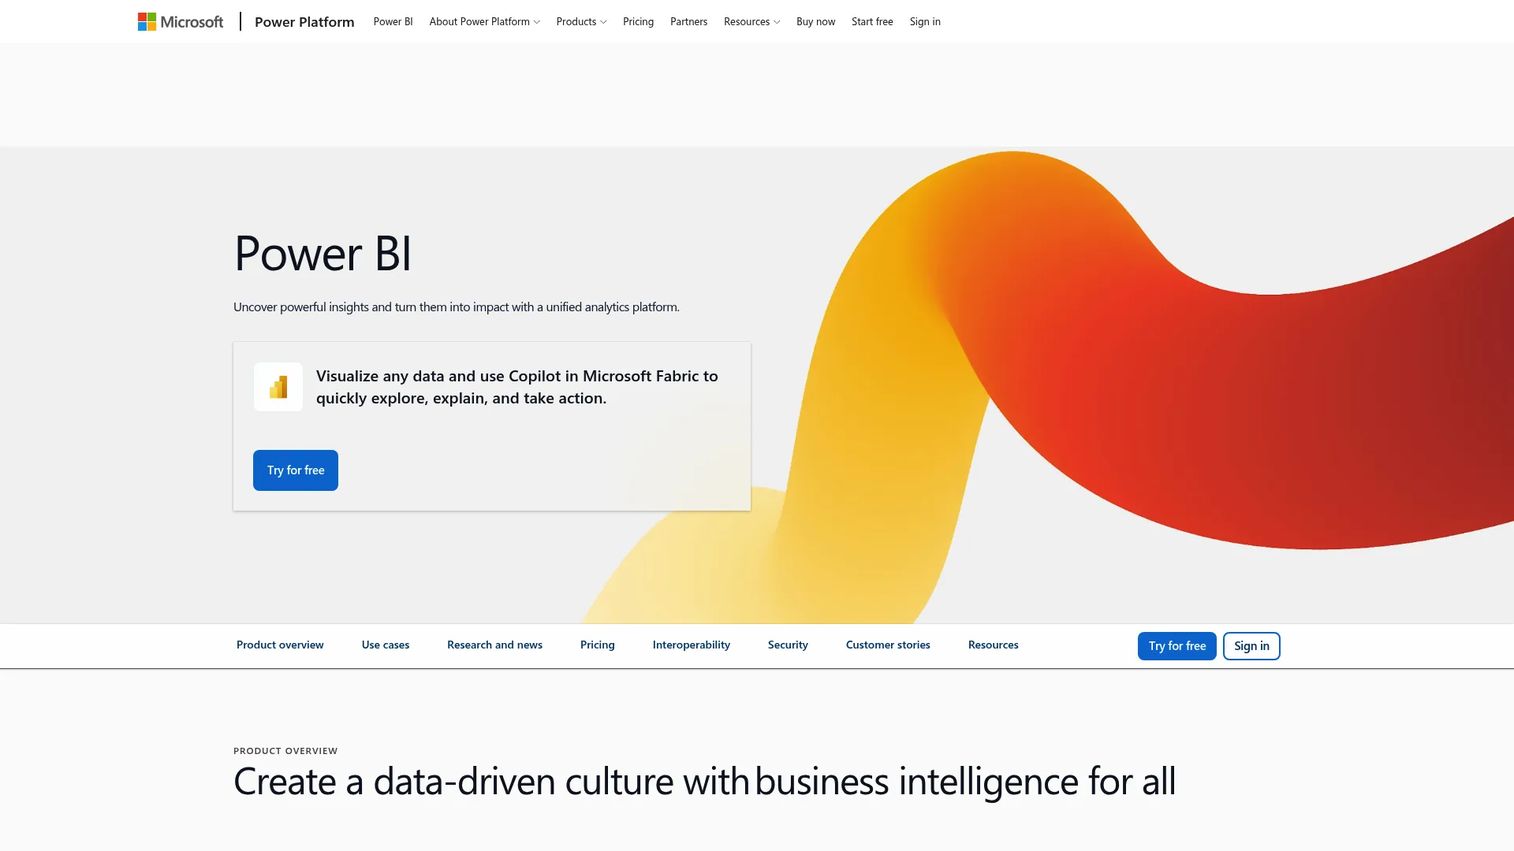
Microsoft Power BI is a business analytics platform for connecting, modeling, visualizing, and sharing data. It supports embedded analytics through Power BI Embedded capacity plans and aligns tightly with Microsoft Fabric, Azure, and Microsoft 365. For B2B software teams operating in a Microsoft-heavy data environment, it can reduce integration friction significantly.
Best for: B2B software teams and internal product groups whose identity, data, and governance already sit in the Microsoft stack.
Key features
- Power BI Embedded for application embedding
- Microsoft Fabric and Azure integration
- Connects to more than 100 data sources
- Semantic models with DAX for governed metric definitions
- Natural-language Q&A and Microsoft Copilot support
Why choose Microsoft Power BI: Stack alignment is the primary driver here. Power BI's embedded experience can feel disjointed for external users accustomed to a different product aesthetic. Ask whether the external user experience stays coherent when embedded analytics inherits enterprise BI conventions.
Microsoft Power BI pricing: A free account is available for creating reports locally. Power BI Pro costs $14 per user per month (billed annually). Power BI Premium Per User is $24 per user per month (billed annually). Power BI Embedded and Fabric capacity plans use variable pricing based on capacity size; contact Microsoft for embedded-specific quotes.
G2 rating: 4.5/5 on G2.
8. GoodData
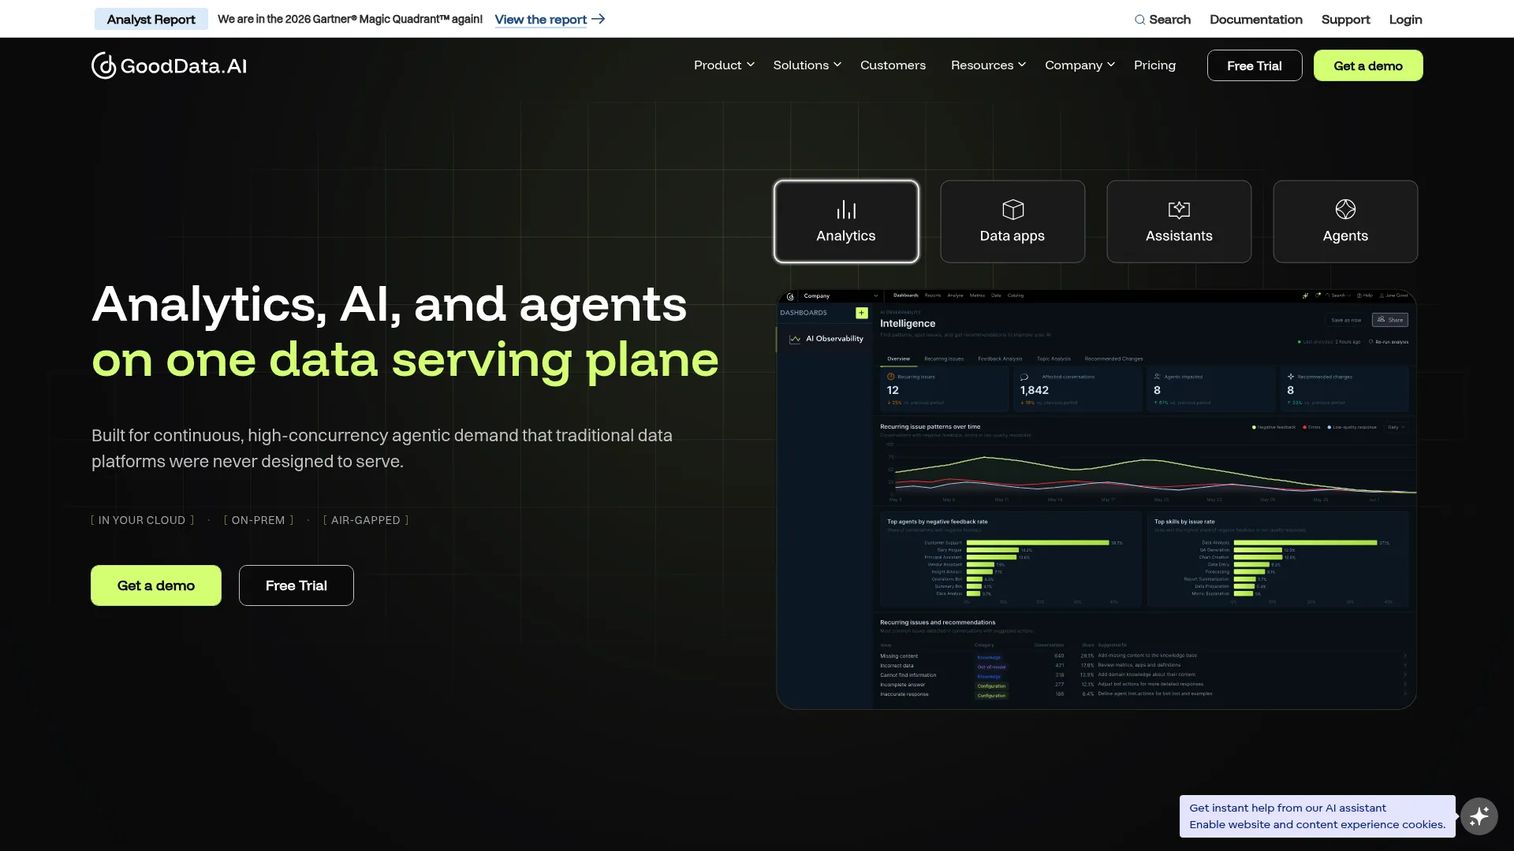
GoodData is an AI-native analytics platform built for analytics, data applications, assistants, and autonomous agents. It emphasizes a governed semantic and context layer, built-in multitenancy, declarative APIs, and analytics-as-code workflows. Both managed and self-hosted deployment options are supported, making it practical for product teams with specific data residency or infrastructure requirements.
Best for: Product teams building analytics into a differentiated application experience where metric consistency and composability matter as much as dashboard rendering.
Key features
- Built-in multi-tenancy and workspace-level isolation
- Semantic and context layer for governed metric definitions
- Headless analytics architecture with declarative APIs
- AI assistants and agents for embedded data experiences
- Self-hosted and managed deployment options
Why choose GoodData: GoodData is the strongest option when you need a centrally governed metric layer that feeds multiple dashboard experiences, customer segments, and internal reporting consumers. The headless architecture means more frontend engineering control but also more engineering ownership. Confirm that team capacity exists before treating composability as a selling point.
GoodData pricing: Professional pricing is contact-based and charged per workspace. Enterprise pricing is custom. A free trial link is available on the site; a permanent free tier could not be confirmed at publication.
G2 rating: 4.2/5 on G2.
9. Bold Reports
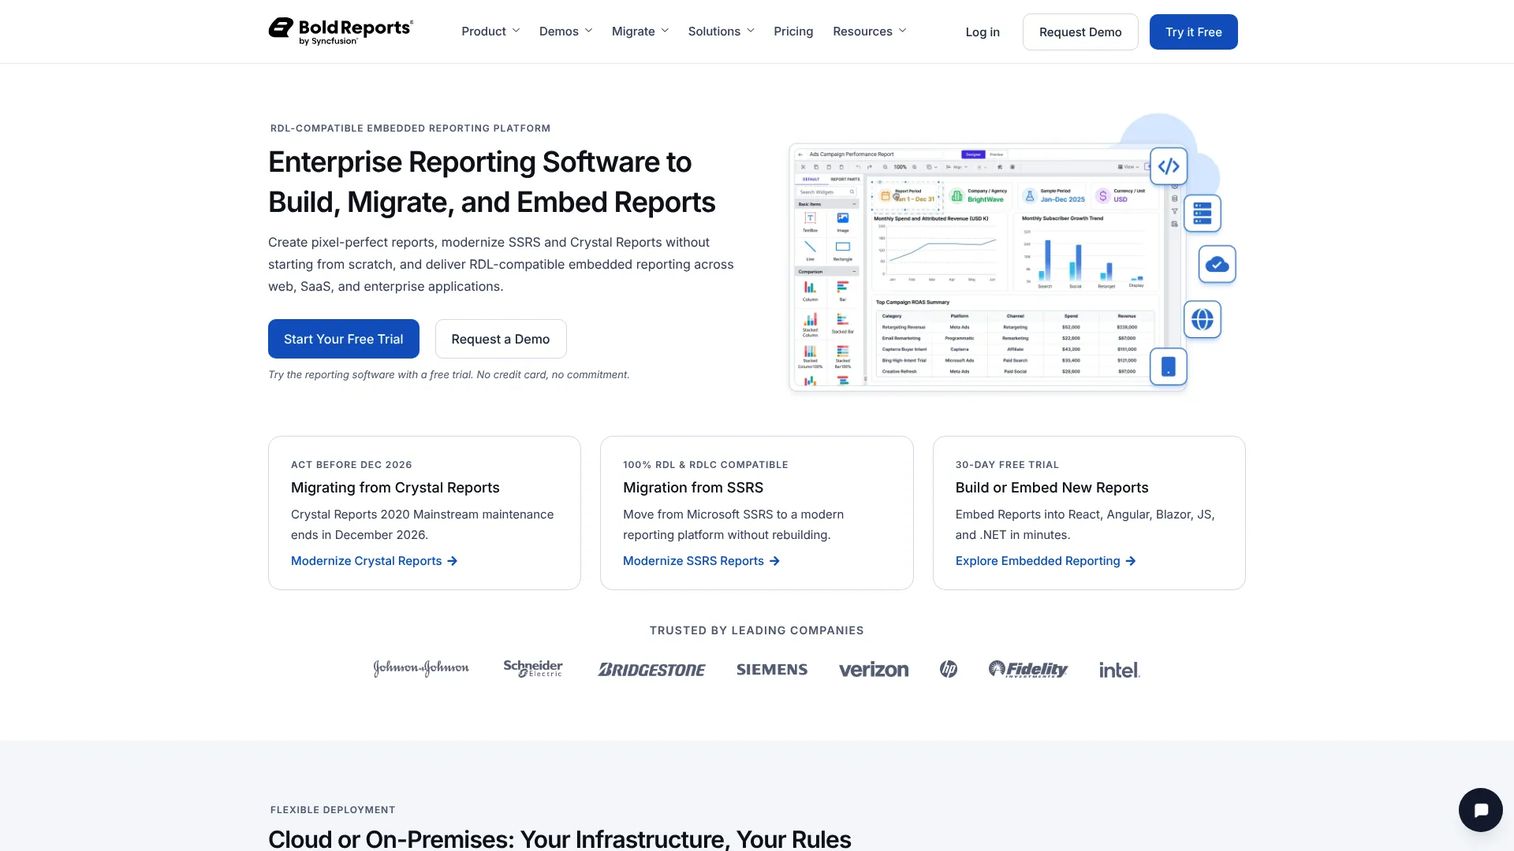
Bold Reports is an enterprise reporting platform for creating, embedding, managing, scheduling, and distributing pixel-perfect paginated reports. It supports a web drag-and-drop report designer, native RDL and RDLC formats, embedded reporting SDKs, 25+ data connectors, and exports to PDF, Excel, Word, PowerPoint, CSV, XML, and HTML. Multi-tenancy, white-labeling, and role-based access are included.
Best for: Products where customers need formatted, auditable documents alongside dashboards: Invoices, operational forms, regulatory reports, or scheduled statements.
Key features
- Web drag-and-drop report designer with pixel-perfect layouts
- Native RDL and RDLC support
- Embedded reporting SDKs and viewers
- Scheduling, sharing, and version history
- Export to PDF, Excel, Word, PowerPoint, CSV, XML, and HTML
Why choose Bold Reports: Bold Reports is the right choice when a customer's demand for "dashboards" turns out to mean a monthly report they print, send, or store for compliance. Forcing those requirements into an interactive dashboard creates a support burden that compounds every release cycle.
Bold Reports pricing: Cloud, Managed Private Cloud, and On-Premises editions are available at custom quotes. A Community License is free for eligible teams, with a stated annual value of $11,940, renewable annually. Contact Bold Reports for paid edition pricing.
G2 rating: 4.1/5 on G2.
Considerations when choosing embedded business intelligence software
Data and tenant architecture
Verify that the platform supports your data warehouse or operational database and confirm exactly how it isolates customer data. Row-level security, tenant-level filters, and workspace separation each carry different maintenance implications. The governing question: Can you prove that a customer only sees data they are authorized to see?
Product UX and white-label depth
Inspect beyond color theming. Evaluate how deeply you can control navigation, embedded menus, loading states, empty states, and mobile responsiveness. A dashboard that looks like a separate application damages trust and adoption even when the data is correct. Test the actual embedded experience before a proof of concept conclusion.
Self-service versus governance
Decide where users should explore freely and where they should consume curated outputs. Self-service features need governed metric definitions, permissions, and guardrails to be safe at scale. Without those controls, users generate competing versions of the same business metric, and support volume rises rather than falls. For a broader look at product analytics software that complements embedded BI, see that dedicated guide.
Engineering effort and maintenance
Run a realistic proof of concept that measures authentication setup, dashboard iteration, versioning behavior, and testing requirements. For PMs, this is the opportunity-cost section. A platform that ships quickly but becomes hard to update through release cycles can consume the same roadmap capacity you meant to protect. Explore how analytics platforms drive ROI before finalizing your maintenance model.
Pricing model and product margins
Model the cost against external viewer growth, customer tier expansion, and embedded session volume. Do not evaluate pricing through internal-seat assumptions. A pricing model that works at 100 customers may stop working at 1,000 if it charges by viewer or by query volume. Understand the pricing structure before your analytics feature becomes popular.
How to choose the right embedded BI tool for your team
If you need complex, enterprise-scale embedded analytics
Start with Sisense, ThoughtSpot, GoodData, and Tableau. Prioritize governance, data architecture depth, API control, and your team's capacity to support implementation. Choose the platform that fits the architecture you can sustain, not the dashboard that looks impressive in a vendor call. See the best business intelligence software guide for broader context on BI platform selection.
If you are building a customer-facing SaaS analytics experience
Evaluate Luzmo, Reveal, GoodData, and Sisense. Test tenant isolation, white-label control, account-level permissions, and the product experience for users who never log into a standalone BI tool. Use a narrow proof of concept: One customer type, one high-value workflow, one governed metric set before scaling.
If your team has strong data and engineering resources
Metabase is attractive when open-source control, SQL access, and deployment flexibility matter. GoodData and Reveal also fit teams that want composable or SDK-led experiences. Budget for operational ownership. Open-source and developer-led paths move implementation work; they do not remove it. For data visualization tools that complement embedded analytics, see that related guide.
If users need scheduled or print-ready reporting
Prioritize Bold Reports. Tableau and Power BI also support formal reporting use cases depending on your stack. Run customer research before you finalize here. A stated demand for dashboards sometimes resolves into a request for a monthly report delivered to an inbox.
Conclusion
Embedded BI is product infrastructure with direct consequences for activation, retention, support workload, and engineering capacity. The tool you choose shapes how much of that cost lands on your roadmap long after the initial launch sprint.
Here is the shortlist by situation:
- Sisense: Complex enterprise embedded analytics with multi-tenant governance
- ThoughtSpot: Search-driven and AI-assisted self-service for variable user questions
- Luzmo: Embedded-first SaaS analytics with the fastest path to white-label dashboards
- Metabase: Open-source flexibility with transparent tier pricing
- Tableau or Power BI: Extension of existing enterprise BI investments
- GoodData or Reveal: Composable or developer-led architectures with metric governance
- Bold Reports: Products with heavy reporting requirements alongside dashboards
Before you schedule nine vendor demos, map one customer decision to one dashboard or report. Use that single workflow to validate tenant isolation, permissions, performance, and maintenance overhead. The platform that handles that workflow cleanly, at your tenant scale, with the engineering time your team can afford is the right one.
For more on adjacent software decisions, the best customer data platform guide covers the data infrastructure layer that often sits upstream of embedded analytics.
FAQs
Embedded business intelligence is the practice of placing dashboards, reports, data exploration, and analytics workflows inside another software product, portal, or operational application rather than requiring users to open a separate analytics tool. The goal is to surface insights in the workflow where a decision happens, reducing context switching and improving time to value for end users.
The two terms overlap heavily in practice. Embedded BI typically emphasizes structured reporting, governed dashboards, and defined business metrics delivered inside an application. Embedded analytics is a broader term that can also include predictive models, natural-language queries, AI-generated insights, and alert-triggered workflows. Many platforms now cover both, so the distinction matters less than the specific capabilities you need.
Evaluate multi-tenancy, row-level security, white-label depth beyond color theming, API and SDK quality, data connectivity, semantic layer governance, and a pricing model that works as your external user count grows. Test a real customer workflow rather than a vendor-configured demo. The maintenance burden across release cycles is often more important than the initial feature set.
Embedded BI can support retention when it helps customers see outcomes, identify problems, and act without leaving your product. The platform does not create retention on its own. The analytics must map to a decision the customer actually needs to make, and the data must be accurate and timely enough to be trusted. Instrumentation of dashboard engagement and feature adoption is the signal to watch.
Buy when analytics enables the product's core workflow but is not the differentiated experience itself. Speed to value, maintenance overhead, and opportunity cost all favor buying in most SaaS contexts. Build when proprietary analytics interaction, custom data modeling, or specialized visualization is central to your product's competitive advantage. Many teams buy the analytics layer and build product-specific workflows around it.
Multi-tenant embedded analytics refers to analytics that safely serves multiple customer accounts from a shared product environment while ensuring each tenant only accesses authorized data. It requires row-level security, workspace isolation, parameterized queries, and identity-aware permissions. Validating the actual isolation behavior, not just the documentation, is a required step in any embedded BI proof of concept.
Most platforms offer some degree of branding and theming. The depth varies significantly. Some tools allow full navigation control, custom CSS, and embedded menus that feel native to your product. Others only support logo and color changes with the vendor's interface still visible. Test actual embedded behavior across navigation states, loading screens, and empty states before treating white-label support as a confirmed capability.
Platforms typically support identity integration with your application's authentication, role-based access controls, row-level security for data filtering by user or tenant, and secure embedding tokens or session management. Audit trails, data-source permissions, and compliance certifications vary by vendor and tier. Product teams must validate the platform's security model against their own architecture requirements and, for regulated industries, involve their security team early in evaluation.
The driver is differentiation. If analytics interaction, proprietary modeling, or custom visualization is central to why customers choose your product over alternatives, build it. If analytics is an enabling layer that helps customers get value from your core product, buy it. Ongoing maintenance cost is the most underestimated factor: Every schema change, tenant addition, and UI update has a maintenance implication for the embedded layer. Factor that into the total cost before deciding.