

Your AI agent returned a confident answer. The retrieval step quietly failed, the wrong tool got called, and the token cost spiked 40% above budget. Nobody caught it until the prospect asked why the demo gave the wrong output.
That is what unobservable AI agents look like in practice. They produce convincing outputs while hiding broken retrieval, failed tool calls, drifting prompts, and unsafe behavior. According to Cleanlab (2025), fewer than 1 in 3 teams running agents in production are satisfied with their current observability and guardrail solutions. At the same time, 62% of organizations are actively experimenting with AI agents, according to McKinsey (2025).
The gap between agent deployment and agent visibility is where presales teams lose technical validation cycles. When a prospect asks why the agent made a particular decision, "we're looking into it" is not an answer that closes deals.
This guide helps you close that gap.
What's inside
This guide compares 15 AI agent observability tools for 2026 across tracing, monitoring, evaluation, governance, and production readiness. It is built for AI engineers, platform teams, ML engineers, SREs, and presales teams supporting technical validation of agent-based products.
Selection criteria used:
- Trace depth: Does the tool capture prompts, tool calls, retrieval, model calls, and state transitions?
- Evaluation workflows: Does it support datasets, regression testing, human review, or LLM judges?
- Cost and governance controls: Does it track token usage and provide RBAC, audit logs, or PII masking?
- Stack fit: Does it work with existing observability backends, agent frameworks, and CRM workflows?
Pricing and G2 ratings reflect verified vendor and G2 data.
TL;DR
- Best enterprise agent observability platform: Datadog Agent Observability for end-to-end traces across agents, tools, services, and infrastructure
- Best framework-native tracing and evaluation: LangSmith for teams building with LangChain or LangGraph
- Best vendor-neutral instrumentation foundation: OpenTelemetry, free and open source
- Best for enterprise APM teams adding AI visibility: Dynatrace or IBM Instana Observability
- Best open-source LLM instrumentation layer: OpenLLMetry for OpenTelemetry-based traces without a commercial platform
- Best for presales supporting POCs: Prioritize tools that show tool-call traces, cost breakdowns, evaluation results, and governance controls in a single view
What is AI agent observability?
AI agent observability is the practice of tracing, monitoring, evaluating, and governing how autonomous or semi-autonomous AI agents reason, call tools, use data, interact with systems, and produce outcomes.
It is not the same as LLM observability, though the two overlap. LLM observability covers model inputs, outputs, latency, token usage, and response quality. Agent observability adds tool selection, API execution, planning steps, state transitions, memory, retrieval, and multi-agent handoffs. You need both, but agents require the fuller picture.
Core telemetry signals to track:
- Prompt and response traces
- Model latency and error rates
- Token usage and estimated cost
- Tool calls and API executions
- Retrieval inputs and retrieved context
- Agent plans, state changes, and reasoning transitions
- User feedback and human review
- Evaluation scores and regression results
- Safety, policy, and prompt-injection events
What makes agent observability different from standard monitoring:
Standard monitoring tracks whether services are up and requests complete within SLOs. Agent observability must also track probabilistic behavior: Did the model choose the right tool, did retrieval return useful context, did the agent plan a reasonable path, and did the output meet quality criteria.
| Area | Traditional observability | AI agent observability |
|---|---|---|
| Main object | Services and infrastructure | Agents, prompts, tools, models |
| Failure mode | Errors, latency, downtime | Hallucinations, drift, unsafe tool use |
| Trace unit | Request or transaction | LLM span, tool call, conversation thread |
| Quality signal | SLO or uptime | Evaluation score, human review, task success |
| Cost signal | Compute and infrastructure | Token usage, model calls, retries |
For presales teams, this distinction matters during technical validation. A prospect asking "why did the agent do that?" needs a trace, not a guess. The right observability layer gives you that trace within seconds.
When to use AI agent observability
Debug agent failures during technical validation
A prospect watches a live demo and asks why the agent returned the wrong answer. Without observability, you are reconstructing from logs and memory. With proper tracing, you can show the exact retrieval step that failed, the tool call that returned an error, or the prompt format that caused the model to misinterpret the query. This turns a potential deal blocker into a demonstration of technical maturity.
Monitor production agents before cost and quality drift
Agents degrade without producing a conventional outage. Response quality drops gradually. Token costs creep up as retries increase. Tool selection drifts as prompts age. Presales teams selling AI products need to show buyers how production behavior will be monitored after go-live. Good observability answers that question before procurement even asks it.
Evaluate changes before shipping new prompts or tools
A small prompt change can alter behavior significantly. Regression testing with golden datasets, LLM judges, and human review lets teams validate that an improvement in one scenario did not break another. For POCs, this is the difference between "trust us, it's better" and "here are the before-and-after evaluation scores."
AI agent observability tools comparison
The table below covers 15 tools across full observability platforms, framework-native tracing, open-source instrumentation, agent frameworks, and developer tools. Some entries are complete monitoring products; others are instrumentation layers or frameworks that enable observability rather than providing dashboards. Use the table as a starting point, then read each entry for fit guidance.
| # | Product | Best for | Key differentiator | Pricing | G2 rating |
|---|---|---|---|---|---|
| 1 | Datadog Agent Observability | Enterprise LLM and agent monitoring | End-to-end traces across agents, tools, services, and infrastructure | Free up to 40K spans/mo; Pro from $160/mo | 4.4/5 |
| 2 | LangSmith | Framework-native tracing and evaluation | Deep tracing, datasets, evaluators, and regression workflows | Free Developer tier; Plus from $39/seat/mo | 4.4/5 |
| 3 | IBM Instana Observability | Enterprise APM expanding into AI | APM depth plus AI monitoring for complex environments | From $0.04/MVS hour (usage-based) | 4.4/5 |
| 4 | Dynatrace | Enterprise observability and automation | Unified telemetry, root-cause analysis, and governance | From $7/mo per host | 4.5/5 |
| 5 | OpenTelemetry | Vendor-neutral telemetry foundation | Open standard for traces, metrics, and logs | Free, open source | N/A |
| 6 | OpenLLMetry | Open-source LLM instrumentation | OpenTelemetry-based LLM tracing and semantic conventions | Free, open source | N/A |
| 7 | IBM BeeAI | Enterprise agent framework building | Open-source agent orchestration under the IBM ecosystem | Free, open source | N/A |
| 8 | LangGraph | Stateful and multi-agent workflows | Graph-based agent state, transitions, and control flow | Free; managed via LangSmith plans | N/A |
| 9 | AutoGen | Multi-agent experimentation | Agent collaboration, conversation patterns, and prototyping | Free, open source | 4.5/5 |
| 10 | MCP | Tool and context interoperability | Standardized connection between agents, tools, and context | Free, open standard | N/A |
| 11 | Claude Code | IDE-assisted code investigation | Agentic coding and instrumentation support in the terminal | From $20/mo (Pro plan) | N/A |
| 12 | Cursor | AI coding environment | AI-assisted codebase navigation, debugging, and telemetry work | Free Hobby; Pro from $20/mo | 4.6/5 |
| 13 | Lapdog | Emerging agent workflow utility | Agent monitoring investigation at an early stage | Contact Lapdog for details | N/A |
| 14 | Harmonic | Formal verification of AI and software | Formal proof verification for C code and hardware designs | Consumption-based; contact sales | N/A |
| 15 | Polly | In-workflow feedback and evaluation | Human review collection inside Slack and Teams | Free tier available; paid plans by quote | 4.6/5 |
Best 15 AI agent observability tools for 2026
1. Datadog Agent Observability
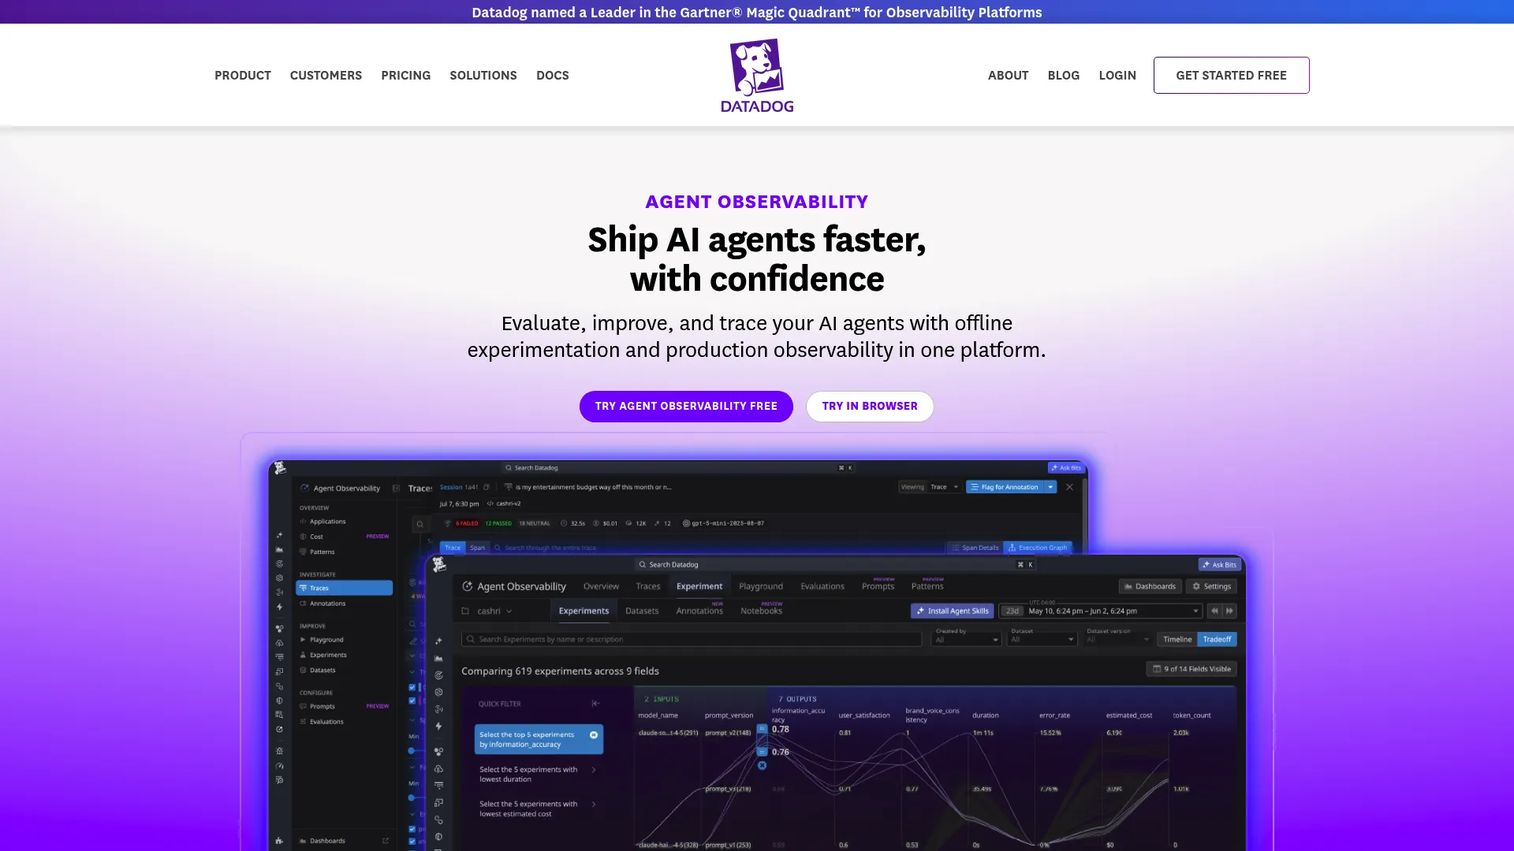
Datadog Agent Observability is built for engineering, AI, SRE, and DevOps teams operating production AI agents at scale. It traces prompts, retrieval steps, tool calls, and agent decisions while correlating that data with application services, infrastructure health, and user sessions. Offline experimentation, datasets, human review, and built-in evaluators let teams run structured quality assessments on top of live trace data. Governance features include RBAC, sensitive-data controls, PII detection, and prompt-injection monitoring.
Best for: Enterprise teams that want LLM traces, agent behavior, service health, and infrastructure all correlated in one environment.
Key features
- LLM span tracing with latency, token usage, retries, and error rates
- Dataset versioning from production traces for offline experimentation
- Built-in and custom evaluators with human review and annotations
- Hallucination and prompt-injection detection
- RBAC and sensitive-data controls with alerting and retention configuration
Why choose Datadog Agent Observability: Strong fit when the buyer already runs Datadog or needs AI traces correlated with non-AI systems. Presales teams can show a unified trace from user query through agent decision to downstream service call, which is exactly what a technical validation audience wants to see.
Datadog Agent Observability pricing: Free up to 40K LLM spans per month. Pro starts at $160 per month and includes 100K LLM spans; additional usage and retention are billed separately.
G2 rating: 4.4/5
2. LangSmith
LangSmith is a framework-agnostic agent engineering platform for observing, evaluating, deploying, and monitoring AI agents. It traces LLM calls, prompts, tool executions, retrieval, state changes, and multi-turn conversations. Datasets, evaluators, regression testing, and online evaluations give teams a structured improvement loop rather than a passive dashboard. Production traces can be converted directly into test cases, so a failure caught in a live session becomes a regression check for future deployments.
Best for: Teams building production AI agents who need unified tracing, evaluation, and regression workflows in one place.
Key features
- Agent trace visualization with thread-level debugging
- Evaluation datasets and custom or built-in evaluators
- Regression testing with golden test sets
- Online evaluations on live production traffic
- Framework-agnostic instrumentation (not locked to LangChain)
Why choose LangSmith: Strong choice when engineering teams need detailed visibility into agent behavior during both development and production. For POCs, it lets presales teams show prospects that agent improvements are testable and measurable, not anecdotal.
LangSmith pricing: Developer plan is free with one seat and up to 5K traces per month. Plus costs $39 per seat per month with up to 10K traces. Enterprise pricing is custom.
G2 rating: 4.4/5
3. IBM Instana Observability
IBM Instana Observability is a full-stack observability platform providing automated, AI-powered visibility across applications, infrastructure, services, and AI workloads. Automatic service discovery maps dependencies across cloud-native and hybrid environments without manual configuration. Distributed end-to-end tracing, infrastructure monitoring, and root-cause analysis sit alongside AI and LLM observability signals for teams extending existing APM into agent workflows. It supports OpenTelemetry data collection, which matters when buyers ask about vendor portability.
Best for: DevOps, SRE, and engineering teams with complex cloud-native or hybrid environments who want to extend existing APM into AI agent monitoring.
Key features
- Automatic service discovery and dependency mapping
- Distributed end-to-end tracing across hybrid environments
- AI and LLM observability signals
- OpenTelemetry data collection
- Enterprise alerting and root-cause analysis
Why choose IBM Instana Observability: Use this when the buyer's technical estate includes IBM environments, complex microservice architectures, or multi-cloud deployments. Presales teams supporting enterprise procurement should emphasize the governance and operations fit alongside the AI monitoring capability.
IBM Instana Observability pricing: Usage-based PayPerUse starts at $0.04 per MVS hour per month. SaaS plans start at $23.10 per MVS per month. Self-hosted annual pricing starts at $385.20 per MVS per year. A 14-day free trial is available.
G2 rating: 4.4/5
4. Dynatrace
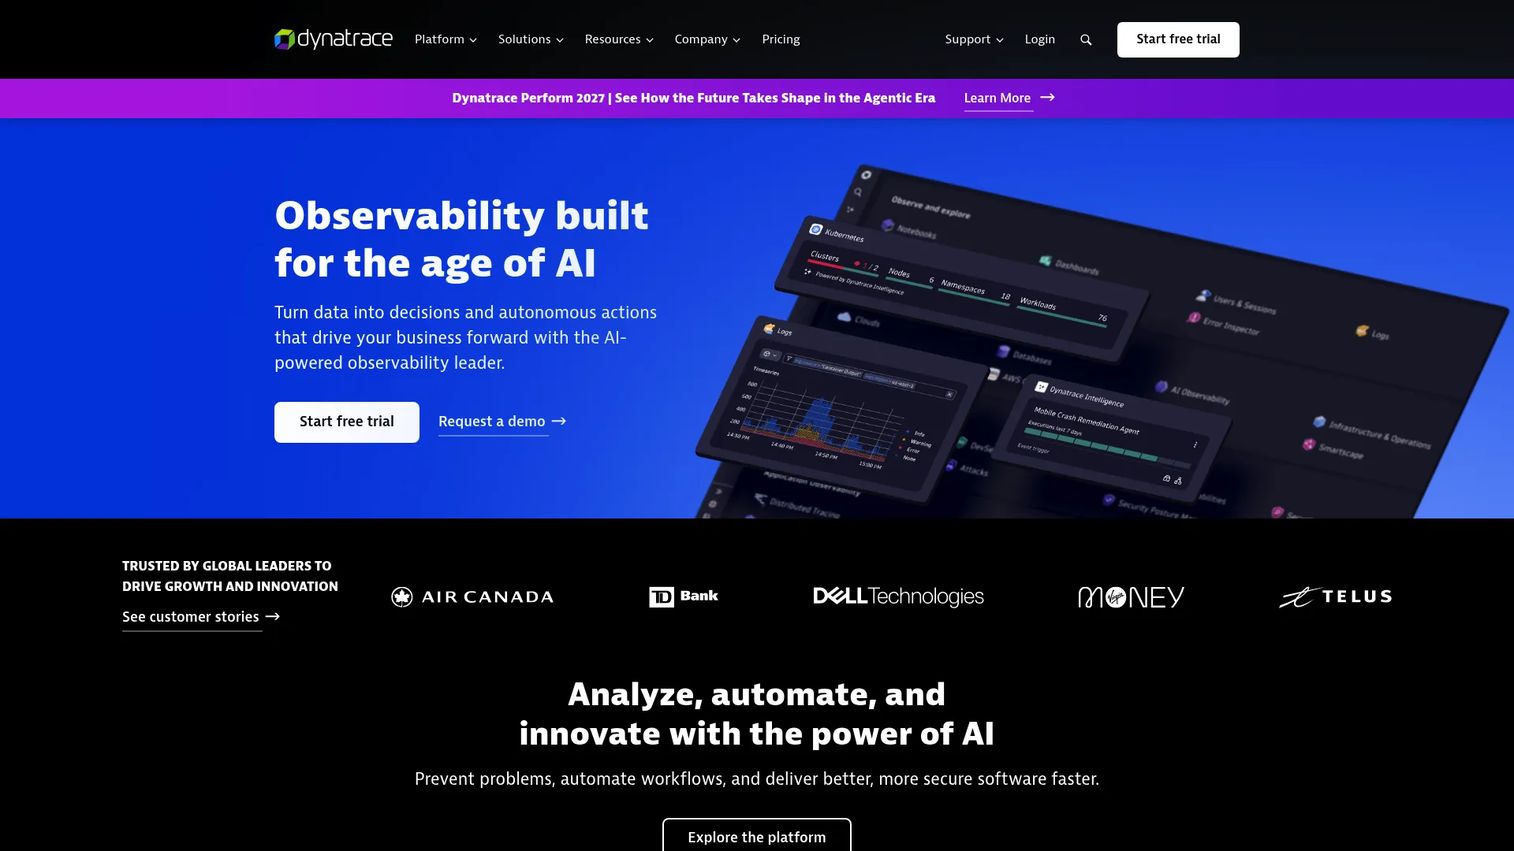
Dynatrace is a unified observability, security, and automation platform with strong AI-powered root-cause analysis. It provides end-to-end application and infrastructure observability through automatic instrumentation via OneAgent, with unified telemetry across logs, metrics, traces, and events via Grail and DQL. OpenTelemetry support gives teams flexibility in how they instrument agent workflows. Governance features include automated SLO management, compliance workflows, and integrated application security.
Best for: Large organizations that already run Dynatrace and want AI agent visibility tied to production systems, SLOs, and automation workflows.
Key features
- Automatic discovery and instrumentation via OneAgent
- Unified telemetry: Logs, metrics, traces, and events via Grail
- OpenTelemetry support for agent instrumentation
- Causal and predictive AI for root-cause analysis
- SLO management and governance workflows
Why choose Dynatrace: Strong fit when a prospect's evaluation includes SRE, platform engineering, or security stakeholders alongside AI engineers. The automation and root-cause analysis capabilities answer the "who gets paged when the agent fails at 2am?" question before it's asked.
Dynatrace pricing: Foundation and Discovery starts at $7 per month per host. Infrastructure Monitoring is $29 per month per host. Full-Stack Monitoring starts at $58 per month per 8 GiB host. A 15-day free trial is available.
G2 rating: 4.5/5
5. OpenTelemetry
OpenTelemetry is an open-source, vendor-neutral observability framework for generating, collecting, and exporting telemetry data including traces, metrics, logs, and baggage. It is not a finished observability product with dashboards or alerts. Instead, it provides the instrumentation layer that feeds data into the visualization and analysis platform of your choice. SDKs cover 12+ programming languages, automatic instrumentation handles popular frameworks, and the OpenTelemetry Collector routes, filters, and exports telemetry to multiple backends simultaneously.
Best for: Engineering and platform teams that want vendor-neutral, multi-language telemetry instrumentation before committing to a specific observability backend.
Key features
- Vendor-neutral traces, metrics, and logs via OTLP
- Automatic instrumentation for popular frameworks and libraries
- OpenTelemetry Collector for routing and exporting to multiple backends
- Context propagation across service boundaries
- SDKs for 12+ programming languages
Why choose OpenTelemetry: Choose this when avoiding vendor lock-in matters or when the team needs a portable instrumentation layer that works with multiple observability platforms. For presales teams, understanding the difference between instrumentation and an observability platform helps answer the "can we switch backends later?" objection credibly.
OpenTelemetry pricing: Free and open source. No paid tiers.
6. OpenLLMetry
OpenLLMetry is an open-source LLM and GenAI instrumentation library built on OpenTelemetry. It provides semantic conventions for model calls, prompts, completions, vector database interactions, and agent frameworks. Telemetry can be exported to any OpenTelemetry-compatible observability backend, so teams retain their choice of analysis platform. It is an instrumentation layer rather than a monitoring dashboard, making it a practical starting point for teams not yet ready to commit to a commercial platform.
Best for: Developers adding vendor-neutral, OpenTelemetry-based traces to LLM and GenAI applications without buying into a full commercial platform.
Key features
- Semantic conventions for LLM calls, prompts, and completions
- Instrumentation for vector database spans
- Support for multiple agent frameworks
- Export to any OpenTelemetry-compatible backend
- Open-source under a permissive license
Why choose OpenLLMetry: Use this when engineering teams want structured LLM traces from day one but aren't ready to standardize on a commercial backend. The OpenTelemetry foundation means the investment in instrumentation isn't wasted when the platform decision changes.
OpenLLMetry pricing: Free and open source. Check the GitHub repository for current licensing details.
7. IBM BeeAI
IBM BeeAI is an open-source toolkit for building production-ready intelligent agents and multi-agent systems in Python or TypeScript. It provides unified backend interfaces for LLM providers, built-in and custom tool support, and a Requirement Agent for rule-constrained agent behavior. While not a standalone observability dashboard, BeeAI is relevant to AI agent observability through its governance alignment and enterprise workflow context. IBM notes the code was developed by IBM contributors as open source; the repository operates under Apache-2.0.
Best for: Developers building customizable, multi-agent AI systems within the IBM ecosystem using Python or TypeScript.
Key features
- Unified backend interfaces for multiple LLM providers
- Requirement Agent for rule-constrained behavior
- Built-in and custom tool support (web search, code execution, more)
- Python and TypeScript SDKs
- Apache-2.0 open-source license
Why choose IBM BeeAI: Use when the team is already evaluating IBM's agent stack and wants a framework that aligns with enterprise governance expectations. Pair with a dedicated observability backend for production monitoring.
IBM BeeAI pricing: Free and open source.
8. LangGraph
LangGraph is a low-level agent runtime and orchestration framework for building stateful, long-running AI agents and workflows. It models agent behavior as a graph, where each node represents a step and each edge represents a transition. This structure makes it straightforward to trace exactly how an agent moved from one state to another and why. Human-in-the-loop controls, persistent memory, durable execution, and fault tolerance are built in. LangGraph integrates directly with LangSmith for tracing and evaluation, so the framework and observability layer share context.
Best for: Developers building stateful, multi-step, or multi-agent workflows that require fine-grained control over agent transitions and durable execution.
Key features
- Graph-based agent state and transition modeling
- Human-in-the-loop controls at any node
- Persistent memory and conversation history
- Durable execution and fault tolerance
- LangSmith integration for tracing and evaluation
Why choose LangGraph: Use when agent behavior depends on branching state transitions and you need to explain or audit which path the agent took and why. The LangSmith integration means observability is included rather than bolted on.
LangGraph pricing: Open source and free to use. Managed deployment capabilities are available through LangSmith plans, with Developer free, Plus at $39 per seat per month, and Enterprise at custom pricing.
9. AutoGen
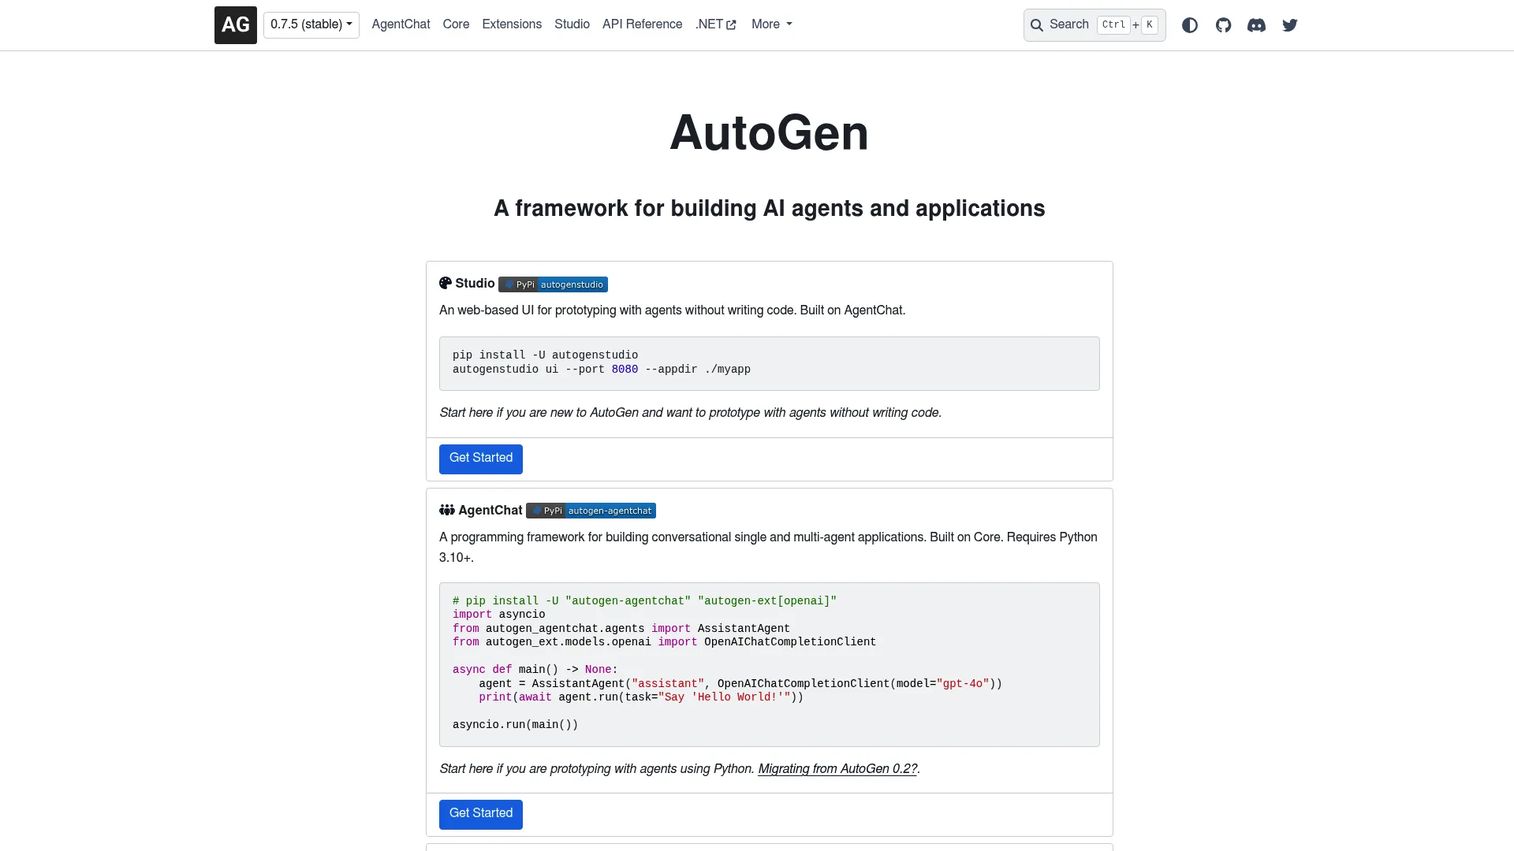
AutoGen is an open-source Microsoft framework for building AI agents and multi-agent applications. It supports event-driven, distributed multi-agent systems and conversational single-agent applications. AutoGen Studio provides low-code visual prototyping for teams exploring agent collaboration patterns before committing to a production architecture. Tool, model, human, and multimodal agent integrations are built in. It is primarily a framework for building and experimenting with agents rather than an enterprise monitoring product.
Best for: Developers and research teams exploring multi-agent collaboration patterns, prototyping agent architectures, and testing coordination behavior.
Key features
- Event-driven and distributed multi-agent support
- Conversational single- and multi-agent applications
- AutoGen Studio for low-code visual prototyping
- Tool, model, human, and multimodal integrations
- Python-first with an active open-source community
Why choose AutoGen: Strong for teams in the experimentation phase who want to understand multi-agent coordination before investing in a production monitoring stack. Add a dedicated observability layer when moving toward production deployment.
AutoGen pricing: Free and open source. Verify current licensing at the project repository.
G2 rating: 4.5/5
10. MCP
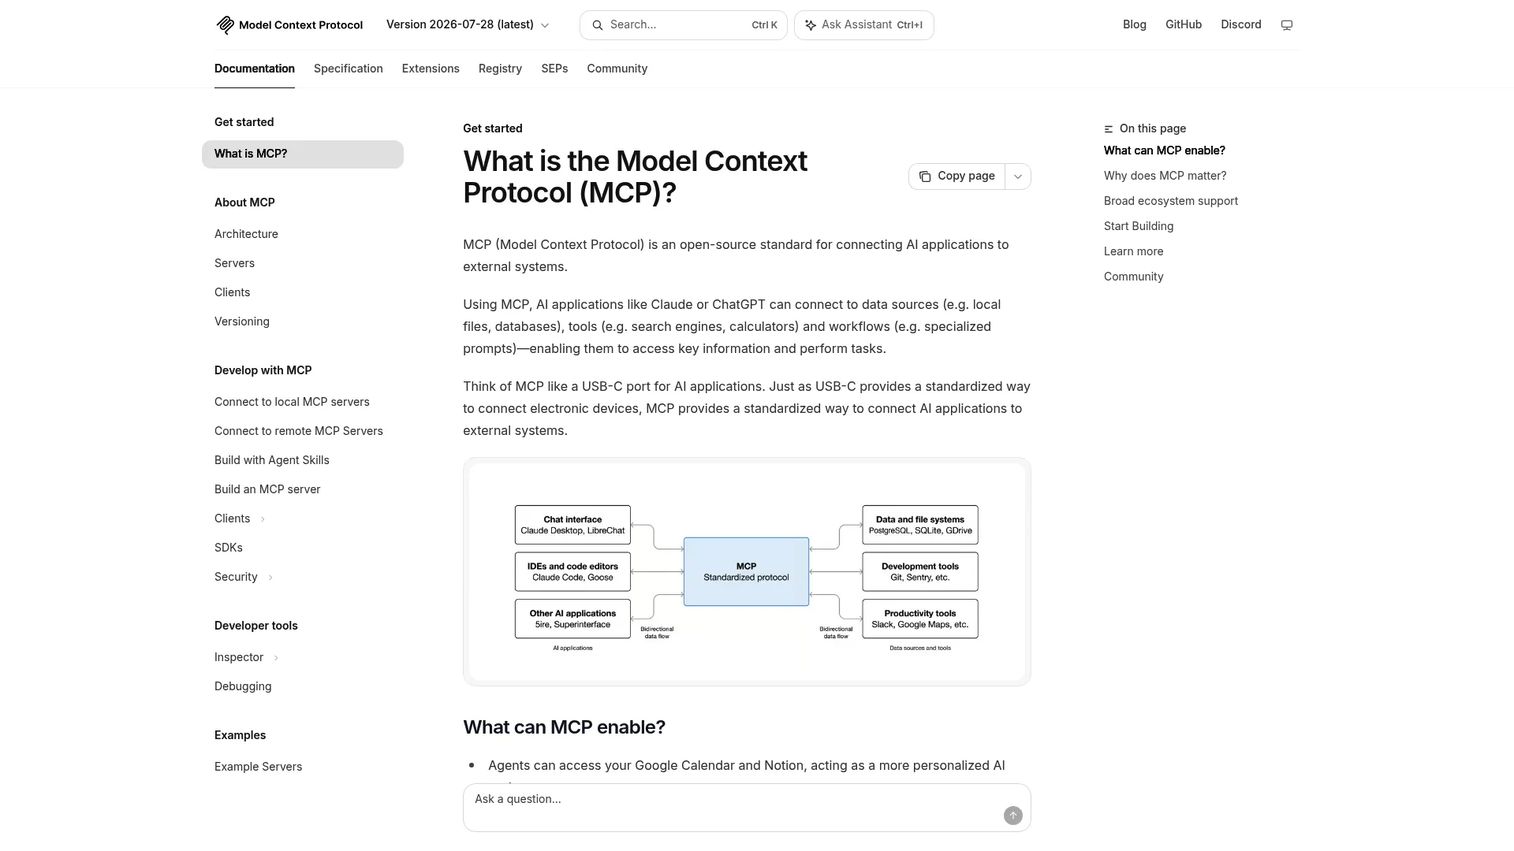
MCP (Model Context Protocol) is an open-source standard for connecting AI applications to external systems including data sources, tools, and workflows. It defines how agents discover capabilities, negotiate behavior, and communicate with servers using JSON-RPC 2.0. MCP is not a monitoring dashboard. Its relevance to AI agent observability is structural: By standardizing how agents connect to tools and context, it creates cleaner boundaries for instrumentation. Tool calls and context flows become more traceable when the protocol itself is well-defined.
Best for: Developers and organizations building AI applications that need standardized, interoperable access to external data, tools, and workflows.
Key features
- Standardized tool and resource connection protocol
- Tools, resources, and prompts as core server primitives
- Local STDIO and remote Streamable HTTP transports
- JSON-RPC 2.0 client-server communication
- Discovery and capability negotiation
Why choose MCP: Use when agent architectures need a cleaner, more auditable way to connect and monitor external tool interactions. The protocol layer reduces the instrumentation complexity that comes from ad hoc tool integrations.
MCP pricing: Free and open standard.
11. Claude Code
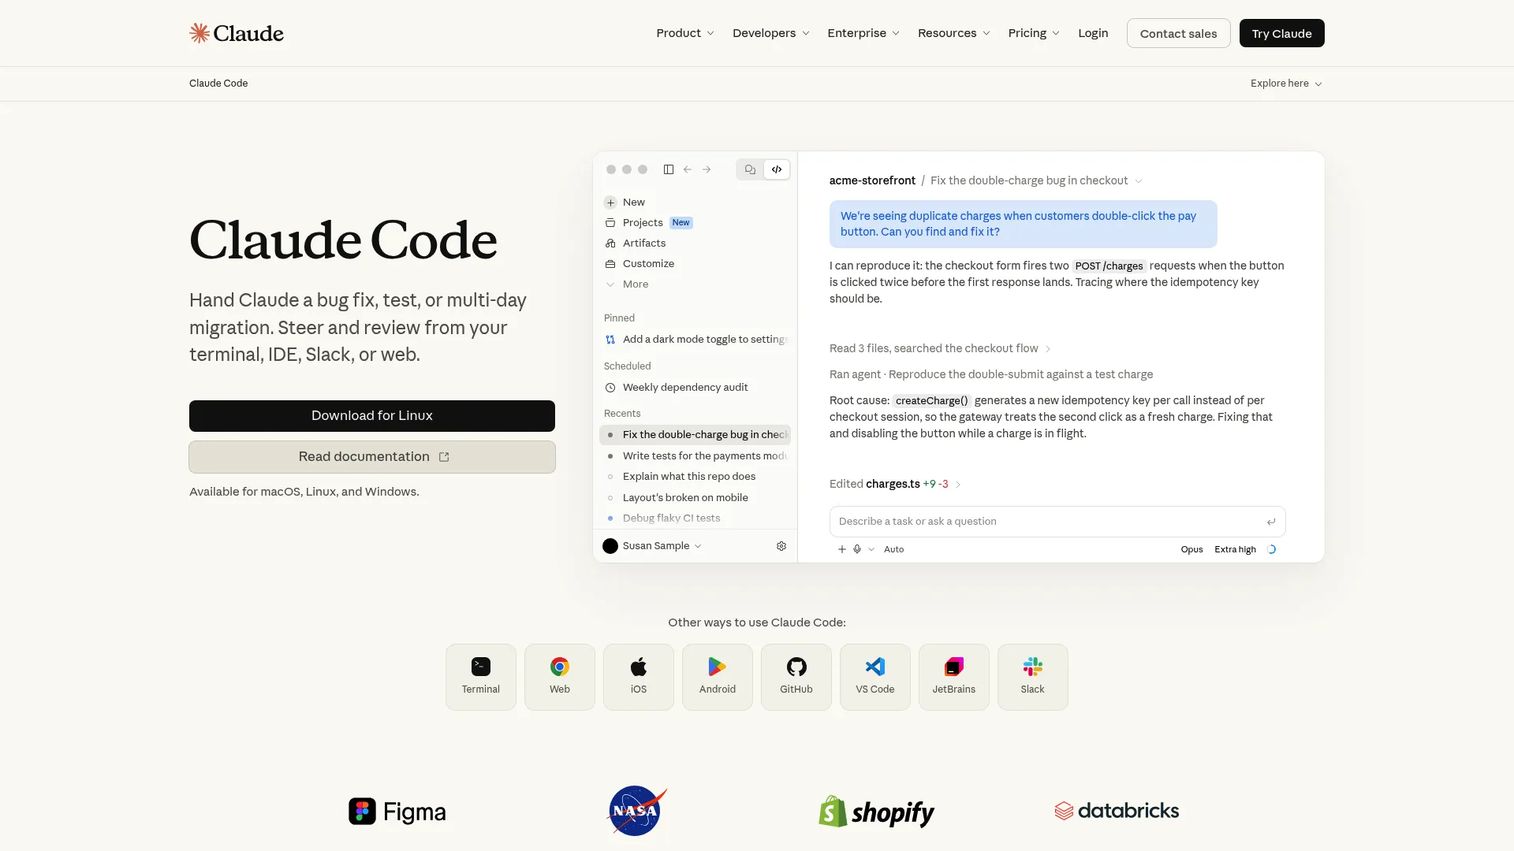
Claude Code is an agentic coding tool that works in the terminal and IDE to read codebases, edit files, run commands, write tests, and support GitHub workflows. For AI agent observability, its relevance is at the implementation level: It helps engineers add tracing instrumentation, navigate trace-related code paths, refactor agent workflows, and diagnose failures through codebase search and multi-file edits. It is not a monitoring backend or observability platform. Teams already using Claude in engineering workflows will find it accelerates the work of getting observability into the codebase.
Best for: Developers who want an agentic coding assistant for repository-wide implementation, instrumentation, debugging, and GitHub workflows.
Key features
- Codebase reading and multi-file editing
- Terminal and VS Code integration
- GitHub commits and pull request support
- Subagents, hooks, and background task support
- Code execution and test running
Why choose Claude Code: Use when the challenge is getting instrumentation into an active codebase quickly, not replacing a monitoring backend. It reduces the time from "we should add tracing here" to a working implementation.
Claude Code pricing: Available through Claude Pro at $20 per month (monthly) or $17 per month (annual). Max plans at $100 and $200 per month increase usage limits. API access is billed separately.
12. Cursor
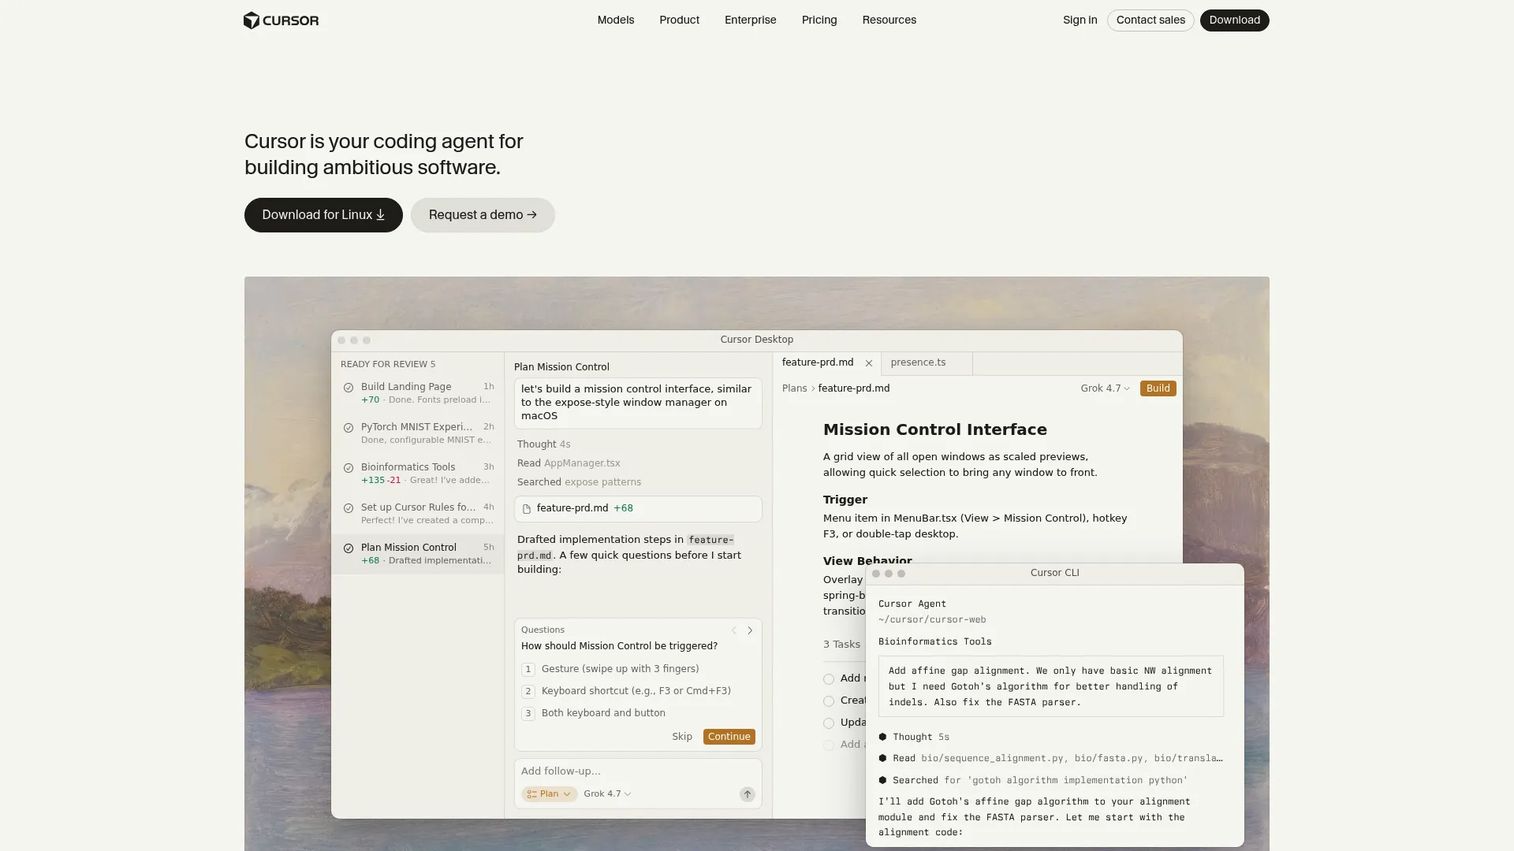
Cursor is an AI-powered coding editor and agent platform for building, debugging, reviewing, and shipping software. It provides context-aware autocomplete, multi-line edits, and codebase understanding through fast code search. For AI agent observability work, Cursor helps engineers add telemetry hooks, navigate trace-related code, refactor agent workflows, and investigate failures inside an active repository. Like Claude Code, it supports implementation rather than runtime monitoring. Teams that need to instrument agent code quickly benefit from its repo-aware assistance.
Best for: Developers and engineering teams that want AI-assisted coding across desktop, CLI, and web environments for instrumentation, debugging, and telemetry work.
Key features
- Agentic coding across desktop, CLI, and web
- Fast codebase search and repo-aware context
- Context-aware autocomplete and multi-line edits
- Debugging support and code navigation
- Teams and Enterprise plans for collaborative workflows
Why choose Cursor: Strong when engineering teams need to move quickly through an existing codebase to add monitoring, fix instrumentation gaps, or investigate a tracing issue. The free Hobby tier lets teams evaluate fit before committing to a paid plan.
Cursor pricing: Free Hobby plan available. Pro costs $20 per month. Pro+ is $60 per month, Ultra is $200 per month. Teams Standard is $40 per user per month; Teams Premium is $120 per user per month. Enterprise pricing is custom.
G2 rating: 4.6/5
13. Lapdog
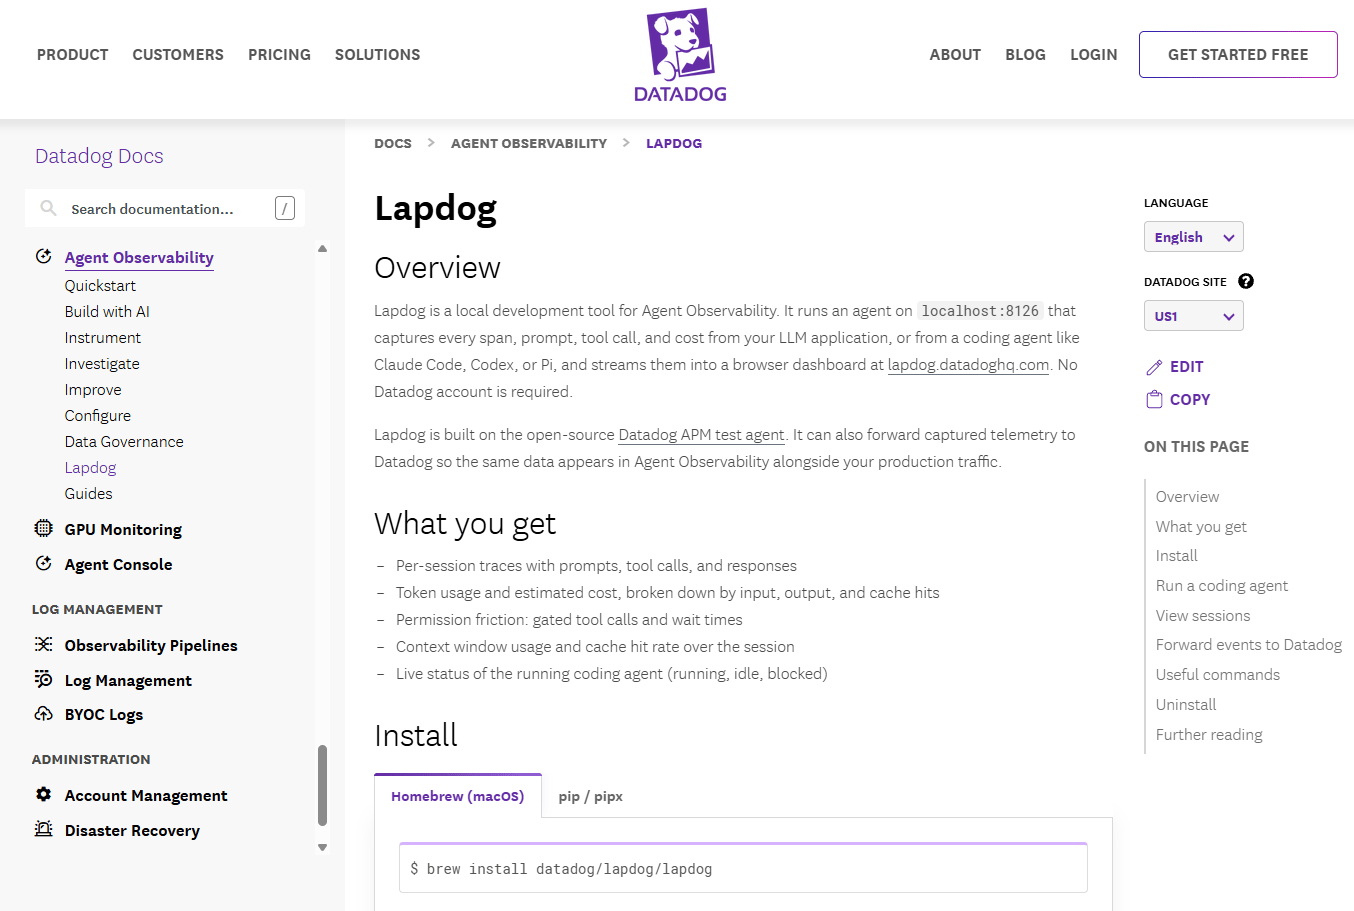
Lapdog is listed as an emerging tool in the AI agent workflow space. The official site was inaccessible during research and the domain resolved to a parked page. As a result, no verified product description, feature set, pricing, or G2 rating could be confirmed from primary sources.
Best for: Cannot be confirmed from available information.
Key features
- Agent workflow support (unverified)
- Monitoring utility (unverified)
- Developer-oriented setup (unverified)
Why choose Lapdog: Verify current product status directly with the team at lapdog.ai before including it in a shortlist. The tool may have moved, rebranded, or changed scope since this guide was published.
Lapdog pricing: Contact Lapdog for current pricing and product details.
14. Harmonic
Harmonic develops Aristotle, an AI system for formally verifying software, hardware, and mathematical reasoning. It applies formal verification to C code and Verilog hardware designs, using plain-English property specifications to generate and prove theorems automatically. Verification results are machine-checked and return proved, refuted, or unresolved verdicts. The relevance to AI agent observability is specialized: For teams building safety-critical or formally verified AI pipelines, Harmonic addresses a different layer than trace-based monitoring. It answers whether a component behaves correctly under all conditions, not just observed ones.
Best for: Engineering teams verifying mission-critical C software and Verilog hardware designs where formal proof is required rather than probabilistic monitoring.
Key features
- Formal verification of C code and Verilog hardware designs
- Plain-English property specification and automatic theorem generation
- Machine-checked proofs with proved, refuted, or unresolved verdicts
- On-premises and private-cloud deployment
- Consumption-based pricing with no seat licenses
Why choose Harmonic: Relevant when the technical evaluation requires formal verification of safety properties rather than behavioral monitoring. This is a specialist tool for a narrower set of use cases than runtime agent observability.
Harmonic pricing: Consumption-based pricing with no seat licenses or upfront fees. Enterprise pricing available through sales. Contact Harmonic for specifics.
15. Polly
Polly is a workplace participation platform for polls, surveys, Q&A, quizzes, and team activities across Slack, Microsoft Teams, and presentations. It includes AI-assisted poll creation, anonymity controls, scheduling, reminders, and analytics with CSV export and webhook support. Its relevance to agentic AI tools evaluation is at the human review layer: Teams using Polly to collect in-workflow feedback on agent outputs can close the loop between agent behavior and human judgment without building a custom review interface. It is not an agent trace platform or LLM monitoring tool.
Best for: Teams needing in-workflow employee feedback, polling, and human review collection inside Slack and Teams without custom development.
Key features
- Polls, surveys, Q&A, and quizzes in Slack and Teams
- Anonymity controls, scheduling, and reminders
- AI-assisted poll creation and templates
- Analytics, CSV exports, Google Sheets integration, and webhooks
- Pulse checks and standup formats
Why choose Polly: Use when the team needs a lightweight way to collect human review signals on agent outputs from internal reviewers inside their existing Slack or Teams workflow. Pair with a dedicated observability backend for trace-level visibility.
Polly pricing: Free tier includes 25 responses per month and 45 days of results history. Standard, Pro, and Enterprise plans increase limits and add capabilities. Contact Polly for current pricing on paid plans.
G2 rating: 4.6/5
Considerations when choosing AI agent observability tools
Trace depth across the full agent path
Check whether the tool captures prompts, responses, model calls, retrieval inputs, tool executions, API calls, state transitions, and downstream service calls. A dashboard that shows latency but misses tool call failures will not help when a prospect asks why the agent took the wrong action. For presales teams, trace depth determines whether you can explain a failure during technical validation rather than escalating to engineering.
Evaluation workflows, not just dashboards
Dashboards show what happened. Evaluations show whether behavior improved. Look for dataset support, golden test sets, LLM judges, code checks, human review workflows, and online evaluations. Teams that can show before-and-after evaluation scores during a POC build more buyer confidence than teams that point to a latency graph.
Cost, latency, and reliability monitoring
Token usage, model latency, retries, error rates, and timeout patterns connect agent behavior to infrastructure spend. This matters especially when a prospect's finance or procurement team asks what production costs look like. Tools that surface token cost per request or per session make that conversation concrete.
Governance, security, and sensitive-data controls
Ask vendors how telemetry is stored, masked, retained, and shared. RBAC, audit logs, PII masking, prompt-injection monitoring, and data retention policies are evaluation criteria for security-conscious buyers. This is also one of the most common questions in enterprise procurement reviews for AI products. See our AI governance tools guide for a broader perspective on this layer.
Integration with your existing stack
The right tool for one team may add friction for another. Agent framework support, observability backend compatibility, cloud stack fit, IDE preferences, and CRM or ticketing integrations all affect adoption. Avoid creating a separate observability silo that the engineering team ignores in practice. Check whether the tool supports your current agentic AI platforms before committing.
Conclusion
The observability tools in this guide cover a range of needs. Datadog Agent Observability suits enterprise teams that want end-to-end traces across AI and non-AI systems in one environment. LangSmith serves framework-native teams that need structured evaluation alongside tracing. OpenTelemetry and OpenLLMetry provide vendor-neutral instrumentation foundations for teams not ready to standardize on a commercial platform. Dynatrace and IBM Instana Observability fit enterprises extending existing APM into AI agent workloads. LangGraph and AutoGen address the framework layer for stateful and multi-agent development. Cursor and Claude Code help engineering teams add instrumentation faster. Polly covers the human review layer inside Slack and Teams.
Before shortlisting, map the agent workflow: User request, prompt, model call, retrieval, tool executions, downstream service, output, and evaluation. Then identify where visibility gaps cause the most friction for your team and your buyers. Run one POC using the same failure scenario across two or three tools. That test will tell you more than any comparison table.
Choosing an observability tool is easier when prospects can see your technical workflow clearly. If your team needs to explain complex AI, infrastructure, or SaaS workflows during presales, an interactive demo or sandbox gives buyers a self-serve product experience before the next call. Organize your demo assets in a Demo Center so your whole presales team can find and share the right one at the right deal stage.
Start your journey with Guideflow today!
FAQs
AI agent observability is the practice of tracing, monitoring, evaluating, and governing how AI agents reason, call tools, retrieve data, interact with external systems, and produce outcomes. It covers telemetry signals including prompts, responses, model calls, tool executions, retrieval inputs, state transitions, evaluation scores, and safety events. The goal is to understand what an agent did, why it did it, and whether the outcome met quality and cost targets.
LLM observability tracks model inputs, outputs, latency, token usage, and response quality at the model call level. Agent observability adds the layers around the model: Tool selection, API execution, planning steps, state transitions, memory, retrieval quality, and multi-agent handoffs. You need both for a complete picture, but agents introduce failure modes that LLM-only monitoring cannot surface.
Start with prompts and responses, model latency, token usage per session, tool call inputs and outputs, retrieval inputs and retrieved context, error rates and retries, and task-level outcomes. Add user feedback and evaluation scores once a baseline is established. Collecting everything without a review plan creates noise rather than signal.
OpenTelemetry is a strong foundation for vendor-neutral traces, metrics, and logs, and many production teams standardize on it to retain backend flexibility. Some teams start with framework-native tracing instead, particularly when using LangGraph or LangSmith. The choice depends on existing observability infrastructure, desired backend portability, and production deployment requirements.
The main risks are hallucinations that go undetected, failed tool calls that produce incorrect outputs, unsafe actions triggered by prompt injection, runaway token costs from unchecked retries, model drift as prompts age, poor retrieval quality that degrades answer accuracy, and unexplained user-facing failures that damage buyer confidence. Without observability, all of these are discovered by the customer rather than the team.
Production evaluation typically combines online evaluations on live traffic, offline regression tests against golden datasets, LLM-as-judge workflows for quality scoring, human review for high-stakes outputs, and task-level success metrics. Each approach needs a baseline before it produces meaningful signal. See our guide to AI software testing tools for broader context on evaluation infrastructure.
No single tool wins for every POC. Prioritize tools that show readable traces from user request to final output, evaluation reports with before-and-after scores, cost and latency breakdowns by session, governance controls you can explain to a security reviewer, and export options that let you share findings with the buying committee. Datadog Agent Observability and LangSmith both meet these criteria for most POC contexts. See our guide to best presales software tools for broader stack guidance.
Traditional APM tools can monitor the infrastructure and services that agents run on. They cannot surface prompt quality, tool call failures, retrieval accuracy, evaluation scores, or agent decision paths without AI-specific instrumentation. Adding OpenTelemetry-based instrumentation with LLM semantic conventions, or using a platform like Datadog or Dynatrace that has extended into AI agent observability, bridges the gap.