

Your metrics table just crossed a billion rows. Queries that ran in milliseconds last quarter now time out during a dashboard refresh. The retention job you scheduled to run overnight is still churning at 9 a.m. Your engineers keep patching around it, but the shape of the data hasn't changed. Only the volume has.
Time-stamped data grows in a way that punishes general-purpose databases. Every sensor reading, every request trace, every price tick appends another row that you rarely update and almost never delete one at a time. That write pattern, combined with the specific way teams query it (recent windows for alerting, long ranges for trend analysis) is exactly what a time series database is built to handle.
The market reflects that pressure. The global time series database software market was valued at USD 1.49 billion in 2025 and is projected to reach USD 3.49 billion by 2035, growing at an 8.28% CAGR, according to SNS Insider (2025). More than 62% of organizations were already using cloud-based, analytics-driven time series database software in 2025 for real-time monitoring and decision-making.
For a product manager, the choice is not academic. Pick the wrong store and you inherit a maintenance tax that competes with feature work, drags on activation metrics, and pulls engineering into firefighting instead of the roadmap. Pick well and ingestion, retention, and query performance stop being your problem. If you are early in your evaluation of the broader data stack, it also helps to think about how tools connect downstream, from your best data visualization tools to the best customer data platform feeding your analytics.
What's inside
This guide compares seven time series databases across the workloads product and engineering teams actually run: ingesting telemetry at scale, querying recent and historical metrics fast, and handling high-cardinality data without a cost spiral. We picked tools that show up repeatedly in real evaluations, span open source and managed options, and cover observability, SQL-first analytics, and IoT.
We scored each on ingestion speed, query performance, SQL support, scalability, compression and retention, ecosystem fit, and openness. Pricing and ratings come from each vendor's live pricing page and current G2 listing. Use the comparison table as a shortlist, then read the individual sections for fit.
TL;DR
- Best overall reference point: InfluxDB, for broad time series workloads spanning metrics, IoT, and real-time analytics with strong ingest.
- Best SQL-friendly option: TimescaleDB, if your team already knows PostgreSQL and wants relational joins alongside time series.
- Best for observability and alerting: Prometheus, the open-source default for metrics collection and monitoring.
- Best for metrics at scale: VictoriaMetrics, for storage-efficient, Prometheus-compatible observability.
- Best for high-throughput SQL analytics: QuestDB, for financial data and event streams that need low-latency ingest.
- Best for IoT and industrial data: TDengine, purpose-built for sensors, edge, and historian workloads.
- Best for large-scale analytical queries: ClickHouse, when your workload is analytics-heavy more than pure time series.
What is a time series database?
A time series database (TSDB) is a database optimized to ingest, store, and query data indexed primarily by time, where each record is a timestamped measurement rather than a mutable business object. Instead of treating a row as something you update and delete, a TSDB treats it as an event you append and later aggregate over a time range.
That single design decision changes everything downstream. In a relational model, time is usually just another column. In a time series model, time is the axis around which storage layout, indexing, compression, and query planning are organized. That is why a purpose-built time series db can sustain write rates and range-query speeds that a general relational database struggles with once volume climbs.
Core capabilities you should expect from any serious database for time series data:
- High-throughput ingestion: sustained appends from many sources without write amplification killing performance.
- Low-latency range queries: fast reads over recent windows for dashboards and alerting, plus efficient scans over long historical ranges.
- Compression and downsampling: columnar or delta encoding that shrinks storage, paired with rollups that keep old data queryable without keeping every raw point.
- Retention policies: automated expiry so raw data ages out on a schedule you define instead of by manual cleanup.
- Analytics compatibility: SQL or a purpose-built query language, plus connectors into your dashboards, BI tools, and alerting stack.
Some of these tools are marketed as an observability database, others as an IoT time series database, and several as general-purpose stores that happen to excel at time series. The category label matters less than whether the engine matches your write pattern and query shape.
When to use a time series database
Not every timestamped table needs a specialized engine. Here is how to tell when the switch pays off.
Ingest telemetry or sensor data at scale
When you are streaming metrics from thousands of servers, devices, or application instances, a general database starts to buckle. Write throughput becomes the bottleneck, indexes bloat, and vacuum or compaction jobs fall behind. A TSDB is engineered for append-heavy ingestion, so device telemetry, application metrics, and event streams land without the write amplification that punishes row-oriented stores. If you are instrumenting a product and expect ingestion to grow with usage, this is the clearest signal to specialize.
Query recent trends and long-range patterns quickly
Dashboards, alerting, anomaly detection, and historical analysis all lean on time range queries. You want the last five minutes for an alert and the last twelve months for a capacity trend, ideally from the same store. Time series databases optimize both: hot recent data stays fast for real-time monitoring, while downsampled history stays cheap to scan. If your team spends its day looking at charts of "what changed and when," this is your use case.
Model data that grows fast and becomes expensive to keep raw
Raw high-resolution data gets expensive quickly. A TSDB lets you set retention policies, compress aggressively, and downsample old data into rollups so you keep the trend without keeping every point. That is the difference between a storage bill that scales linearly with usage and one that plateaus. If your finance team has ever flagged your data storage line item, retention and compression are why a purpose-built store earns its place.
Comparison table
The table below sorts by relevance to general time series workloads, then to observability and analytics specializations. Pricing reflects each vendor's public pricing page; ratings come from each product's current G2 listing. Open-source editions are free to self-host where noted.
| # | Product | Intent | Key use case | Pricing | G2 rating |
|---|---|---|---|---|---|
| 1 | InfluxDB | General-purpose TSDB | Metrics, IoT, monitoring, real-time analytics | Free tier; Cloud usage-based; Enterprise custom | 4.4/5 |
| 2 | TimescaleDB | SQL time series database | PostgreSQL-native time series and analytics | From $30/month; self-hosted OSS free | 4.6/5 |
| 3 | Prometheus | Observability database | Open-source metrics monitoring and alerting | Free, open source | 4.5/5 |
| 4 | VictoriaMetrics | Metrics at scale | Storage-efficient, Prometheus-compatible observability | From $225/month; OSS free | 5.0/5 |
| 5 | QuestDB | High-throughput SQL TSDB | Financial data, telemetry, real-time analytics | OSS free; Enterprise sales-led | 4.8/5 |
| 6 | TDengine | IoT time series database | Industrial, sensor, and edge data historian | OSS free; Cloud from $600/month | 4.7/5 |
| 7 | ClickHouse | Analytical database | Large-scale SQL analytics and mixed workloads | OSS free; Cloud usage-based | 4.5/5 |
1. InfluxDB
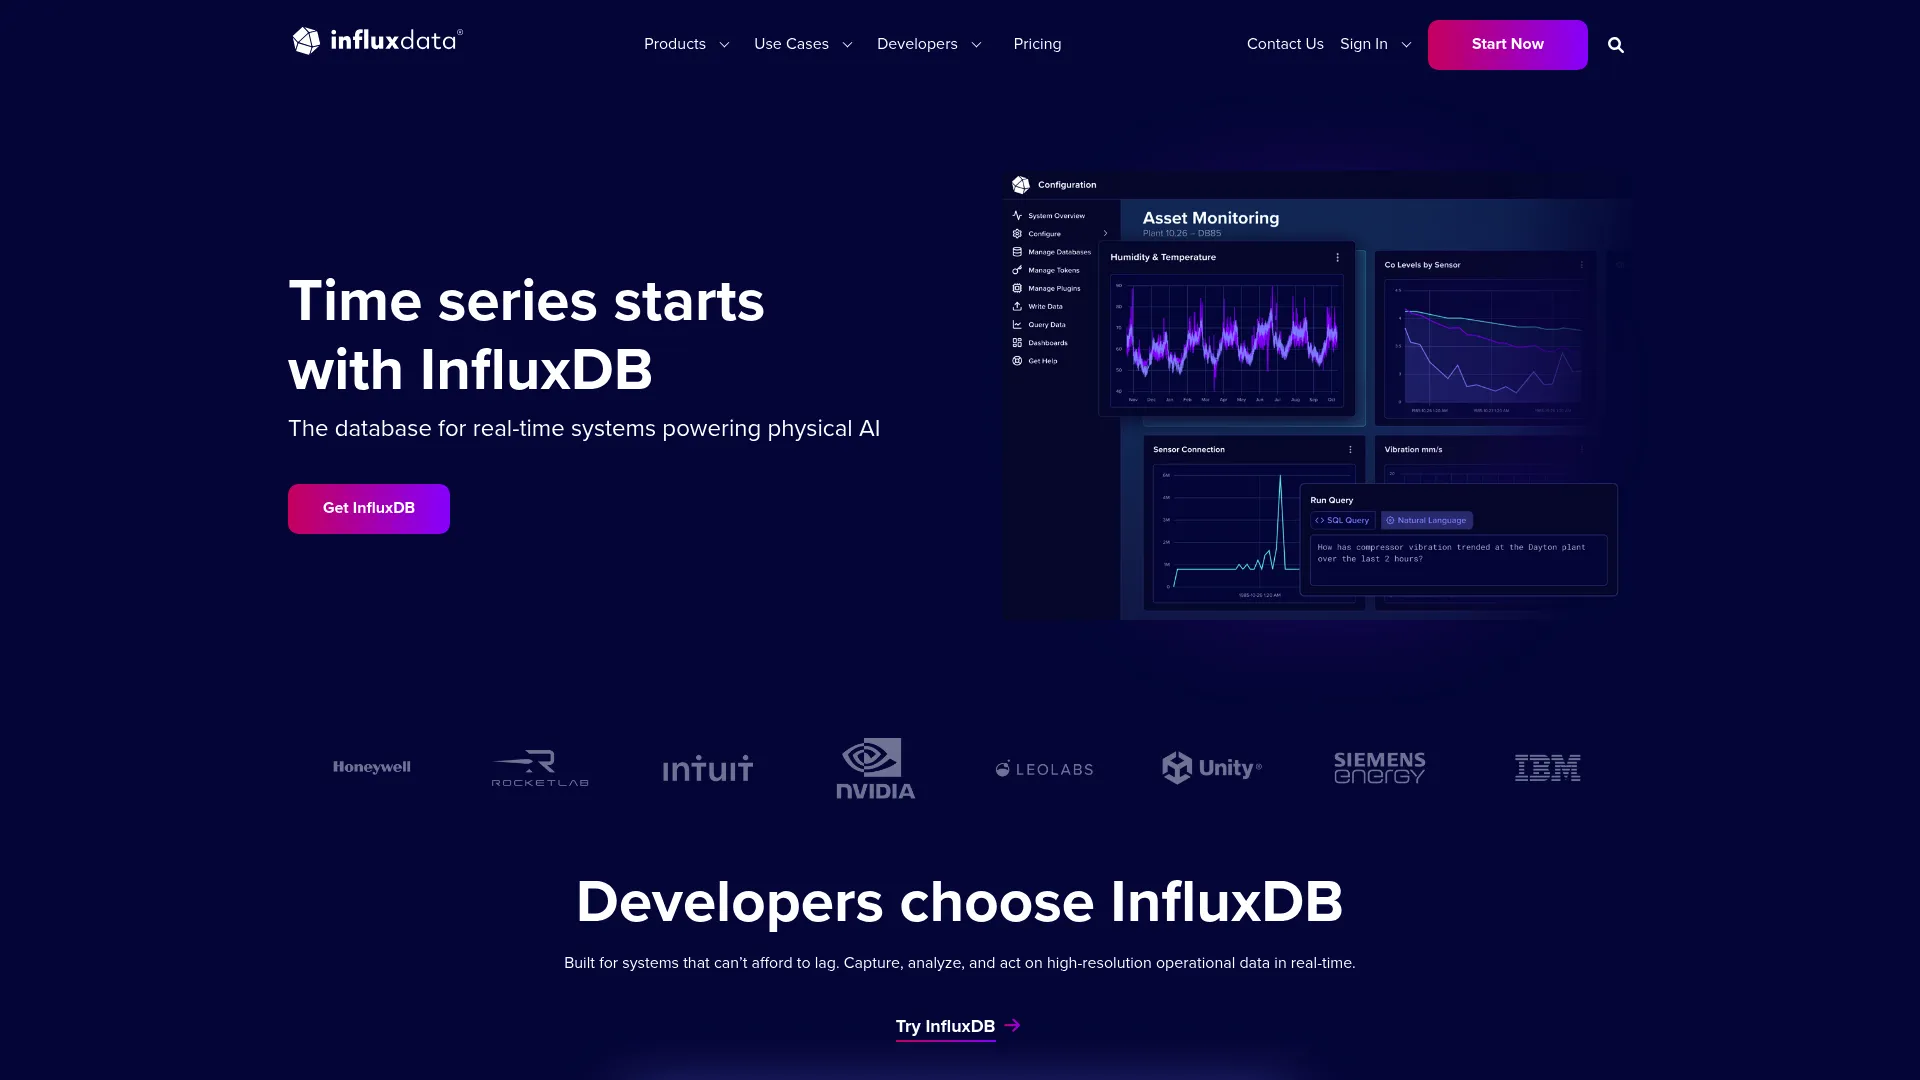
InfluxDB is the tool most teams benchmark against when they first search for a time series database. It is a purpose-built TSDB and platform for ingesting, storing, and querying high-frequency timestamped data, and it has been the category's default reference point for years. The current generation supports both SQL and InfluxQL, high-speed ingest, and sub-10ms queries for recent data, which covers the range of workloads a product team cares about.
What makes InfluxDB a safe first evaluation is breadth. It handles metrics, IoT device data, infrastructure monitoring, and real-time analytics without forcing you into a single niche. If your workload is still taking shape, that flexibility means you are less likely to outgrow the tool as your data model evolves. The ecosystem is mature too, with agents, client libraries, and integrations that reduce the engineering lift of getting data in and charts out.
Best for: Teams building time series workloads across metrics, IoT, monitoring, and real-time analytics who want a proven, flexible engine.
Key strengths
- High-speed ingest and fast reads: sustained ingestion with sub-10ms queries for recent data, so dashboards and alerts stay responsive.
- SQL and InfluxQL support: query in familiar SQL or the purpose-built InfluxQL, easing the learning curve for mixed teams.
- In-database processing: run custom Python processing inside the database to transform data without a separate compute layer.
Why choose InfluxDB: If you want one engine that covers most time series patterns without committing to observability-only or analytics-only tooling, InfluxDB is the low-risk starting point. Its maturity means fewer surprises during evaluation and a large community when you hit an edge case.
InfluxDB pricing: InfluxDB Cloud Serverless has a free tier, then usage-based pricing (for example, $0.0025 per MB written, $0.012 per 100 query executions, and $0.002 per GB-hour of storage). InfluxDB 3 Core is free forever for self-hosting. InfluxDB 3 Enterprise and Cloud Dedicated are custom-priced, and AWS-native Timestream for InfluxDB uses AWS consumption pricing.
2. TimescaleDB
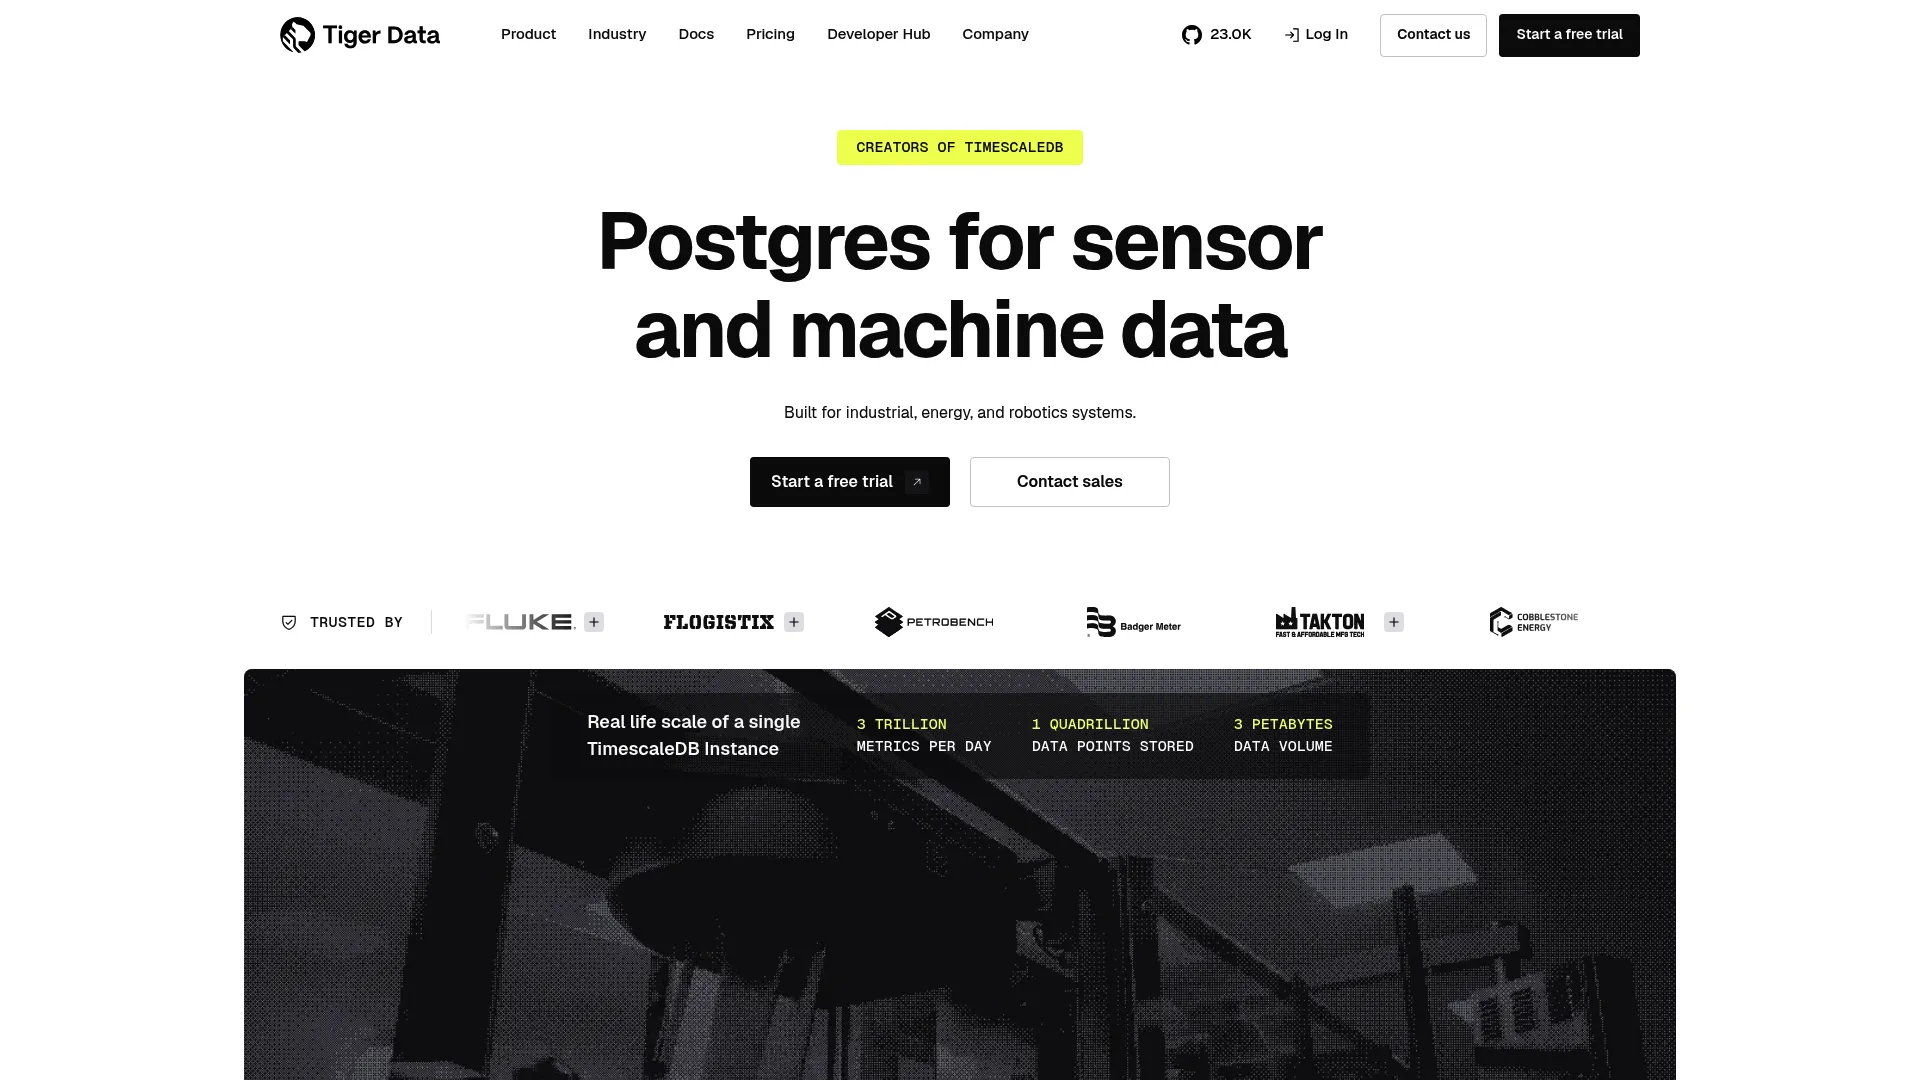
TimescaleDB takes a different route: it builds time series capabilities on top of PostgreSQL. For teams that already run Postgres, that is a meaningful advantage. Your engineers keep their SQL, your existing tools keep working, and you add hypertables and time-based partitioning without adopting a new query language or a separate operational skill set.
The relational foundation is the real story here. Because it is Postgres underneath, you can join time series data against your relational tables, run standard SQL analytics, and mix operational and analytical workloads in one place. That makes TimescaleDB a strong pick when your time series data does not live in isolation but needs to be correlated with users, accounts, or product entities. Continuous aggregates handle the rollups, and columnar compression with tiered storage keeps costs in check as history grows.
Best for: Teams that want PostgreSQL-native time series storage and analytics, especially where relational joins matter.
Key strengths
- Hypertables and time-based partitioning: automatic partitioning that keeps large time series tables fast without manual sharding.
- Continuous aggregates: incrementally maintained rollups so common dashboard queries stay cheap and fast.
- Columnar compression and tiered storage: aggressive compression plus tiering that pushes older data to cheaper storage.
Why choose TimescaleDB: If SQL familiarity and PostgreSQL compatibility reduce your team's maintenance burden, this is the pragmatic choice. You get a specialized time series engine without asking engineers to learn a new stack, which lowers the opportunity cost of adoption.
TimescaleDB pricing: Public cloud pricing starts at $30/month for the Performance tier and $36/month for Scale, both billed as pay-as-you-go hourly. Enterprise is quote-based. Self-hosted open-source TimescaleDB is free, so you can validate the engine before committing to managed hosting.
3. Prometheus
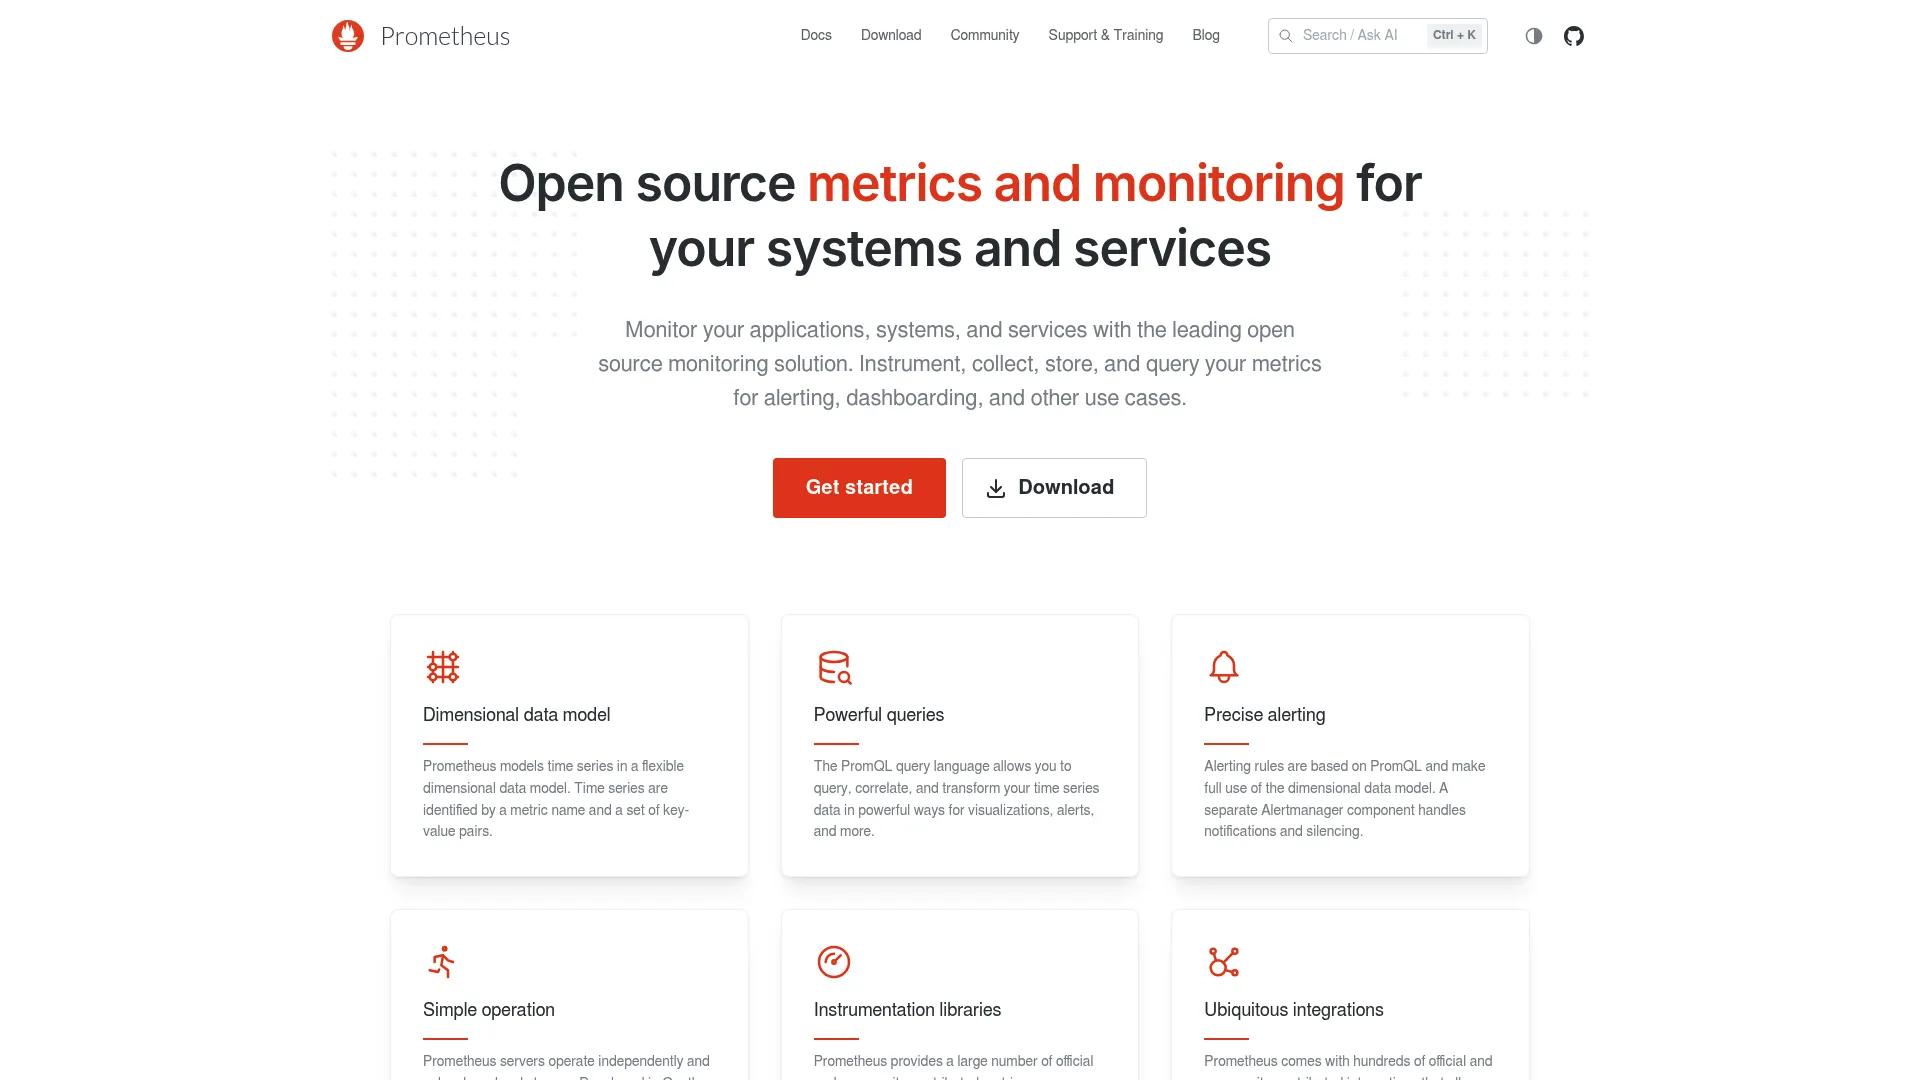
Prometheus is the open-source standard for metrics monitoring and alerting. If your primary job is watching infrastructure and application health, Prometheus is where most teams start. It pulls metrics on a schedule, stores them in a multi-dimensional data model, and lets you slice them with PromQL, its purpose-built query language for observability.
Where Prometheus excels is the monitoring and alerting loop. Its pull-based collection, service discovery, and Alertmanager integration make it the backbone of many observability stacks. IT infrastructure monitoring and observability accounted for 40.35% of the time series database software market's application share in 2025, per SNS Insider, and Prometheus sits at the center of that segment. Teams often pair it with long-term storage and a visualization layer, which is normal for the observability pattern rather than a knock against the tool.
Best for: Teams that need open-source metrics monitoring and alerting for infrastructure and application health.
Key strengths
- Multi-dimensional data model: label-based metrics that make slicing by service, region, or instance straightforward.
- PromQL query language: an expressive query language built specifically for metrics and alerting logic.
- Alerting with Alertmanager: rule-based alerting with routing, grouping, and silencing through Alertmanager.
Why choose Prometheus: If observability is the job and you want a battle-tested, community-driven tool with no license cost, Prometheus is the default. It performs best as the collection and alerting engine, paired with your preferred storage and dashboards for the full picture.
Prometheus pricing: Prometheus is 100% open source and community-driven, with no paid tier on the official project. You run it yourself, so the cost is infrastructure and operational time rather than licensing. Managed Prometheus-compatible offerings exist from third parties if you prefer not to self-host.
4. VictoriaMetrics
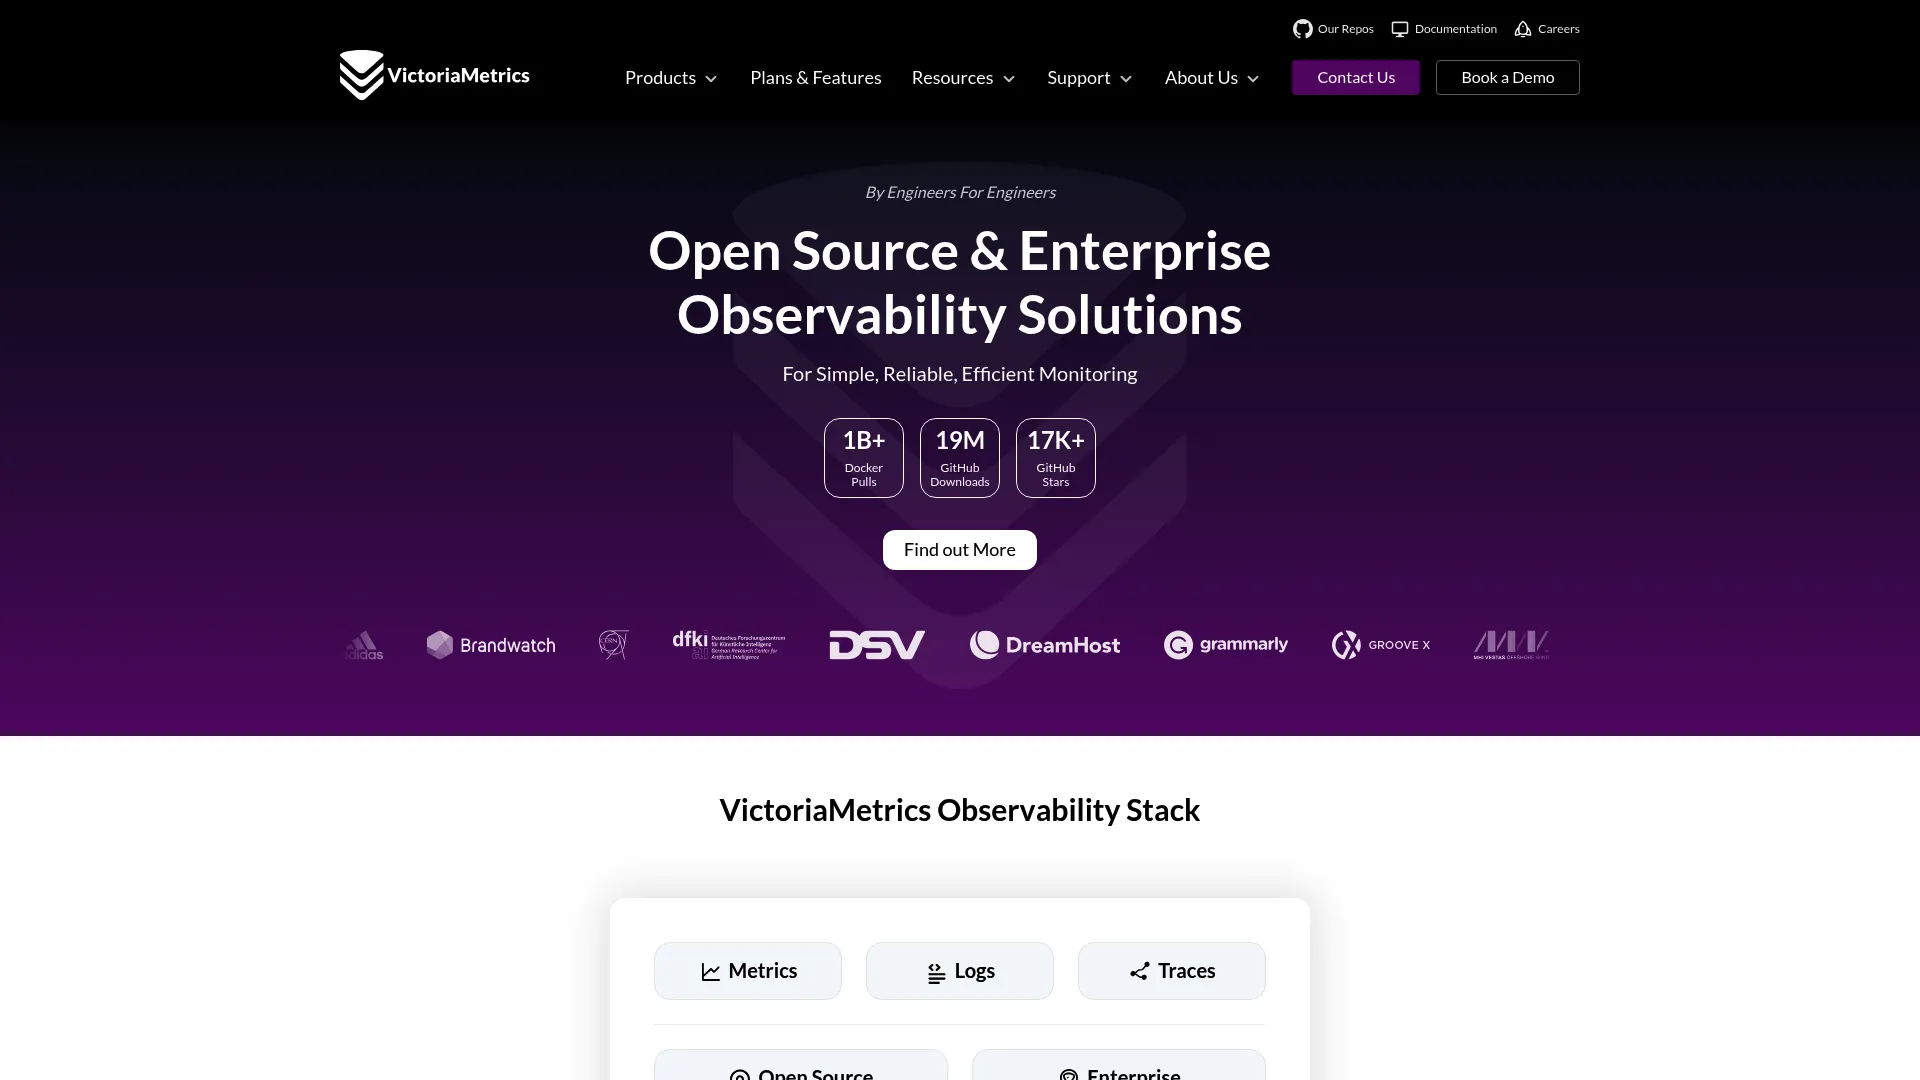
VictoriaMetrics is a metrics-focused option built for monitoring-heavy workloads that need to scale efficiently. It is Prometheus-compatible, so it slots into existing observability stacks with minimal disruption, but it is engineered for higher storage efficiency and scale. For teams whose Prometheus setup is straining under cardinality or retention pressure, VictoriaMetrics is a common next step.
The appeal is efficiency at scale. It stores and queries metrics with strong compression, extends into logs through VictoriaLogs, and offers a managed cloud with backups, alerting, and AWS integration if you would rather not operate it yourself. Because it speaks the Prometheus query and ingestion protocols, migrating or augmenting an existing stack is low-friction, which matters when you are trying to reduce operational overhead without ripping out what already works.
Best for: Teams needing scalable, storage-efficient time series observability with an optional managed cloud.
Key strengths
- Prometheus-compatible storage and querying: drop into existing stacks that already speak Prometheus protocols.
- VictoriaLogs for logs: extend the same platform to log storage and search alongside metrics.
- Managed cloud option: VictoriaMetrics Cloud handles deployments, backups, alerting, and AWS integration.
Why choose VictoriaMetrics: If you are scaling observability and want storage efficiency without abandoning Prometheus compatibility, this is a strong fit. It reduces the cost of keeping more metrics for longer, which is exactly the pressure most growing monitoring stacks hit.
VictoriaMetrics pricing: VictoriaMetrics Cloud is tier-based, with a Single node tier from $225/month and a Cluster tier from $1,300/month, billed monthly pay-as-you-go or on annual contracts. A 7-day trial with $200 in credits is available. The open-source edition is free to self-host, so you can validate scale before moving to managed hosting.
5. QuestDB
QuestDB is an open-source time series database built around fast ingestion and SQL-native analysis. It is a natural fit when you have high-throughput event streams and want to query them with standard SQL rather than a specialized language. That combination shows up often in financial data, real-time analytics pipelines, and telemetry workloads where every millisecond of ingest and query latency counts.
The SQL-first design is what sets it apart for many teams. You get familiar SQL plus time series extensions like SAMPLE BY for downsampling and ASOF JOIN for aligning series that do not share exact timestamps, which is common in market data. Materialized views, array support, and open formats with Parquet and multi-tier storage round out a feature set aimed at teams that treat time series as an analytics problem, not just a monitoring one.
Best for: Teams needing a high-performance time series database for real-time analytics, trading, and telemetry workloads.
Key strengths
- SQL-first time series queries: standard SQL with time series extensions, so analysts and engineers query without a new language.
- Purpose-built time operators: SAMPLE BY, ASOF JOIN, materialized views, and array support tuned for time series analysis.
- Open formats and tiered storage: Parquet support and multi-tier storage that keep data portable and cost-efficient.
Why choose QuestDB: If your workload is ingest-heavy and analytics-first, and your team lives in SQL, QuestDB removes the friction of learning a proprietary query language. It performs best when low-latency ingest and fast SQL over recent and historical data are both non-negotiable.
QuestDB pricing: QuestDB open source is free to self-host. QuestDB Enterprise is sales-led, with pricing available through the vendor rather than a public price on the enterprise page. Starting with the open-source edition lets you validate ingest and query performance on your own data before a commercial conversation.
6. TDengine
TDengine is a time series database and industrial data historian built for IoT, sensor, and edge workloads. If your data comes from devices, machines, or industrial systems, TDengine is designed around exactly that shape of data. It shows up consistently in comparisons focused on sensors, telemetry, and edge scenarios because it treats device data as a first-class citizen rather than a generic metric stream.
The IoT and industrial focus runs deep. TDengine's TSDB offers SQL-based ingestion, querying, stream processing, caching, and data subscription, while its connector library covers MQTT, Kafka, OPC, PI System, JDBC, and ODBC, the protocols industrial data actually speaks. The Historian tier adds built-in AI and time series analytics, including forecasting and anomaly detection through TDgpt, exposed via SQL. For product teams building on connected devices, that connectivity and analytics depth reduces the integration work of getting data from the edge to a dashboard.
Best for: Industrial and IoT teams needing a historian or TSDB with strong device connectivity and AI-native analytics.
Key strengths
- SQL-based time series engine: ingestion, querying, stream processing, caching, and data subscription in one SQL-driven platform.
- Industrial connectors: native support for MQTT, Kafka, OPC, PI System, JDBC, and ODBC for real-world device integration.
- Built-in analytics: forecasting and anomaly detection through TDgpt, accessible via SQL rather than a separate tool.
Why choose TDengine: If your time series data is fundamentally device and sensor data, TDengine's protocol coverage and historian features cut the integration overhead you would otherwise carry. It performs best in industrial and IoT contexts where retention, ingestion patterns, and edge connectivity define the workload.
TDengine pricing: TDengine OSS is free, and TDengine Enterprise is quote-based. TDengine Cloud plans start at $600/month for the TSDB Starter (or $6,000/year) and $970/month for the Historian Starter (or $11,640/year). A free trial is available, so you can test device ingestion before committing.
7. ClickHouse
ClickHouse appears in most serious time series conversations even though it is broader than a pure TSDB. It is an open-source, column-oriented SQL database built for real-time, large-scale analytical workloads, and its raw query speed over huge datasets is why teams reach for it when time series is part of a wider analytics problem. If you are running analytics across billions of rows and time is one dimension among several, ClickHouse is hard to ignore.
The strength is analytical throughput. Column-oriented storage, aggressive compression, and a mature SQL engine let ClickHouse scan and aggregate enormous datasets fast. ClickHouse Cloud adds autoscaling and multi-AZ replication, while ClickPipes handles ingestion from Kafka, S3, PostgreSQL, MongoDB, GCS, and MySQL. The honest framing: ClickHouse is often used as an analytical store rather than a dedicated time series database, so it fits best when your primary need is large-scale analytics with time series as one facet, not device-level metric collection with alerting.
Best for: Teams needing fast SQL analytics over large, high-volume datasets where time series is one part of a broader workload.
Key strengths
- Column-oriented SQL analytics: columnar storage and compression that make large aggregations fast.
- Managed cloud with autoscaling: ClickHouse Cloud handles scaling and multi-AZ replication for you.
- Broad ingestion connectors: ClickPipes ingests from Kafka, S3, PostgreSQL, MongoDB, GCS, and MySQL.
Why choose ClickHouse: If your workload is analytics-heavy and mixed, and you want one fast SQL engine across time series and other data, ClickHouse delivers. It performs best as an analytical store; pair it with a metrics-first tool if dedicated monitoring and alerting are your core need.
ClickHouse pricing: ClickHouse open source is free to self-host. ClickHouse Cloud uses usage-based pricing, with details available through the vendor, and the Cloud page mentions a 30-day trial with $300 in credits. Starting on the open-source edition lets you benchmark query speed on your own data before pricing a managed deployment.
Considerations before you commit
The right time series database is the one that matches your data, not the one with the loudest benchmarks. Run through this checklist before you sign anything.
Evaluate ingestion patterns first
Before you look at any marketing claim, characterize your write volume, cardinality, and event shape. Are you appending a steady stream from a few sources, or bursting from thousands of devices? High cardinality (many unique label combinations) breaks tools differently than raw volume does. Match the engine to your actual ingestion profile, because that is where general databases fail first.
Check query language fit
SQL support is not a cosmetic feature. If your analysts and engineers already write SQL, a sql time series database lowers the learning curve and speeds up every downstream report. If your job is observability, a purpose-built language like PromQL may serve you better. Weigh team familiarity as a real cost, not an afterthought.
Factor in retention and compression
Storage is where time series bills quietly balloon. Look at how each tool compresses data, whether it downsamples old points into rollups, and how easily you can set retention policies. The real ownership cost is not the license, it is the storage curve over eighteen months of growth.
Validate integrations and ecosystem
Your database does not live alone. Confirm it connects to your dashboards, alerting, ingestion agents, BI tools, and cloud provider. Cloud-based managed deployments held 55.25% of the time series database software market in 2025 per SNS Insider, so if you want managed hosting, verify it is available and mature.
Consider operational overhead
Finally, be honest about who maintains this. Check setup effort, upgrade paths, maintenance expectations, and governance requirements. For a PM, operational overhead is opportunity cost: every hour engineering spends babysitting the database is an hour not spent on the roadmap.
Conclusion
There is no single winner here, only the right fit for your workload. Reach for InfluxDB when you want a broad, proven engine across metrics, IoT, and analytics. Choose TimescaleDB if PostgreSQL familiarity and relational joins matter. Pick Prometheus for observability and alerting, and VictoriaMetrics when that monitoring stack needs to scale efficiently. Go with QuestDB for high-throughput SQL analytics, TDengine for IoT and industrial data, and ClickHouse when your problem is large-scale analytics with time series as one dimension.
The next step is simple and cheap: shortlist two tools, model one real workload, and test both ingestion and query patterns against your actual data before committing. Most of these offer a free tier or open-source edition precisely so you can do this without a sales call. Evaluate the shortlist internally against your write volume, query shape, and team skills, and let the results decide.
If you are mapping the wider stack these databases feed, it is worth reviewing your data visualization layer and how your b2b contact database software and customer data platform connect the dots across teams.
Start your journey with Guideflow today!
FAQs
A time series database is used to store and query data indexed by time, such as infrastructure and application metrics, IoT and sensor telemetry, financial market data, and event analytics. It excels at high-throughput ingestion and fast time range queries, which makes it the backbone of monitoring, alerting, anomaly detection, and historical trend analysis. Teams choose one when timestamped data grows faster than a general database can comfortably handle.
PostgreSQL works fine for time series data at modest scale, especially if your volumes are low and your queries are simple. Once you hit high ingestion rates, large historical ranges, or serious storage costs, specialized features like automatic partitioning, continuous aggregates, and columnar compression start to matter. That is exactly the gap TimescaleDB fills by adding time series capabilities on top of PostgreSQL, so you keep the SQL you know while removing the scaling limits.
It depends on the job. For metrics monitoring and alerting, Prometheus is the open source default. For SQL-native analytics on high-throughput data, QuestDB is a strong open source time series database. For scale-efficient observability, VictoriaMetrics stands out, and for PostgreSQL-based workloads, self-hosted TimescaleDB is free. Match the engine to your query shape rather than chasing a single "best" label.
High cardinality means a large number of unique label or tag combinations, like per-user or per-device series, and it stresses the indexing and metadata layer more than raw write volume does. Time series databases handle it through efficient index structures, columnar storage, and compression tuned for repetitive timestamped values. When evaluating tools for high cardinality time series data, test with your real label combinations, because synthetic benchmarks rarely reflect how your metadata actually explodes in production.
For pure observability, Prometheus is the metrics-first standard, valued for its pull-based collection, PromQL, and Alertmanager integration. When that stack needs to scale or retain more data efficiently, VictoriaMetrics is a common, Prometheus-compatible next step. The best observability database is the one that fits your alerting workflow and integrates cleanly with your dashboards, so weigh ecosystem fit as heavily as raw performance.
For IoT and industrial workloads, TDengine is purpose-built around device and sensor data, with native connectors for protocols like MQTT, OPC, and PI System. InfluxDB is also a strong general-purpose choice for IoT time series database needs when you want broad flexibility across device, metric, and analytics workloads. The deciding factors are your ingestion pattern from the edge, retention requirements, and how much protocol connectivity you need out of the box.