

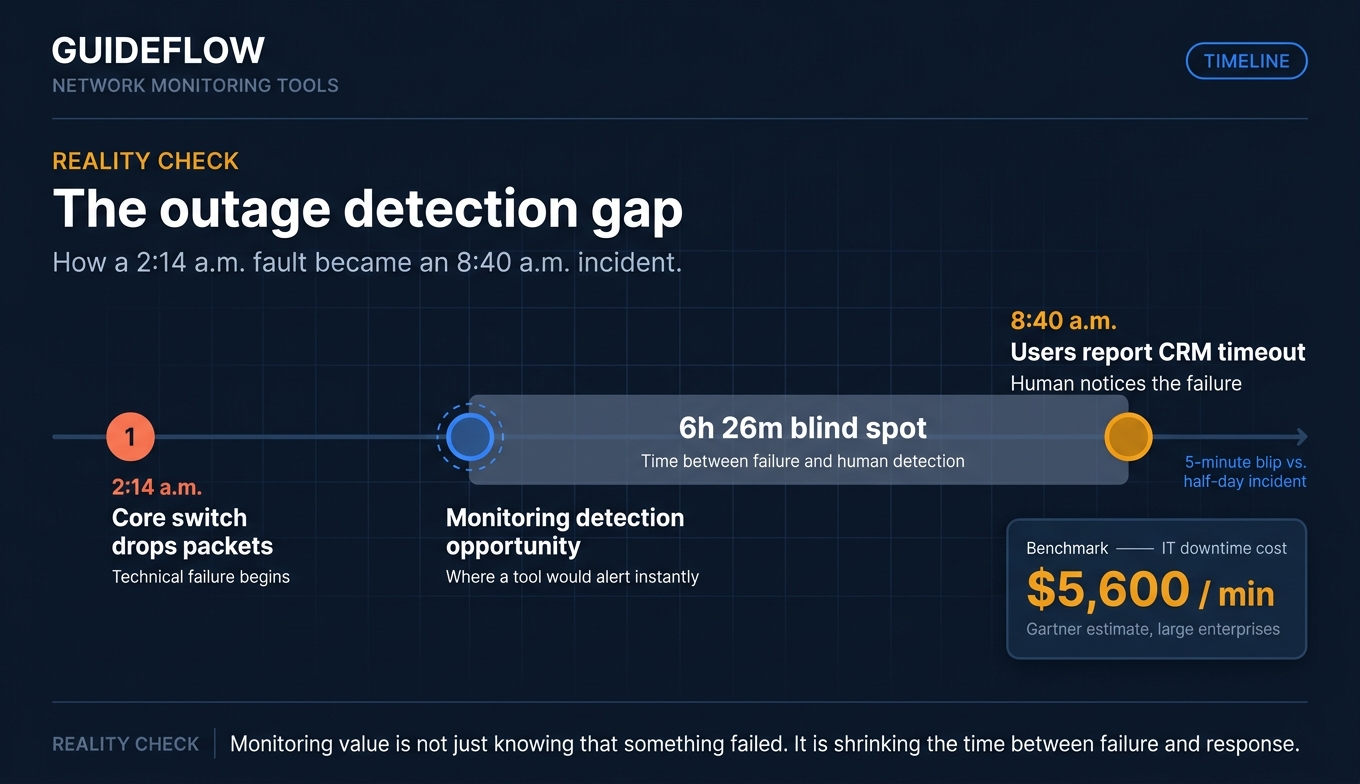
A core switch starts dropping packets at 2:14 a.m. Nobody knows until 8:40 a.m., when sales reps flood the help desk because the CRM keeps timing out. By then, the morning is already lost. That gap, between when a problem starts and when a human notices, is exactly what network monitoring software exists to close.
The cost of that gap is real. According to a widely cited Gartner estimate of IT downtime cost, IT downtime runs large enterprises around $5,600 per minute, roughly $300,000 per hour. Most teams never see a bill that clean, but every stalled checkout, dropped call, and frozen dashboard adds up. The point of network monitoring tools is simple: catch the failure on a screen before an angry user catches it for you.
The trouble is choosing one. The category spans free open-source engines you self-host, sensor-based packages built for Windows shops, and cloud-native observability platforms that bill by usage. Some are built for a solo sysadmin running a 40-device office. Others assume a NOC team watching thousands of nodes across on-prem and cloud. Pick the wrong fit and you either drown in setup or pay for scale you will never touch.
This guide ranks 11 network monitoring solutions, free and paid, and tells you which one fits which environment. You will see protocol support, deployment model, verified pricing, and the trade-offs that matter before you commit.
What's inside
This guide is for system administrators, network engineers, IT managers, DevOps and SRE teams, NOC staff, and MSP technicians shortlisting network performance monitoring tools. It covers solo Windows shops through enterprise hybrid estates.
We picked these 11 tools on four criteria:
- Environment fit: Windows, Linux, cloud, or hybrid, and agent versus agentless collection.
- Monitoring scope and protocols: SNMP, WMI, NetFlow, sFlow, J-Flow, and cloud APIs.
- Alerting, dashboards, and reporting: noise control, escalation, and SLA proof.
- Pricing, including free tiers: what $0 actually gets you versus paid SaaS.
Pricing and ratings reflect verified vendor pages and G2 listings at the time of writing.
TL;DR
Short on time? Here are the decision shortcuts.
- Best free and open-source: Zabbix, powerful enterprise monitoring with no license fees.
- Best for SMB and easy setup: Paessler PRTG, sensor-based with autodiscovery and a free 100-sensor tier.
- Best for cloud-native and full observability: Datadog, unified network, server, app, and container monitoring.
- Best for MSPs and cloud-managed networks: Auvik, automated mapping built for multi-tenant teams.
- Best enterprise NPM: SolarWinds Network Performance Monitor, deep topology and NetPath analysis.
- Best lightweight metrics stack: Prometheus and Grafana, open-source collection plus visualization for DevOps.
Free tools win on cost and control. Paid SaaS wins on time-to-value. The rest of this guide shows where each line falls.
What is network monitoring software
Network monitoring software continuously tracks the availability, performance, and traffic of network devices and connections, alerting teams to issues before they cause downtime. It polls switches, routers, firewalls, servers, and links, then surfaces health on dashboards and fires alerts when something breaks or degrades.
A network monitoring tool sits between your infrastructure and your team. It asks devices how they are doing, records the answers over time, and tells someone when an answer looks wrong. That is the whole job, done at scale, around the clock.
Core capabilities
Most network monitoring solutions share the same building blocks:
- Device discovery: automatically find and inventory devices on the network.
- Performance monitoring: track CPU, memory, interface utilization, latency, and packet loss.
- Traffic analysis: see which applications and hosts consume bandwidth.
- Dashboards: real-time visual status across sites and device groups.
- Alerting: threshold and anomaly-based notifications via email, SMS, Slack, or webhook.
- Reporting: SLA, availability, and capacity reports for stakeholders.
- Topology and network mapping: visual maps of how devices connect.
How monitoring data is collected
Tools gather data through several protocols. Knowing them helps you match a tool to your gear.
- SNMP protocol for network management: the workhorse. Polls devices for counters like interface stats and CPU. Nearly every network device speaks it.
- Windows Management Instrumentation: Windows-native. Pulls deep metrics from Windows servers, Event Logs, and services.
- NetFlow, sFlow, J-Flow: NetFlow flow export technology from Cisco, multi-vendor, and Juniper gear. They report who talked to whom, how much, and over which port, for traffic analysis.
- ICMP ping protocol fundamentals: simple ping checks for reachability and latency.
- REST APIs: how modern tools pull metrics from cloud providers and SaaS platforms.
- Agent-based versus agentless: agents are small programs installed on a host for deep, local metrics. Agentless collection polls devices remotely via SNMP, WMI, or APIs, with nothing to install on the target.
When to use a network monitoring tool
If you run any network that people depend on, you need monitoring. These are the moments it pays off.
Catch outages before users report them
Proactive uptime is the headline use case. Continuous polling and alerting mean a downed link, failed interface, or saturated firewall pages you immediately. You fix it during a quiet window instead of explaining a multi-hour outage to leadership. For NOC and on-call teams, this is the difference between a 5-minute blip and a half-day incident.
Diagnose performance bottlenecks across hybrid and cloud
Slowness is harder than outright failure. A network monitoring tool with traffic analysis and infrastructure monitoring shows whether the problem is a saturated WAN link, a chatty backup job, or a struggling cloud instance. Tools that cover server monitoring and cloud APIs alongside the network give you one place to trace a slow app across on-prem and cloud, instead of guessing.
Prove SLAs and capacity-plan with reporting
Monitoring is also a record. Availability and performance reports prove you hit SLA targets and back up renewal conversations with data. Baselines and trend reports show when a link or device is heading toward saturation, so you upgrade on a plan, not in a panic. Enterprise network monitoring lives or dies on this reporting layer.
How we chose these network monitoring tools
We evaluated each tool on environment fit across Windows, Linux, cloud, and hybrid, plus agent and agentless options. We checked monitoring scope and protocol support, including SNMP, WMI, NetFlow, and multi-vendor device coverage. We weighed alerting, dashboards, and reporting depth, then looked at pricing and free-tier availability. Finally, we considered scalability from a single SMB office to enterprise estates with thousands of nodes. Pricing and G2 ratings were verified against live vendor pricing pages and G2 listings at the time of writing. Where a vendor gates pricing behind a quote, we say so plainly rather than guess.
Best network monitoring tools for 2026 compared
The table below summarizes all 11 network monitoring software options at a glance. Use it to spot the obvious fits, then read the full sections for protocols, deployment, and trade-offs.
| # | Product | Intent | Key use case | Pricing | G2 rating |
|---|---|---|---|---|---|
| 1 | Zabbix | Free open-source at scale | Enterprise-grade self-hosted monitoring | Software free; support from $325/mo | 4.4/5 |
| 2 | Paessler PRTG | SMB and Windows-friendly | Sensor-based all-in-one monitoring | Free up to 100 sensors; paid from $200/mo | 4.7/5 |
| 3 | Datadog | Cloud-native observability | Full-stack network, server, app, container | From $15 per host/mo | 4.4/5 |
| 4 | SolarWinds NPM | Enterprise NPM | Deep topology and path analysis | From $2,829 | Not listed |
| 5 | Progress WhatsUp Gold | Mid-market network-first | Unified device and traffic monitoring | From $1,229/yr for 50 devices | 4.5/5 |
| 6 | ManageEngine OpManager | Cost-conscious IT teams | Multi-vendor device monitoring | Free edition; paid from $95 | 4.5/5 |
| 7 | Auvik | MSPs and distributed networks | Cloud-managed mapping and visibility | Quote-based | 4.5/5 |
| 8 | LogicMonitor | Enterprise hybrid observability | Agentless AIOps monitoring | From $16 per hybrid unit/mo | 4.5/5 |
| 9 | Nagios | Open-source foundation | Extensible monitoring, free or commercial | Core free; XI from $2,595 | 4.5/5 |
| 10 | Checkmk | Flexible hybrid deployment | Network, server, cloud, container | Community free; Pro from $275/mo | 4.7/5 |
| 11 | Prometheus + Grafana | DevOps metrics stack | Cloud-native metrics and dashboards | Open-source, free | 4.5/5 |
The 11 best network monitoring tools for 2026
Below, each tool gets an overview, the ideal user, key strengths, the trade-off behind choosing it, and verified pricing.
1. Zabbix
Zabbix is an open-source monitoring and observability platform for infrastructure, networks, applications, services, cloud environments, and more. The software itself is free to download, deploy, and use with no license fees, device limits, or feature gates. It uses agents, templates, and triggers to monitor at scale, and it is commonly deployed on Linux. For teams with in-house skills, it delivers enterprise capability without enterprise licensing.
Best for: organizations that want powerful, self-hosted enterprise monitoring across infrastructure, networks, applications, cloud, and distributed environments without paying for licenses.
Key strengths
- No license fees: full monitoring with no device caps or paywalled features.
- Smart problem detection: anomaly detection, trend prediction, root cause analysis, and alerting.
- Rich visualization: dashboards, graphs, geo-maps, infrastructure maps, SLA monitoring, and scheduled reports.
Why choose Zabbix: Zabbix rewards teams that have the Linux and configuration skills to run it. The trade-off is hands-on setup in exchange for deep control and zero licensing. If you have the expertise and want capability that scales without per-device costs, few tools match it.
Zabbix pricing: The Zabbix software is free and open-source. Paid commercial subscriptions add support SLAs and operational assurance: Silver starts at $325 per month billed annually, Gold from $825 per month billed annually, and Platinum, Enterprise, and Global are custom priced.
2. Paessler PRTG
Paessler PRTG is network monitoring software for monitoring IT, OT, and IoT infrastructures on premises or in the cloud. It uses a sensor-based model, where each monitored aspect of a device is a sensor, and includes autodiscovery to inventory your network fast. PRTG runs on Windows as its primary server platform, which makes it a natural fit for Windows-heavy shops. A freeware edition covers up to 100 sensors at no charge.
Best for: small and medium IT teams needing on-premises, sensor-based monitoring across network devices, servers, applications, OT, and IoT environments.
Key strengths
- Live maps and dashboards: real-time status across your whole environment at a glance.
- Pre-configured sensors: ready-made and customizable sensors for fast infrastructure health checks.
- Flexible alerting: customizable alerts, notifications, and reporting out of the box.
Why choose Paessler PRTG: PRTG trades open-ended scale for speed and simplicity. Autodiscovery and pre-built sensors mean you go from install to monitoring in an afternoon. For an SMB or Windows team that wants one tool covering everything without deep configuration, it is hard to beat. Teams onboarding new admins to these dashboards often pair them with interactive product walkthroughs to flatten the learning curve.
Paessler PRTG pricing: PRTG is sensor-based. There is a free 30-day trial and a freeware edition free of charge for up to 100 sensors. Paid subscriptions start at PRTG 500 for $200 per month paid annually (up to 500 sensors), then PRTG 1000 at $358, PRTG 2500 at $742, PRTG 5000 at $1,300, and PRTG 10000 at $1,642 per month paid annually. Prices are net, business customers only.
3. Datadog
Datadog is an integrated platform for monitoring, observability, security, digital experience, and more. It delivers cloud-native, full-stack observability that spans infrastructure, applications, logs, networks, and containers in one place. For cloud-first teams, it correlates a network issue with the app and host it affects, instead of forcing you to jump between tools.
Best for: engineering, IT operations, and security teams that need unified observability across cloud-scale infrastructure, applications, logs, and security signals.
Key strengths
- Infrastructure monitoring: track hosts, containers, and cloud resources at scale.
- Application performance monitoring: trace requests across services to find slow paths.
- Log management: ingest, search, and correlate logs alongside metrics.
Why choose Datadog: Datadog earns its cost when your stack is cloud-native and sprawling. The usage-based model means cost scales with footprint, so it suits teams that value one unified pane over self-hosting. If you run Kubernetes, multi-cloud, and microservices, the correlation across layers is the payoff.
Datadog pricing: Datadog uses usage-based pricing. Infrastructure Pro starts at $15 per host per month billed annually, Infrastructure Enterprise at $23, DevSecOps Pro at $22, and DevSecOps Enterprise at $34 per host per month billed annually. Month-to-month and on-demand rates are higher, and a free trial is available.
4. SolarWinds Network Performance Monitor
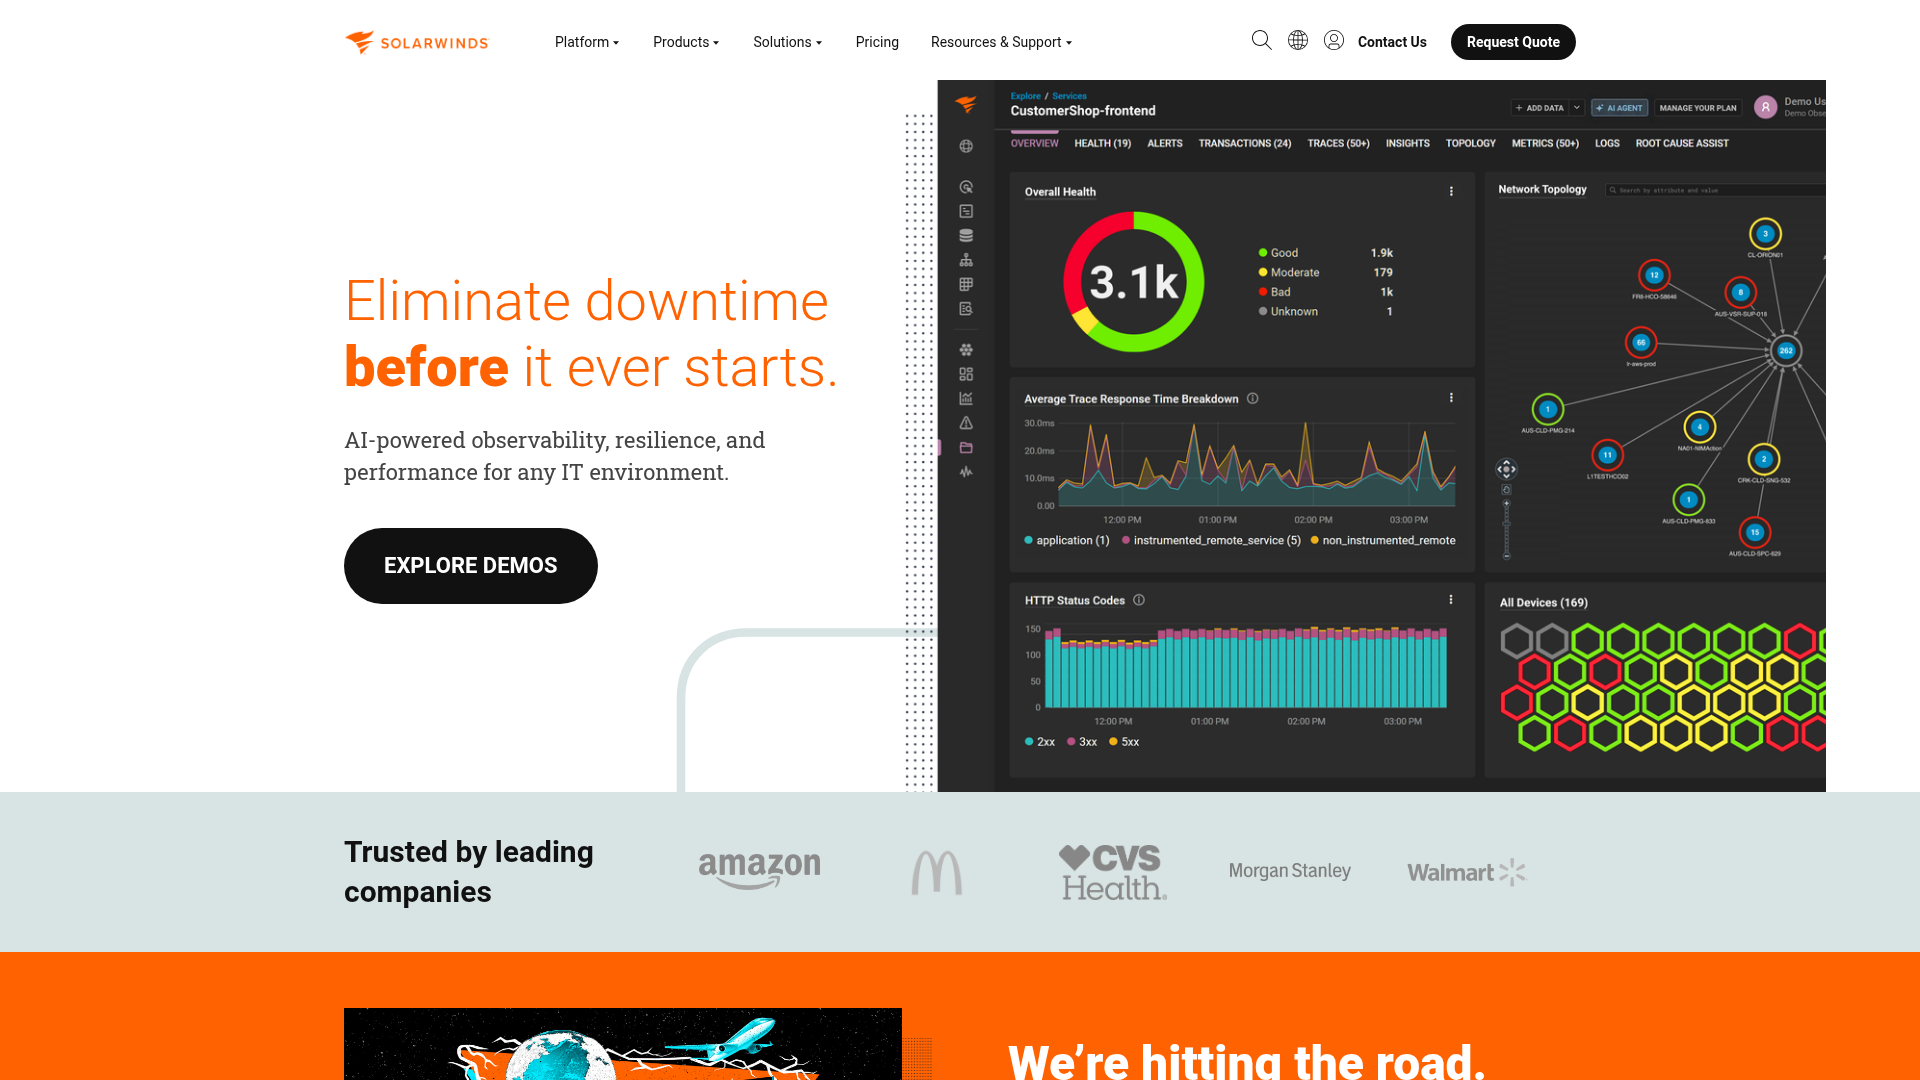
SolarWinds Network Performance Monitor is network monitoring software for detecting, diagnosing, and resolving network performance issues across hybrid IT environments. It is a long-standing enterprise NPM, known for deep topology mapping and its NetPath feature, which visualizes the hop-by-hop path between two points to pinpoint where latency creeps in. It leans heavily on SNMP, ICMP, and WMI for discovery and polling.
Best for: IT teams managing multi-vendor on-premises or hybrid networks that need discovery, mapping, alerting, and troubleshooting.
Key strengths
- Automatic discovery: find network paths and nodes via ICMP, SNMP, and WMI.
- NetPath visualization: node-by-node mapping for fast path troubleshooting.
- Configurable dashboards: charts, reports, and advanced alerting tuned to your environment.
Why choose SolarWinds NPM: SolarWinds NPM fits enterprise network teams that need depth over simplicity. It is a serious, on-prem-first platform with a license cost to match. If your priority is granular performance visibility and path analysis across a large multi-vendor network, it delivers.
SolarWinds NPM pricing: SolarWinds lists Network Performance Monitor starting at $2,829. The license metric and billing period are not specified on the public listing, and a fully functional 30-day trial is available. Get a custom quote for exact terms.
5. Progress WhatsUp Gold
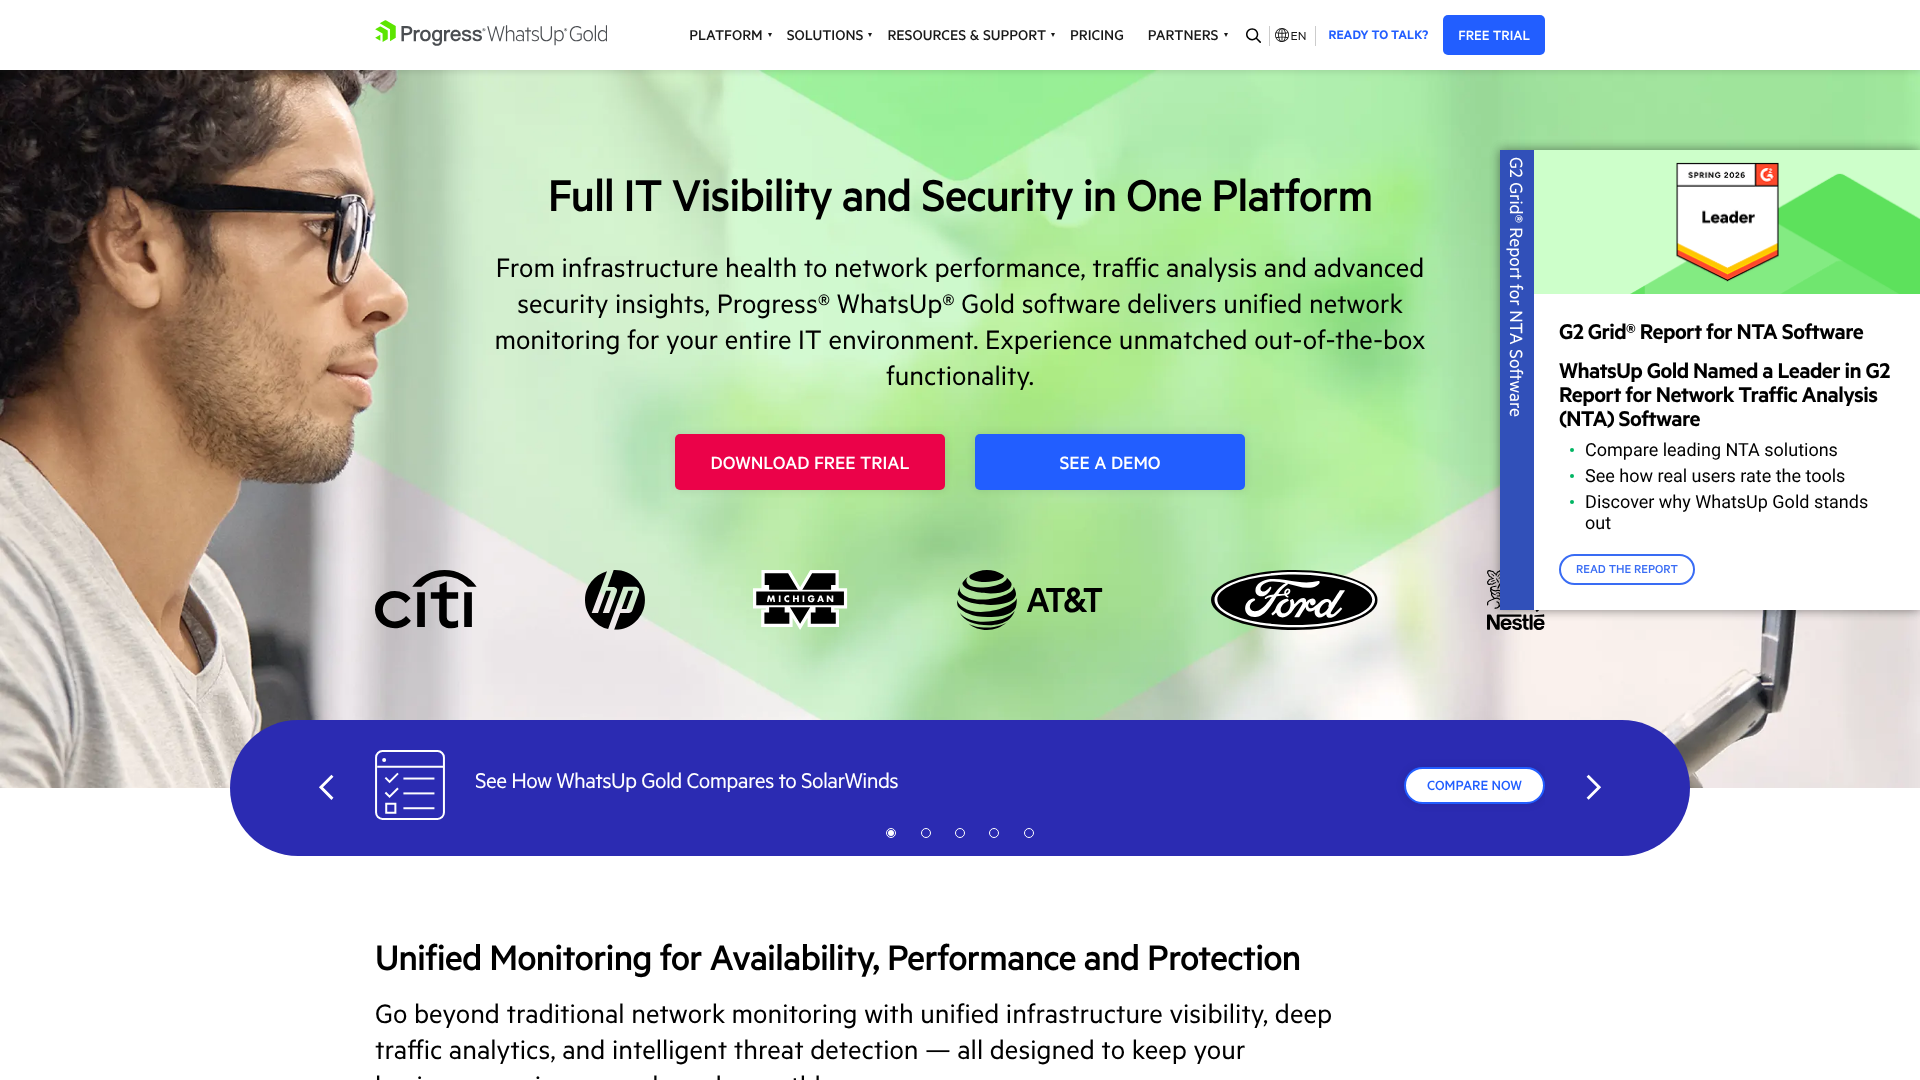
Progress WhatsUp Gold delivers unified network monitoring for IT environments, covering infrastructure health, network performance, traffic analysis, and security insights. It handles device and uptime monitoring, network mapping, and alerting, with modular add-ons for application monitoring, traffic analysis, and configuration management. The modular licensing lets mid-market teams start network-first and add capabilities as needs grow.
Best for: IT teams needing unified monitoring for network devices, servers, applications, virtual infrastructure, traffic, logs, and network security signals.
Key strengths
- Network mapping and monitoring: automatic discovery and visual maps of your estate.
- Broad coverage: virtualization, wireless, log management, and configuration management.
- Traffic analysis: NetFlow and IPFIX monitoring for troubleshooting, forensics, and capacity planning.
Why choose Progress WhatsUp Gold: WhatsUp Gold suits mid-market IT teams that want a straightforward, network-first tool without enterprise complexity. Modular licensing means you pay for the layers you use. If you want clean device monitoring with room to expand into traffic and config management, it fits.
Progress WhatsUp Gold pricing: Plans are licensed by device. Business starts at $1,229 for 50 devices per year, Enterprise at $2,049, and Enterprise Plus at $3,469 for 50 devices per year. Enterprise Scale is contact-sales. A free trial is available.
6. ManageEngine OpManager

ManageEngine OpManager is network monitoring software for monitoring network devices, servers, applications, availability, performance, alerts, dashboards, and fault management. It supports multi-vendor device monitoring across Cisco, Juniper, HP, and more, with affordable tiers that scale from small offices to larger estates. It covers physical, virtual, and hybrid environments, making it a practical broad-coverage choice for cost-conscious teams.
Best for: IT teams that need on-premises network, server, infrastructure, alerting, and fault monitoring across multi-vendor environments.
Key strengths
- Multi-vendor performance monitoring: physical and virtual infrastructure, servers, hardware, and interfaces.
- Severity-based alerting: notifications via SMS, email, tickets, Slack, Telegram, web alarms, and webhooks.
- Rich visualization: dashboards, business views, rack views, floor views, and 3D datacenter views.
Why choose ManageEngine OpManager: OpManager fits teams that want broad device coverage at a low entry price. The trade-off is an on-prem-first model rather than cloud-native observability. If you need to watch a multi-vendor network without a five-figure license, it is a strong, affordable pick.
ManageEngine OpManager pricing: OpManager offers a free edition and a free trial. Paid Standard Edition starts at $95 for 10 devices with annual billing, Professional Edition at $145 for 10 devices, and Enterprise Edition at $4,595 for 250 devices. Both perpetual and subscription plans are available.
7. Auvik
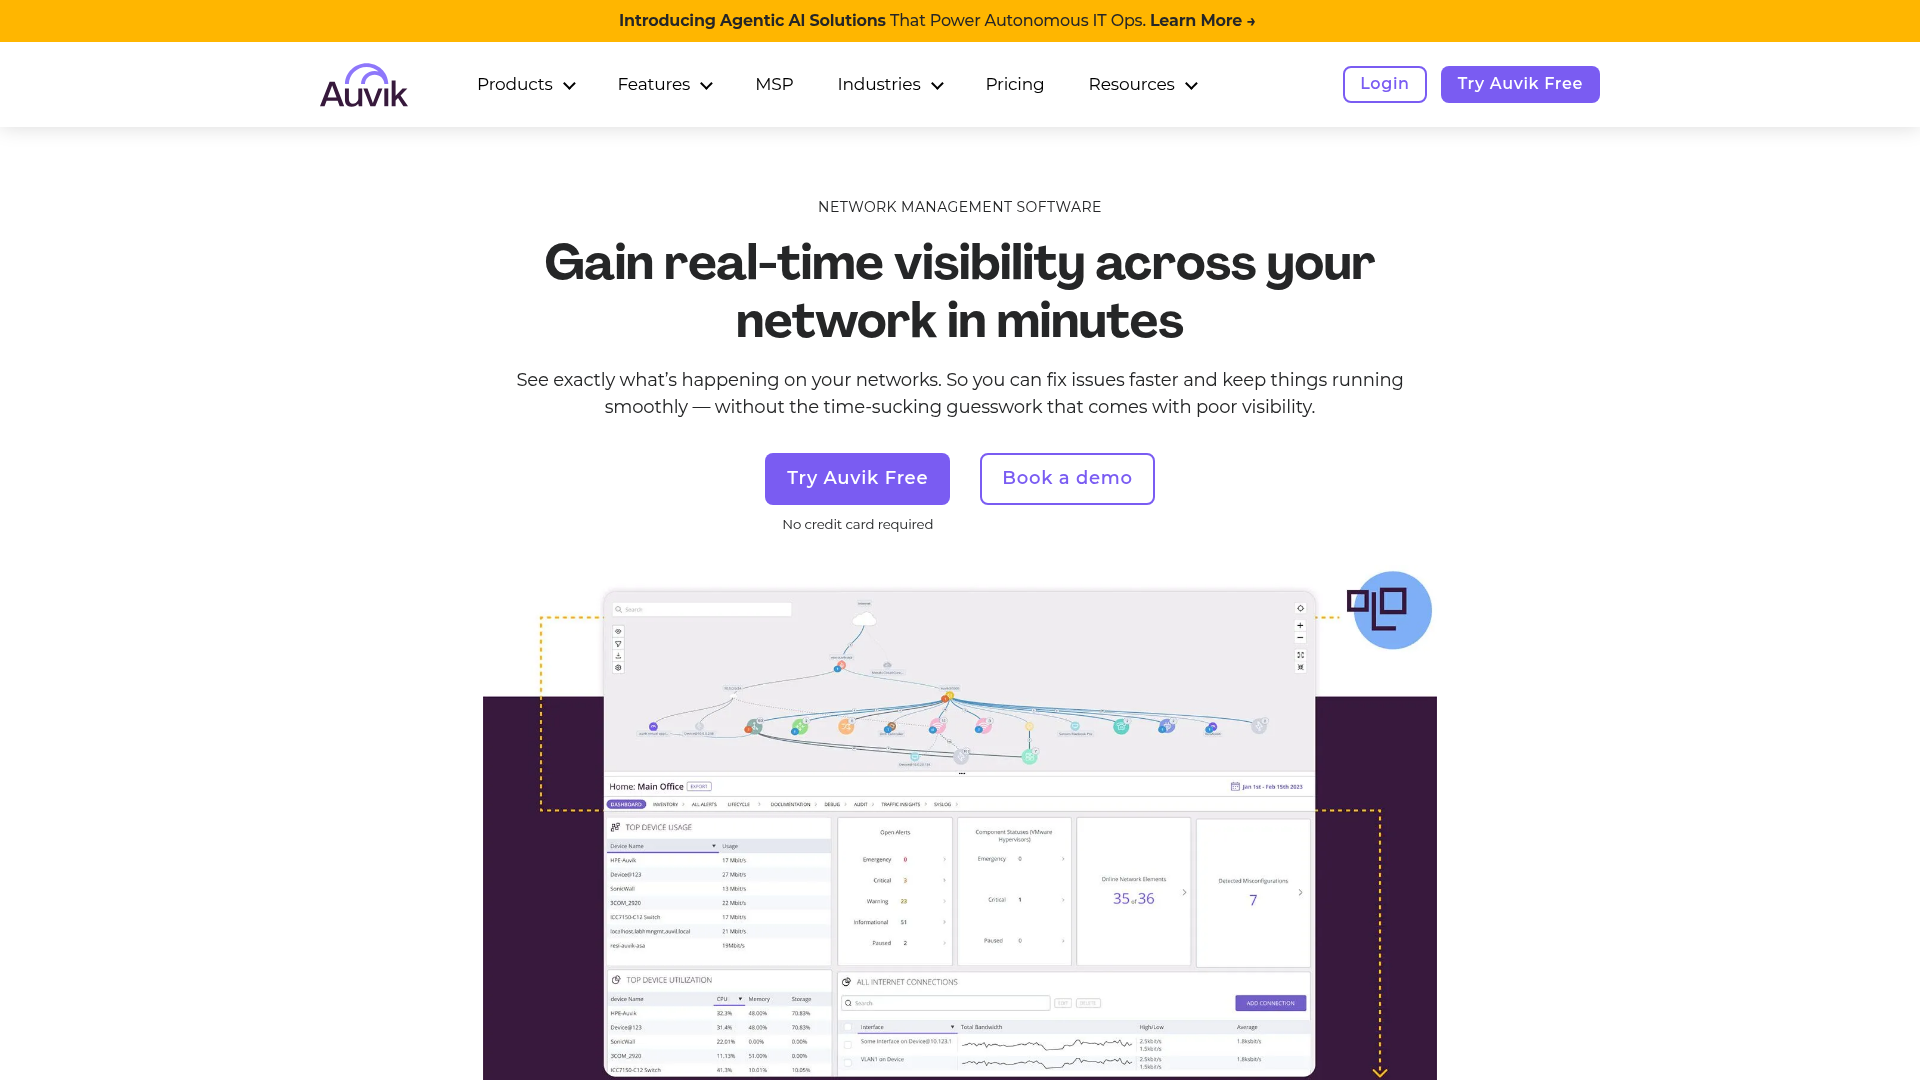
Auvik is a cloud-based IT and network management platform for real-time network visibility, monitoring, mapping, alerting, and troubleshooting. It automates network discovery and topology mapping, backs up device configs, and runs from the cloud, which makes it a favorite among MSPs managing many client networks. End devices are monitored agentlessly via a lightweight collector you deploy on site.
Best for: IT teams and MSPs that need cloud-based network monitoring, mapping, alerting, and troubleshooting across managed networks.
Key strengths
- Automated topology mapping: real-time maps that update as the network changes.
- Configuration management: automatic config backup and change tracking.
- Inventory and documentation: automated network inventory so nothing goes undocumented.
Why choose Auvik: Auvik fits MSPs and distributed teams that need cloud-managed visibility across many sites without standing up on-prem servers. The multi-tenant design and automated mapping cut the manual documentation that eats MSP hours. MSPs onboarding new client accounts can speed up training with self-service product tours that show technicians the platform without a live session. If you manage networks you do not physically sit next to, this is built for you.
Auvik pricing: Auvik's pricing page does not display public figures or named tiers. Pricing is based on the number of managed devices, and you submit a form for a quote. A 14-day free trial is available with no credit card required.
8. LogicMonitor
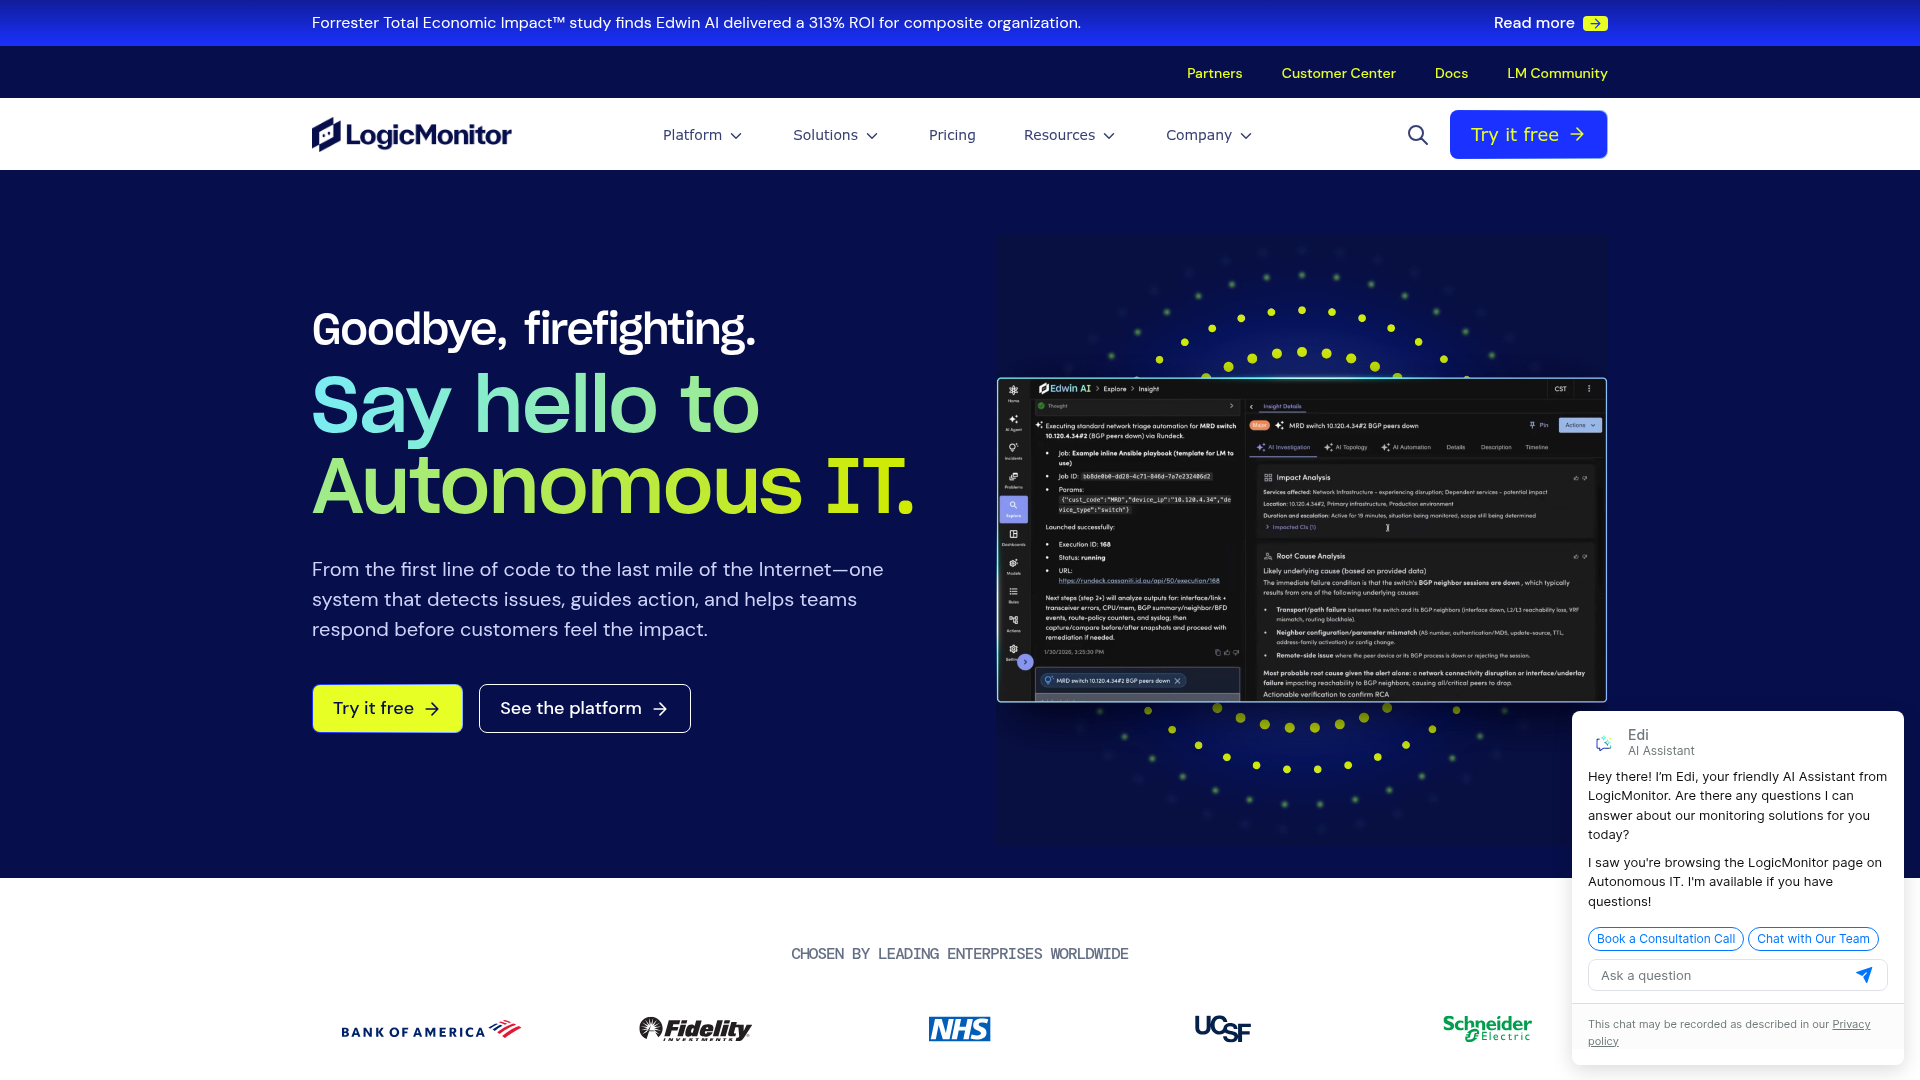
LogicMonitor provides an AI-powered hybrid observability platform for unified visibility across infrastructure, applications, cloud, logs, and digital experiences. It is SaaS-based and agentless at the device level, using collectors plus SNMP, WMI, and cloud APIs to pull data. Its AIOps for IT operations layer, branded Edwin AI, helps reduce alert noise and surface root causes automatically across hybrid estates.
Best for: enterprise IT, ITOps, CloudOps, and MSP teams that need unified hybrid infrastructure observability with AI-assisted incident reduction and automation.
Key strengths
- Hybrid monitoring: unified view across on-prem and cloud resources.
- Automated discovery: infrastructure discovery with automatic resource classification.
- Deep analytics: dashboards, dynamic thresholds, anomaly detection, dependency mapping, and 3,000+ integrations.
Why choose LogicMonitor: LogicMonitor fits enterprises that want automated, agentless hybrid monitoring without managing the monitoring stack themselves. The AIOps layer pays off when alert volume is high enough to drown a team. If you value noise reduction and automated correlation across a large hybrid estate, it earns its place.
LogicMonitor pricing: LogicMonitor offers three packages with USD starting monthly list pricing. Essentials starts at $16 per hybrid unit, Advanced at $27 per hybrid unit, and Signature with Edwin AI at $53 per hybrid unit. Actual pricing varies by volume and contract terms, and any plan can be tried free for 15 days.
9. Nagios
Nagios provides open-source and commercial IT infrastructure monitoring for servers, networks, applications, services, websites, and custom metrics. Nagios Core is the free, GPL-licensed engine with a vast plugin ecosystem that lets you monitor almost anything with the right check script. Nagios XI is the commercial product, adding a web GUI, configuration wizards, and supported features on top of the Core foundation.
Best for: IT teams that need extensible infrastructure, network, server, service, and application monitoring with alerts and customizable checks.
Key strengths
- Broad monitoring: network, server, host, application, and service checks.
- Flexible alerting: notifications with escalation paths and custom scripts.
- Plugin extensibility: a huge library of community and custom checks and integrations.
Why choose Nagios: Nagios fits teams that want a proven, extensible open-source foundation, or its supported commercial version. Core asks for hands-on configuration in exchange for total flexibility. XI trades some of that for a GUI and vendor support. Either way, it is a battle-tested veteran with decades of plugins behind it.
Nagios pricing: Nagios Core is 100% free under GPL v2 software license. Nagios XI offers a free edition limited to 7 nodes or 100 services. Paid Nagios XI Standard starts at $2,595 for a 100-node license, and Enterprise at $4,690 for a 100-node license. Sitewide licensing is contact-sales.
10. Checkmk
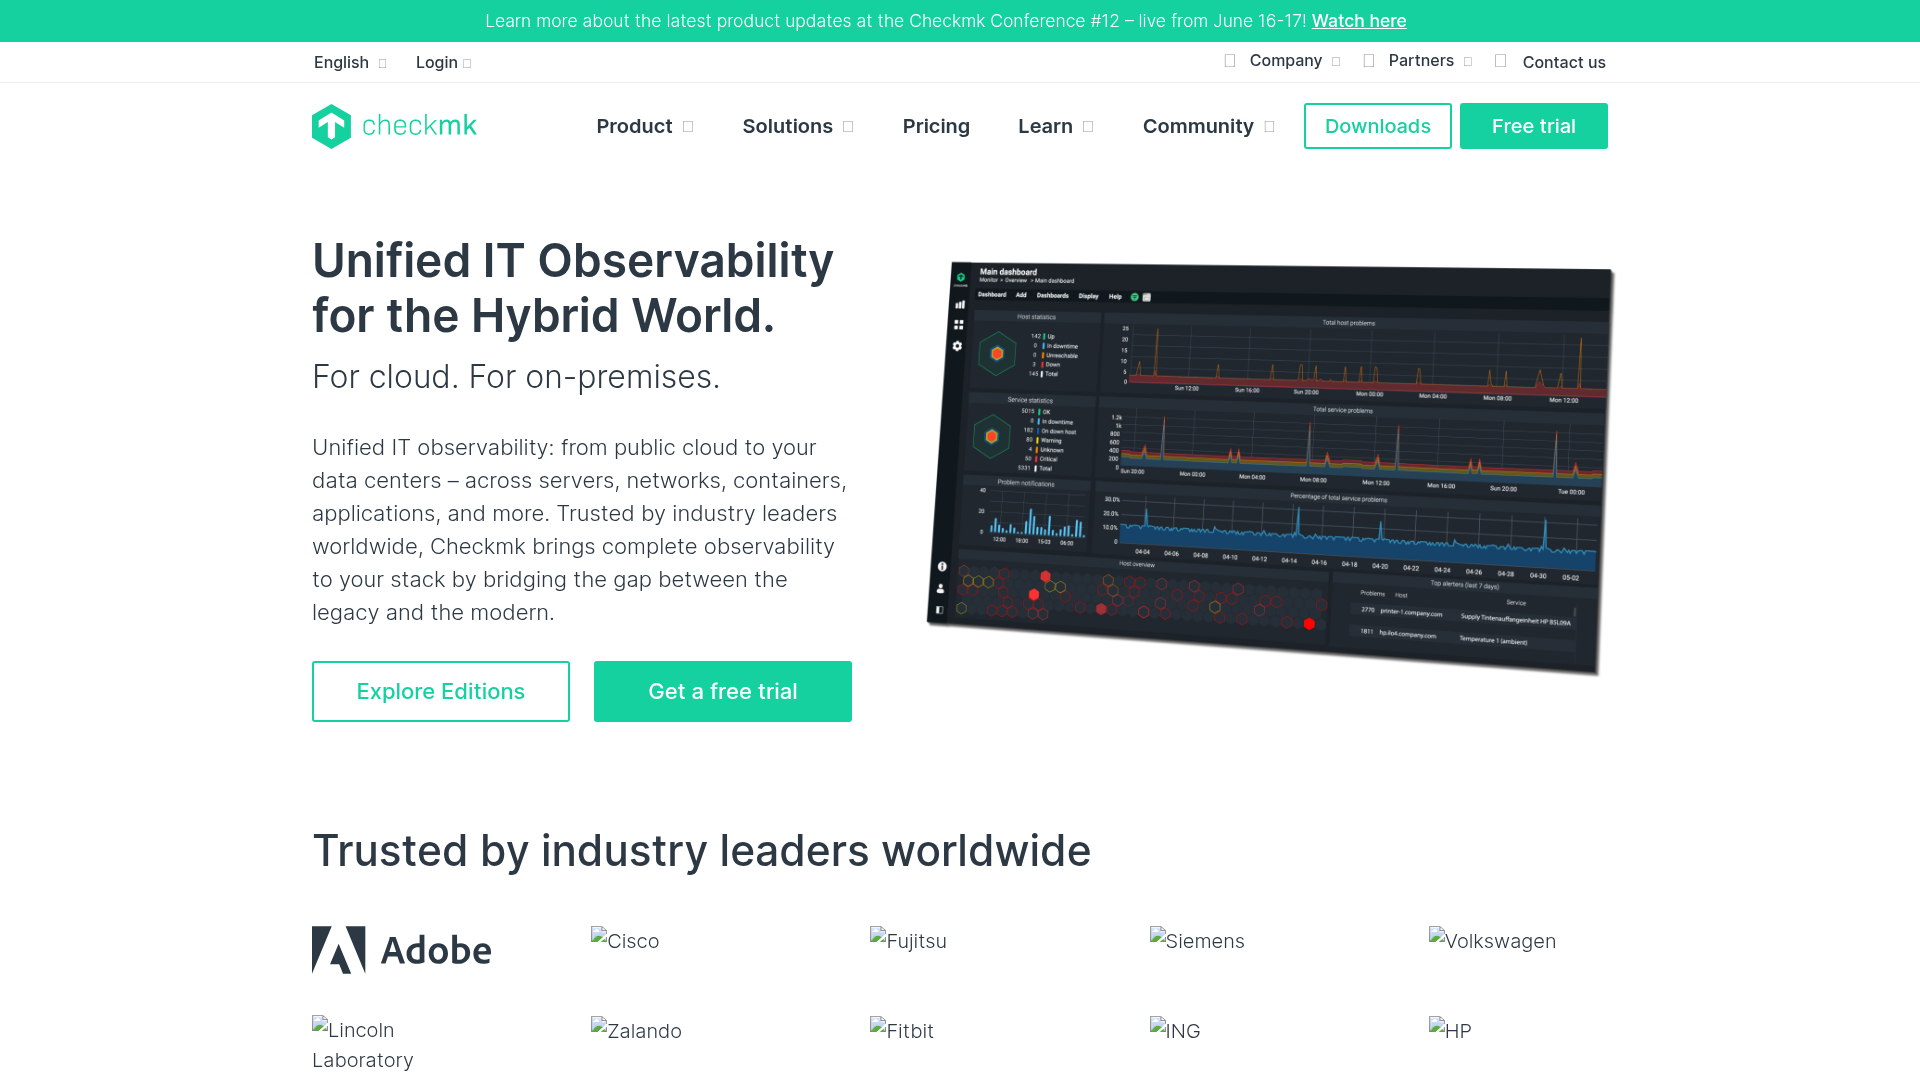
Checkmk is an IT monitoring and full-stack observability platform for hybrid, cloud-native, and self-hosted infrastructures. It covers networks, servers, logs, containers, Kubernetes, and cloud, using both agent-based and agentless collection. A free Community edition makes it a strong starting point, and paid editions add scale, automation, and a SaaS option for teams that outgrow self-hosting.
Best for: IT operations teams that need scalable infrastructure monitoring and observability across hybrid, cloud, Kubernetes, network, and server environments.
Key strengths
- Full-stack coverage: servers, networks, logs, containers, Kubernetes, OpenShift, and cloud.
- Smart automation: auto-discovery of hosts and services, REST API, automated agent updates, and distributed monitoring.
- Deep integrations: dashboards, alerting, reporting, inventory, and 2,000+ supported integrations.
Why choose Checkmk: Checkmk fits teams that want flexible deployment with a genuinely capable free edition. You can start on Community at no cost, then move to Pro, Ultimate, or the SaaS Cloud AI plan as you scale. If you want one tool spanning network, server, cloud, and containers without locking into a single deployment model, it delivers.
Checkmk pricing: The Community edition is free open-source monitoring for small infrastructures. Pro starts at $275 per month billed annually, adding scalable data-center monitoring, automation, analytics, and support. Ultimate is $400 per month billed annually with full-stack observability and advanced cloud and security capabilities. Cloud AI is the SaaS option at $290.
11. Prometheus + Grafana
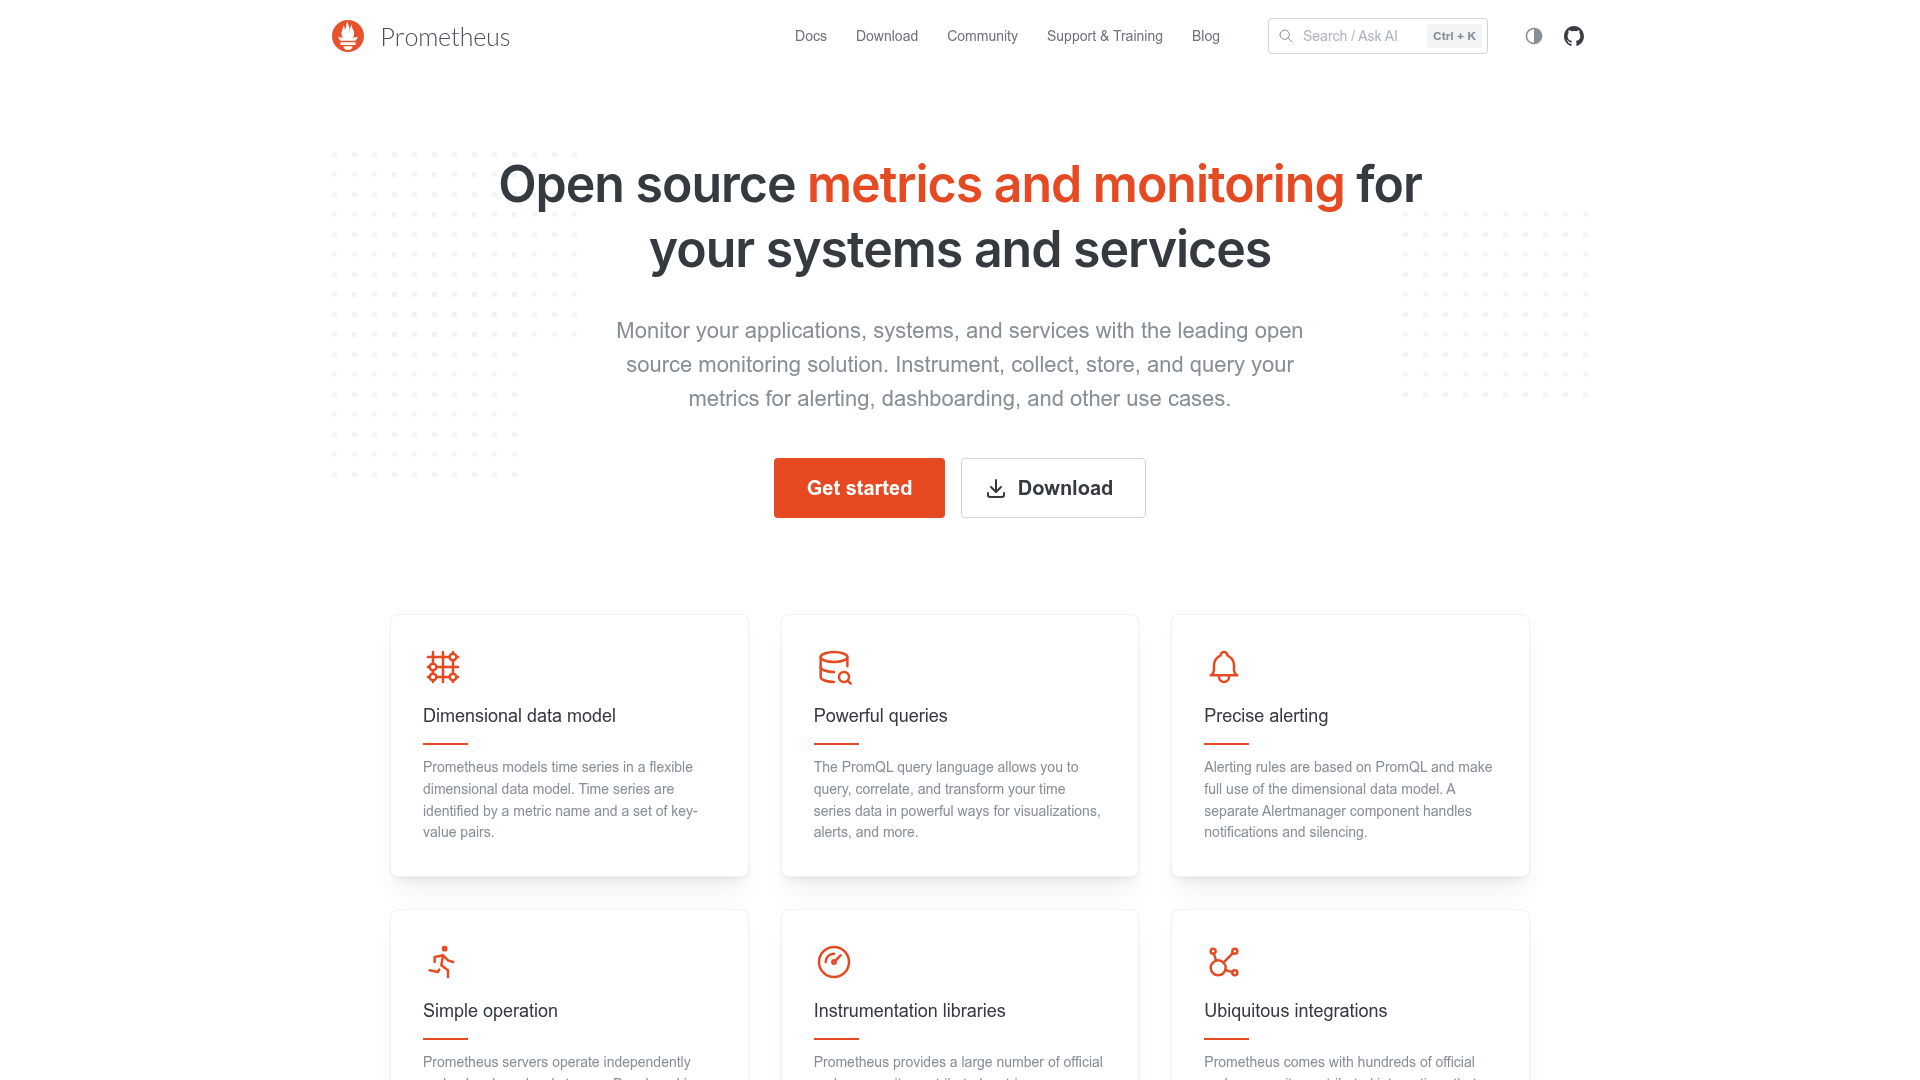
Prometheus is an open-source metrics monitoring and alerting toolkit for applications, systems, and services. Paired with Grafana, the open-source visualization layer, it forms the default metrics stack for cloud-native and DevOps teams. Prometheus scrapes time-series metrics and stores them; Grafana turns them into dashboards. Both are free and Apache 2.0 open-source license licensed.
Best for: teams needing open-source metrics collection, monitoring, querying, and alerting for cloud-native systems.
Key strengths
- Dimensional data model: time-series metrics labeled for flexible querying.
- PromQL: PromQL query language documentation a powerful query language for slicing and transforming metrics.
- Alerting rules: Alertmanager handles notifications, grouping, and silencing.
Why choose Prometheus and Grafana: This stack fits DevOps and SRE teams building metrics-first monitoring for Kubernetes container orchestration and microservices. It is not a turnkey network NMS with SNMP discovery out of the box; it shines on application and infrastructure metrics. If your team lives in containers and wants an open, composable stack, this is the standard.
Prometheus + Grafana pricing: Prometheus is 100% open-source and free under Apache 2.0, with no paid tiers on the project itself. Grafana is similarly open-source and free to self-host. Managed cloud versions of both exist from their respective vendors for teams that prefer not to run their own.
How to choose the right network monitoring tool
The right pick depends on your environment, your gear, and your team. Run through this checklist before you commit.
Match the tool to your environment
Map the tool to where your infrastructure lives. Windows-heavy shops lean toward WMI-strong tools like PRTG. Linux and open-source teams fit Zabbix, Nagios, or Prometheus. Cloud and hybrid estates want Datadog, LogicMonitor, or Checkmk. Decide whether agent-based depth or agentless simplicity suits your operational model.
Check protocol and device coverage
Confirm the tool speaks the protocols your devices use. SNMP is table stakes for network gear. WMI matters for Windows servers. NetFlow, sFlow, and J-Flow drive traffic analysis. If you run mixed-vendor hardware, verify multi-vendor support before buying, not after.
Evaluate alerting, dashboards, and reporting
Good monitoring is useless if alerts drown your team. Look for threshold and anomaly-based alerting, escalation paths, and noise control. Check that dashboards are readable at a glance and that SLA and availability reporting matches what stakeholders ask for. If you also evaluate dashboarding more broadly, our roundup of the best product analytics software covers complementary tools worth a look.
Weigh free versus paid and total cost
Free and open-source tools cost $0 in license but real hours in setup and upkeep. Paid tools charge by sensor, device, host, or usage. Model your actual node count against each pricing model, and factor staff time into total cost, not just the invoice.
Plan for scale and integrations
Pick for where you will be, not just where you are. Confirm the tool scales from your current node count toward your roadmap. Check integrations with ticketing, CMDB, ITSM, cloud APIs, and chat, so monitoring plugs into your existing workflow instead of bolting on beside it.
Free vs paid network monitoring tools
The free-versus-paid decision comes down to three things: team size, in-house expertise, and how fast you need results.
Free and open-source tools win when you have the skills and the time. Zabbix, Nagios Core, Prometheus with Grafana, the PRTG free tier, and Checkmk Raw all deliver serious capability at no license cost. The catch is that you trade money for hours: setup, tuning, and maintenance fall on your team. For a sysadmin who knows Linux and wants total control, that trade is often worth it.
Paid and SaaS tools win when time-to-value and low overhead matter more than license cost. Datadog, SolarWinds, Auvik, and LogicMonitor get you monitoring fast, with vendor support and automated features doing the heavy lifting. For lean teams, MSPs, or enterprises that would rather not staff a monitoring platform, the cost buys back time. The fastest-onboarding paid tools tend to invest heavily in user onboarding software and guided setup, which is a big part of their time-to-value advantage.
Here is the quick split:
| Choose free and open-source when | Choose paid and SaaS when |
|---|---|
| You have in-house Linux and config skills | You need fast time-to-value |
| Budget is tight and time is available | Staff time is scarcer than budget |
| You want full control and no device caps | You want vendor support and automation |
| Self-hosting fits your model | You prefer a managed, cloud-delivered tool |
Most teams end up with a blend. A free metrics stack for the cloud-native side, a paid tool for the enterprise network. There is no single right answer, only the right fit for your team.
Conclusion
The best network monitoring tool is the one that matches your environment, not the one with the longest feature list. For free and open-source power, Zabbix leads, with Nagios and Prometheus plus Grafana close behind for the right teams. For SMB and Windows shops that want fast setup, Paessler PRTG is the easy call. Cloud-native teams should look at Datadog for unified observability. MSPs and distributed networks fit Auvik. Enterprise network teams get depth from SolarWinds NPM, and large hybrid estates benefit from LogicMonitor's AIOps. Mid-market IT teams find a clean network-first fit in Progress WhatsUp Gold, cost-conscious shops in ManageEngine OpManager, and flexible deployers in Checkmk.
Do not buy on the spec sheet alone. Shortlist 2 or 3 tools that match your environment, start free trials, and test each against your actual network. Watch how discovery handles your gear, how alerts behave under real load, and how the dashboards feel during a live incident. If your team is evaluating software more broadly, our best tools roundups and guide to the best digital adoption platforms can help you round out the stack. The tool that holds up in your environment is the one to pick.
FAQs
For powerful, free monitoring at scale, Zabbix is the standout open-source choice. Nagios Core and the Prometheus and Grafana stack are strong alternatives, and PRTG's free tier covers up to 100 sensors. The trade-off is capability versus setup effort: these tools cost nothing to license but require in-house skills to deploy and maintain.
Agent-based monitoring installs a small program on each device to collect deep, local metrics. Agentless monitoring polls devices remotely using protocols like SNMP, WMI, or REST APIs, with nothing installed on the target. Agents give richer data on servers; agentless is simpler to deploy across network gear and large fleets. Many tools, like Checkmk, support both.
SNMP polls network devices for counters like interface and CPU stats. WMI pulls deep metrics from Windows servers. NetFlow, sFlow, and J-Flow report traffic flows for bandwidth analysis. ICMP runs simple ping checks for reachability and latency, and REST APIs collect metrics from cloud providers and SaaS platforms.
Free and open-source tools like Zabbix, Nagios Core, and Prometheus cost $0 to license when self-hosted, though you pay in setup and labor. SMB tiers from tools like OpManager and PRTG start in the low hundreds. Enterprise and SaaS platforms like Datadog and LogicMonitor use usage-based pricing that scales with your footprint. Costs vary by device, sensor, host, or data volume.
For small businesses, easy-setup options win. Paessler PRTG's free tier and autodiscovery get you monitoring fast, ManageEngine OpManager offers low entry pricing with broad coverage, and Zabbix delivers free power if you have the skills. The key criteria are low overhead, automatic discovery, and affordable scaling as you grow.
Yes. Datadog, LogicMonitor, Auvik, and Checkmk all monitor cloud and hybrid environments. They collect data through agents or lightweight collectors on hosts, through cloud provider APIs for AWS, Azure, and GCP, and through SNMP for networks that span on-prem and cloud. This gives one view across infrastructure that no longer lives in a single location.
Network monitoring focuses on devices, traffic, and connectivity: switches, routers, firewalls, links, and bandwidth. Infrastructure monitoring is broader, covering servers, containers, storage, databases, and applications alongside the network. Many modern platforms do both, which is why the lines blur. Pick based on whether your priority is the network specifically or the full stack.
At minimum, look for device discovery, performance monitoring, and traffic analysis. Add topology and network mapping to see how devices connect, alerting to catch problems early, and dashboards for real-time status. Reporting rounds it out, giving you SLA, availability, and capacity data for stakeholders and planning.