

Your incident queue grows. Your dashboards multiply. Your on-call engineer still gets paged at 2 a.m. about something that should have been caught six hours earlier.
The problem usually is not a lack of data. Most IT operations teams are drowning in metrics. The real gap is context: Knowing which signal matters, where the failure is, and how fast you can route it to the right person. According to Grand View Research (2026), the global application performance monitoring market was valued at $9.7 billion in 2025 and is projected to reach $30 billion by 2033, which tells you how urgently organizations are investing in getting this right.
Monitoring software bridges the distance between a symptom and a root cause. Choose the wrong tool and you add noise. Choose the right one and your team stops reacting and starts preventing.
This guide focuses strictly on IT operations monitoring: Infrastructure, applications, networks, cloud services, and observability. It does not cover employee monitoring or workforce productivity tools.
What's inside
This guide is for IT operations managers, DevOps and SRE teams, infrastructure leads, and presales engineers who need to understand or shortlist monitoring platforms for technical validation.
Tools were chosen based on:
- Coverage across infrastructure, application, network, cloud, and observability monitoring
- Deployment fit (cloud-native, hybrid, on-premises, and open-source options)
- Alert quality, integration depth, and pricing transparency
- G2 ratings and community adoption verified at writing time
Pricing and G2 ratings were verified against each vendor's live pages before publication.
TL;DR
- Best overall for cloud-scale IT operations: Datadog, with unified telemetry across infrastructure, apps, logs, and security
- Best for enterprise observability and AIOps: Dynatrace, for automated root cause analysis across complex environments
- Best for engineering-led observability: New Relic, with usage-based pricing and a generous free tier
- Best open-source option: Zabbix, for teams that want self-hosted control with no license costs
- Best for network-heavy IT teams: Paessler PRTG, with sensor-based coverage across devices and servers
- Best for teams already on Grafana: Grafana Cloud, with a managed stack and a free plan to start
What is monitoring software?
Monitoring software tracks the health, availability, performance, and behavior of IT systems so teams can detect issues, investigate root causes, and respond before users are affected.
This guide covers IT operations monitoring specifically. Employee monitoring software, which tracks worker activity, screenshots, and productivity, is a separate category entirely.
Core subcategories of IT monitoring software include:
- Infrastructure monitoring: Servers, virtual machines, storage, and containers
- Network monitoring: Devices, traffic, bandwidth, and latency
- Application performance monitoring: Traces, errors, response times, and service dependencies
- Cloud monitoring: Managed services, Kubernetes clusters, and hybrid environments
- Log and event monitoring: Log ingestion, anomaly detection, and audit trails
- Alerting and incident response: Threshold rules, deduplication, escalation paths, and suppression
Key capabilities to look for across these categories:
- Metrics collection and retention
- Log ingestion and search
- Distributed tracing
- Service maps and topology views
- Customizable dashboards
- Alert routing and escalation
- Integrations with incident workflows
- Access management and RBAC
When evaluating platforms, map your actual environment first. A network-first IT team and a cloud-native engineering team have fundamentally different needs. The right monitoring tool fits the systems you actually run, not an idealized architecture.
For presales engineers, understanding your buyer's monitoring stack is also a discovery asset. Knowing which platform they use, and how alerts flow, tells you where your product will need to produce telemetry evidence during a POC.
You can also explore our roundup of application performance monitoring tools for a deeper cut on the APM category, and our list of AIOps tools for AI-assisted operations platforms.
When to use monitoring software
Detect outages before customers report them
Monitoring software lets your team catch availability, latency, and error-rate issues before end users notice them. Uptime checks, synthetic monitoring, and alert routing all contribute to this. The goal is to compress the time between a service degrading and an engineer getting actionable context, not just a noisy alert.
Troubleshoot complex cloud and hybrid environments
Distributed systems fail in ways that no single dashboard can predict. When a service degrades across multiple regions or dependencies, you need traces, service maps, and correlated logs to understand what actually happened. Presales teams should pay attention here: Buyers often ask how a product behaves under load or across service boundaries during technical validation.
Reduce alert noise during incident response
More alerts do not produce faster resolution. Strong monitoring software routes, deduplicates, and suppresses noise so the right person sees the right signal at the right time. Alert fatigue is a real operational cost. During any proof of concept, test how alerts behave under failure conditions, not just normal operations.
Monitoring software comparison
The table below gives you a fast starting point. Use it to narrow your shortlist, then verify pricing, G2 ratings, and deployment fit directly with each vendor before purchase. Pricing changes frequently, especially for usage-based platforms where cost scales with host count, log volume, or sensor count.
| # | Product | Best for | Key differentiator | Pricing | G2 rating |
|---|---|---|---|---|---|
| 1 | Datadog | Cloud-scale infrastructure and observability | Broad telemetry across infrastructure, apps, logs, and security | From $15/host/month | 4.4/5 |
| 2 | Dynatrace | Enterprise observability and AIOps | AI-assisted root cause analysis and topology mapping | From $7/host/month | 4.5/5 |
| 3 | New Relic | Engineering-led observability | Full-stack telemetry with a generous free tier | Free; paid from $10/user/month | 4.4/5 |
| 4 | Zabbix | Open-source infrastructure monitoring | Self-hosted monitoring with no license fees | Free (open source); cloud from $50/month | 4.4/5 |
| 5 | Nagios XI | Traditional infrastructure and network monitoring | Mature plugin ecosystem with node-based licensing | From $2,595 (perpetual) | N/A on G2 |
| 6 | Paessler PRTG | Network-heavy IT teams | Sensor-based monitoring for networks, servers, and devices | From $2,399/year | 4.7/5 |
| 7 | ManageEngine OpManager | Mid-market network and infrastructure teams | Network monitoring with discovery and topology views | From $95 (10 devices, annual) | N/A on G2 |
| 8 | Grafana Cloud | Teams standardized on Grafana | Managed Grafana stack for metrics, logs, and traces | Free; Pro from $8/user/month | 4.5/5 |
| 9 | SolarWinds Observability SaaS | Hybrid IT operations | SaaS observability across apps, infrastructure, and networks | Quote-based; 30-day trial | 4.3/5 |
| 10 | Checkmk | Infrastructure monitoring with automation | Agent-based and agentless monitoring with auto-discovery | Free (Community); Pro from €190/month | 4.7/5 |
| 11 | Icinga | Open-source monitoring customization | Flexible open-source monitoring with no host or service limits | Free (core); subscriptions from €2,000/year | 4.4/5 |
| 12 | Sematext Monitoring | Logs, metrics, and website monitoring | Unified monitoring for infrastructure, logs, and synthetic checks | From $2.8/host/month; 14-day trial | 4.7/5 |
Best 12 monitoring software tools for IT operations
1. Datadog
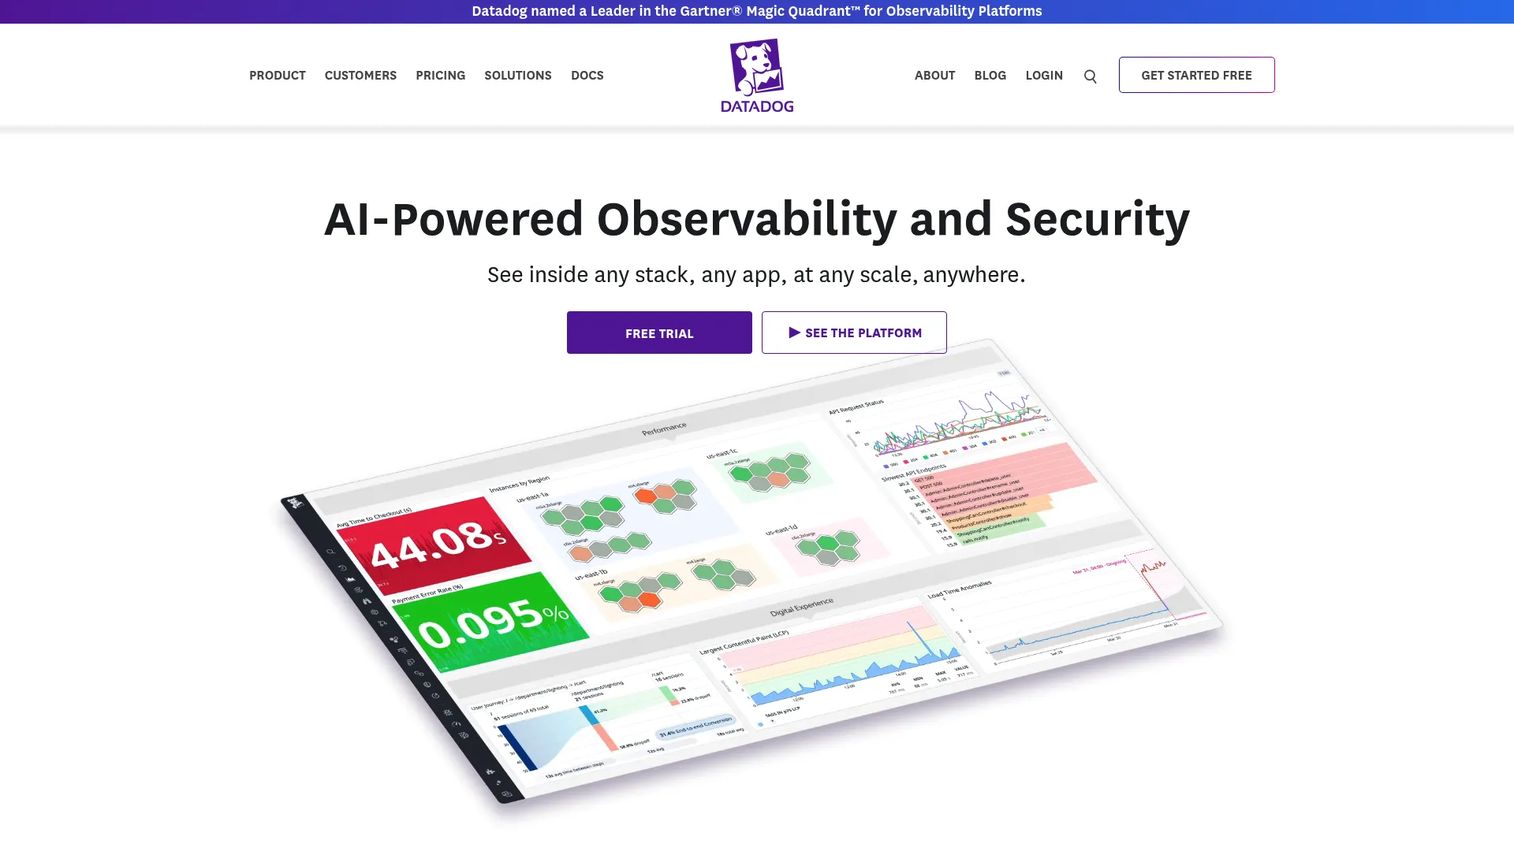
Datadog is a cloud monitoring and observability platform that covers infrastructure, application performance monitoring, log management, synthetic monitoring, real user monitoring, security monitoring, and incident workflows from a single interface. It is built for teams running distributed cloud environments who need to correlate signals across services without jumping between tools.
Best for: Cloud-native, multi-service engineering and IT operations teams that want one commercial platform for metrics, logs, traces, and alerting.
Key features
- Infrastructure monitoring with 1,000+ integrations and OpenTelemetry support
- Application performance monitoring with distributed tracing and service maps
- Log management, security monitoring, and dashboards
- Synthetic monitoring for uptime and user journey checks
- Incident management and alert routing
Why choose Datadog: Datadog fits teams that want broad telemetry coverage from a single platform rather than stitching together open-source components. The trade-off is cost: Usage-based pricing across hosts, logs, and custom metrics can scale quickly as your environment grows.
Datadog pricing: Infrastructure Pro starts at $15 per host per month (billed annually), or $18 per host on demand. Infrastructure Enterprise is $23 per host per month annually. A free tier covers up to five basic hosts with one-day metric retention. DevSecOps plans start at $22 per host per month (Pro) or $34 per host per month (Enterprise).
G2 rating: 4.4/5
2. Dynatrace
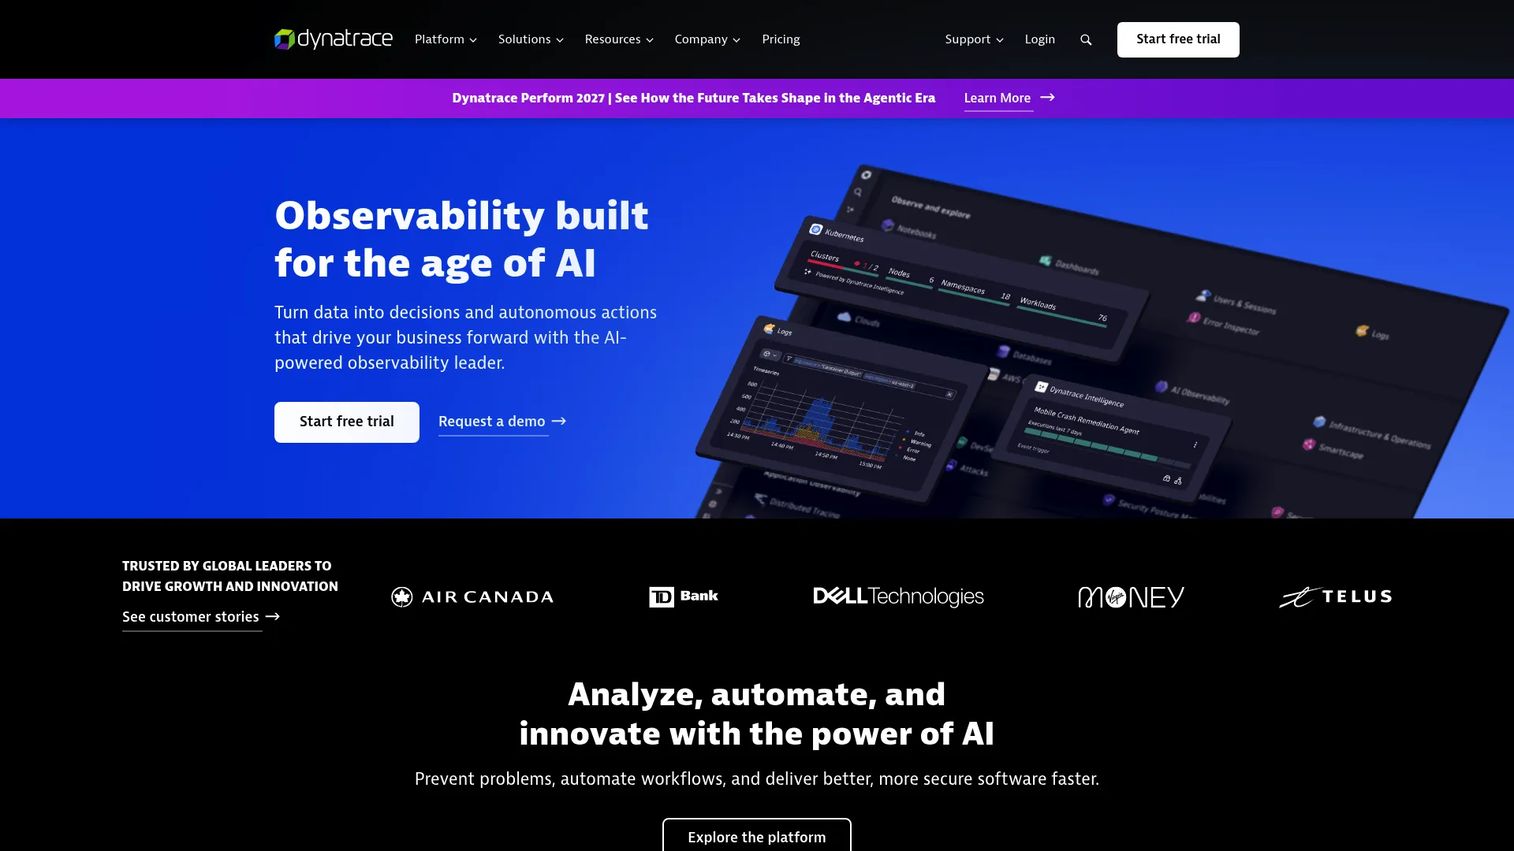
Dynatrace is an enterprise observability and AIOps platform for applications, infrastructure, cloud services, Kubernetes, and digital experience monitoring. Its Davis AI engine automates topology mapping and root cause analysis, which reduces the manual correlation work that slows incident response in complex environments.
Best for: Enterprise teams with large, complex infrastructures that need automated dependency mapping and AI-assisted root cause analysis rather than manual triage.
Key features
- AI-assisted root cause analysis and automated topology mapping
- Distributed tracing across microservices and Kubernetes clusters
- Digital experience monitoring including real user monitoring and synthetic monitoring
- Log, metric, trace, and event analytics through the Grail data lakehouse
- Runtime vulnerability analytics for application security
Why choose Dynatrace: The Davis AI engine sets Dynatrace apart for large environments where manual correlation is too slow. Presales teams evaluating Dynatrace for buyers should plan for the deployment effort and licensing model during the POC, since consumption-based pricing means costs vary by monitoring scope.
Dynatrace pricing: Consumption-based plans use an annual platform subscription. Foundation and Discovery starts at $7 per host per month. Infrastructure Monitoring is $29 per host per month. Full-Stack Monitoring is $58 per 8 GiB host per month. Synthetic HTTP monitoring is $1 per 1,000 requests. A 15-day free trial is available.
G2 rating: 4.5/5
3. New Relic
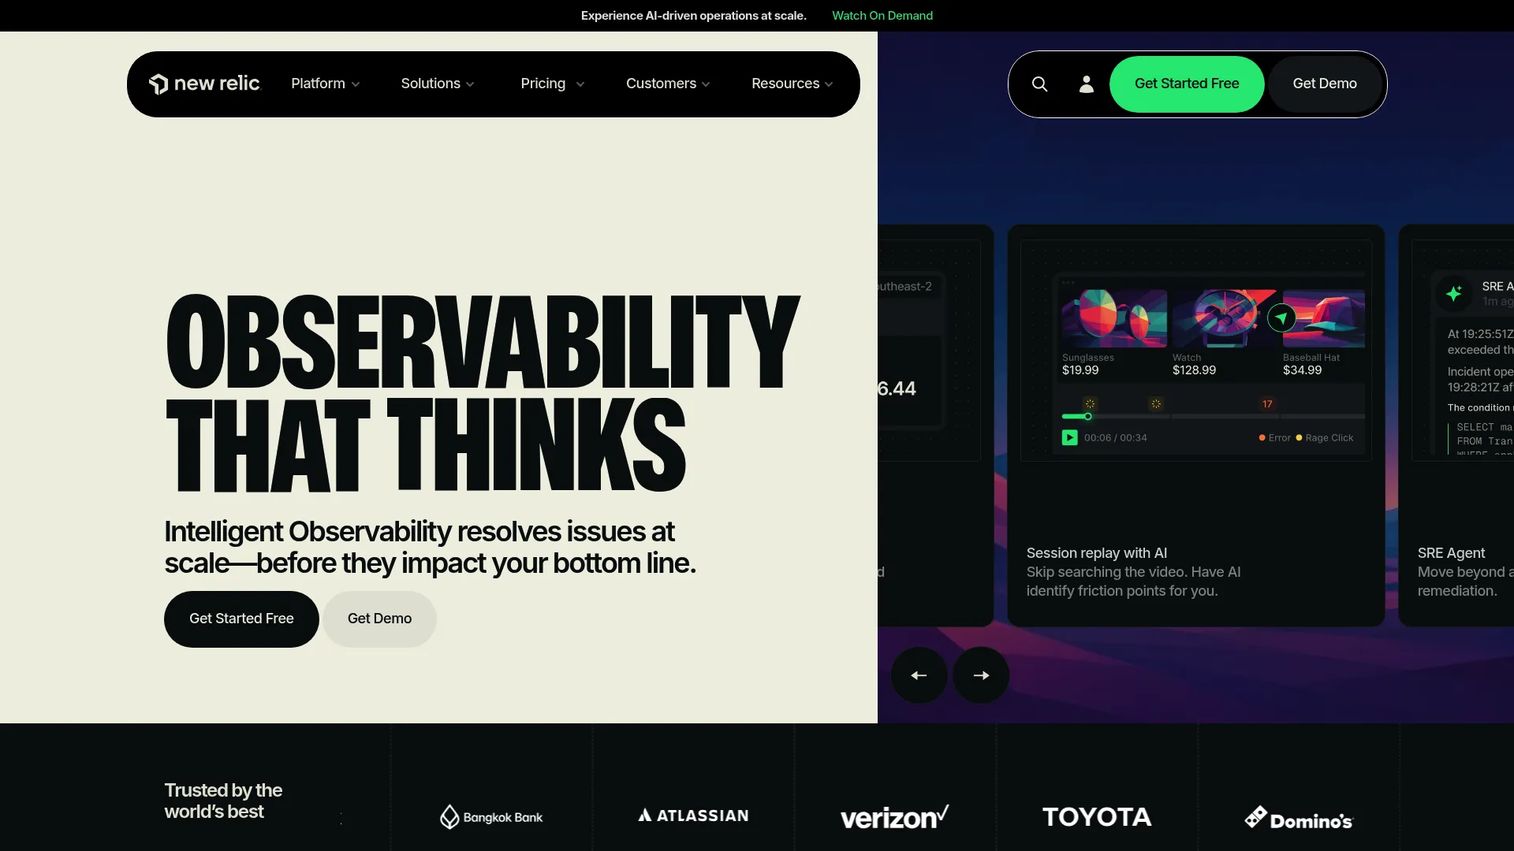
New Relic is an observability platform designed for engineering teams monitoring applications, infrastructure, logs, distributed traces, and digital experiences. Its usage-based pricing model, with a free tier that includes 100 GB of monthly data ingest and one full-platform user, makes it accessible for teams evaluating before committing.
Best for: Engineering and SRE teams that want full-stack observability with developer-friendly workflows and OpenTelemetry support.
Key features
- Application performance monitoring with distributed tracing
- Infrastructure and Kubernetes monitoring
- Log management with centralized searchable logs
- Synthetic monitoring for uptime and performance checks
- OpenTelemetry compatibility for telemetry standardization
Why choose New Relic: The free tier and usage-based billing lower the barrier for teams that want to evaluate before buying. Model your expected data ingest and user seat count carefully before scaling, since costs grow with both.
New Relic pricing: Free plan includes 100 GB/month of data ingest and one full-platform user. Standard is $10 for the first user and $99 per additional user per month. Pro is $349 per user per year on annual commitment, or $418.80 per user on monthly pay-as-you-go. Enterprise pricing requires contacting sales.
G2 rating: 4.4/5
4. Zabbix
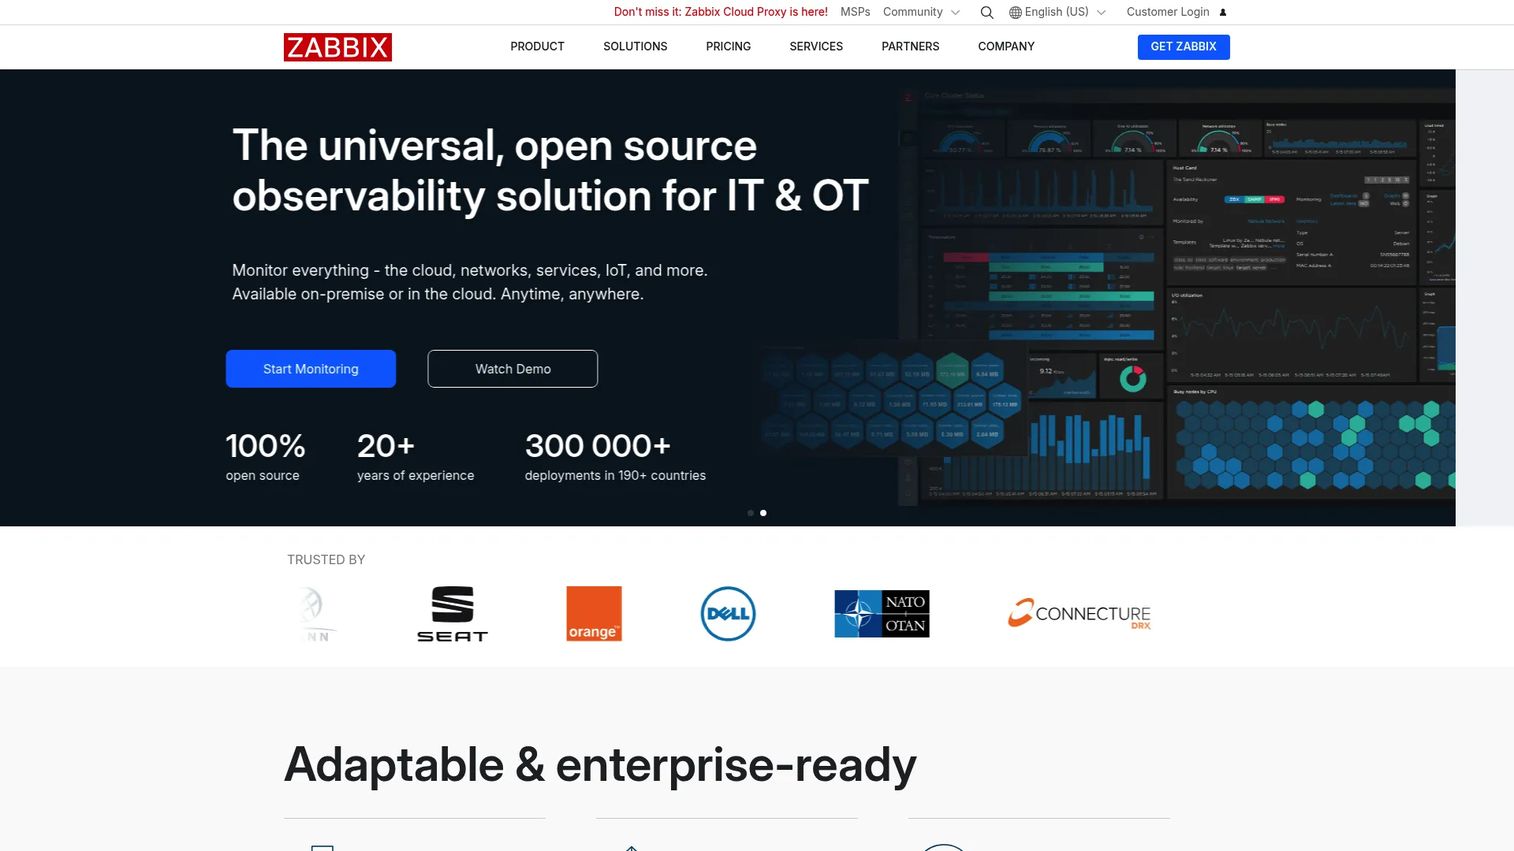
Zabbix is an open-source monitoring platform for networks, servers, virtual machines, applications, services, and cloud resources. The software itself carries no license fees, no device limits, and no feature gates, which makes it the most cost-effective starting point for teams with the operational maturity to self-host.
Best for: Teams that want self-hosted infrastructure monitoring with full control over configuration and no per-device licensing costs.
Key features
- Metric collection from networks, containers, VMs, operating systems, and databases
- Real-time problem detection with smart thresholds and anomaly detection
- Dashboards, graphs, network maps, and scheduled PDF reports
- Kubernetes monitoring, cloud monitoring, and ITSM integrations
- TLS encryption, RBAC, LDAP/SAML authentication, and audit logging
Why choose Zabbix: Zabbix rewards teams that can invest in setup and ongoing tuning. The implementation quality and the skill of the team operating it matter more than the license cost. For organizations comfortable running their own monitoring stack, it delivers enterprise-grade coverage at open-source cost.
Zabbix pricing: The Zabbix software is free to download and deploy. Zabbix Cloud plans start at $50 per month (Nano tier) and scale through Micro at $100/month, Small at $250/month, Medium at $750/month, and larger tiers up to $5,000/month. Paid subscriptions include support SLAs, maintenance, and security patches.
G2 rating: 4.4/5
5. Nagios XI
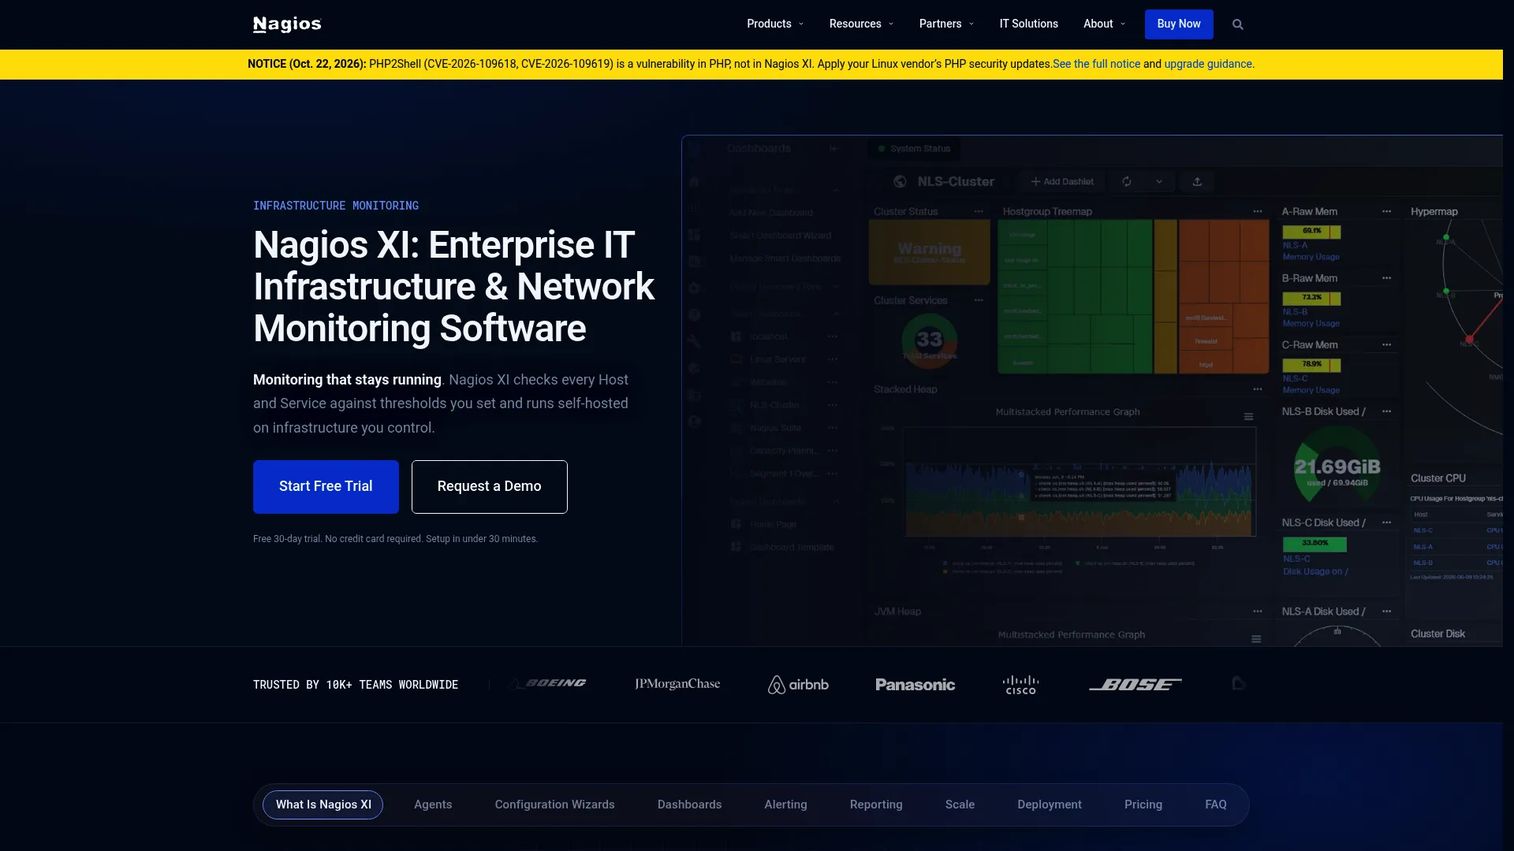
Nagios XI is commercial infrastructure monitoring software built on the Nagios monitoring engine, extended with dashboards, configuration wizards, auto-discovery, reporting, and alerting. It is a mature platform with a large plugin ecosystem, making it a practical choice for traditional IT operations teams that already work in Nagios-style workflows.
Best for: IT teams that need mature server and network monitoring with an extensible plugin ecosystem and prefer self-hosted, node-licensed software.
Key features
- Host and service monitoring with agent-based and agentless options
- Configuration wizards and auto-discovery for faster setup
- Dashboards, performance graphs, and network maps
- Threshold-based alerting with escalations and event handlers
- Availability, SLA, and capacity-planning reports
Why choose Nagios XI: It fits teams that have years of experience with Nagios-style monitoring and want commercial support, dashboards, and wizards on top of that foundation. Teams evaluating newer all-in-one observability platforms may find Nagios XI more limited on distributed tracing and cloud-native coverage.
Nagios XI pricing: Node-based perpetual licensing. The Standard edition starts at $2,595 for a 100-node license. The Enterprise edition adds features at $4,690 for a 100-node license. A free tier supports up to seven nodes or 100 services. Sitewide unlimited licensing requires contacting sales.
G2 rating: Not verified from a current G2 listing at time of writing. Capterra shows 4.6/5 for reference.
6. Paessler PRTG
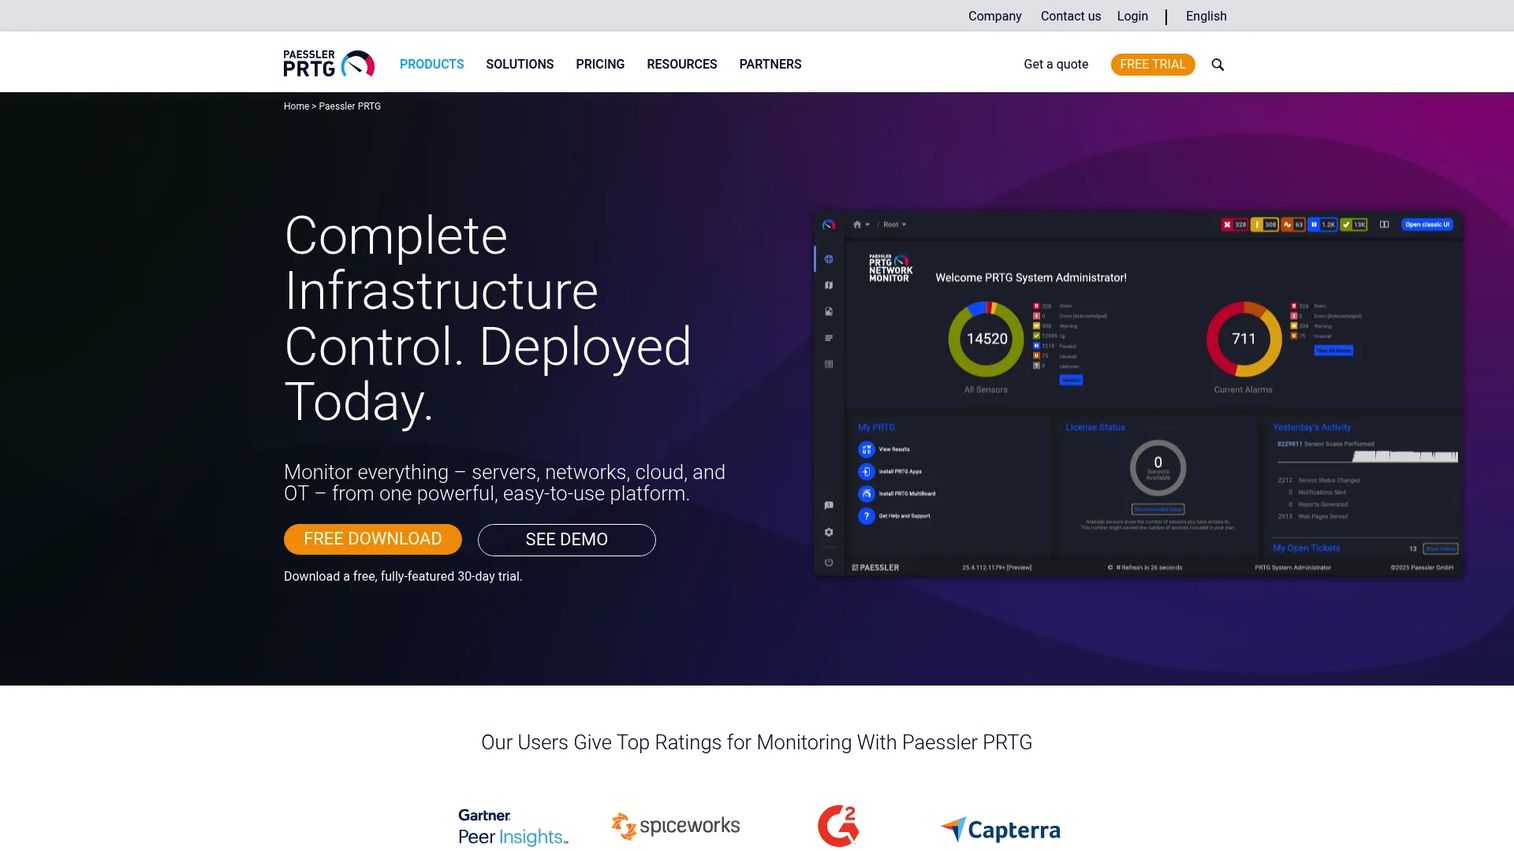
Paessler PRTG is sensor-based IT monitoring software for networks, servers, applications, bandwidth, virtual environments, and cloud services. Each monitored aspect counts as a sensor, and plans are priced by how many sensors you need. This model works well for IT teams that know exactly what they monitor.
Best for: IT teams that need practical network monitoring with clear device visibility across routers, switches, servers, and cloud endpoints.
Key features
- More than 250 preconfigured sensor types plus custom sensor options
- Network maps for visual topology views
- Bandwidth monitoring and traffic analysis
- Device auto-discovery and threshold-based alerting
- Distributed monitoring for multi-site environments
Why choose Paessler PRTG: Its sensor model makes it predictable to budget once you know your monitoring scope. It covers network, server, and cloud endpoints from a single dashboard without requiring a full observability platform. The freeware edition supports up to 100 sensors at no cost.
Paessler PRTG pricing: PRTG Network Monitor subscriptions start at $2,399 per year for 500 sensors. PRTG 1000 is $4,299/year, PRTG 2500 is $8,899/year, and PRTG 5000 is $15,599/year. All plans are sold as three-year subscriptions with annual billing. A freeware edition covers up to 100 sensors indefinitely.
G2 rating: 4.7/5
7. ManageEngine OpManager
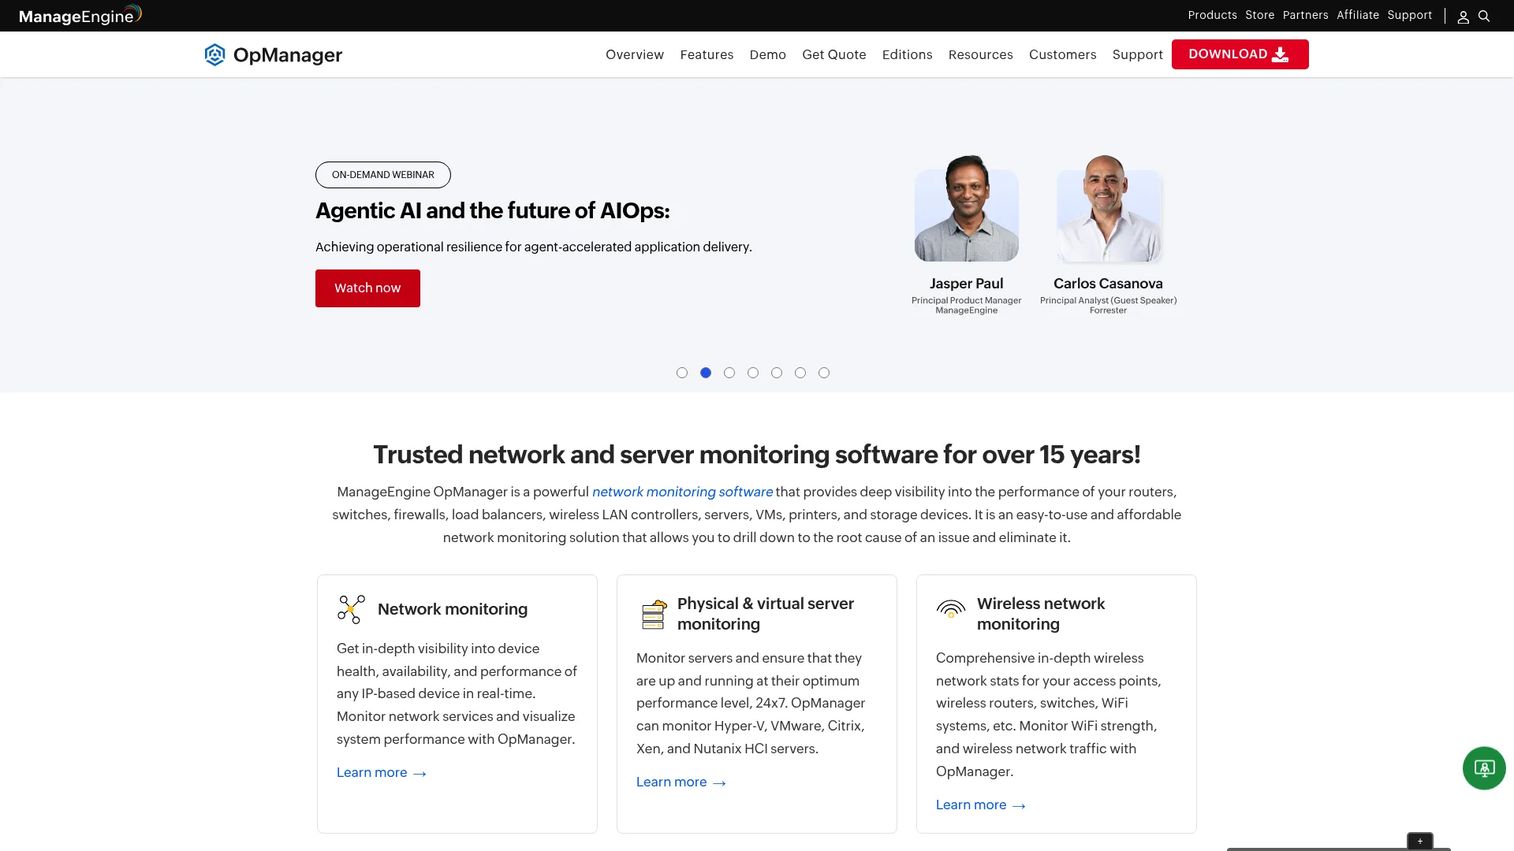
ManageEngine OpManager is network and infrastructure monitoring software covering routers, switches, servers, virtual machines, storage, and WAN interfaces. It provides network discovery, topology maps, and fault management without requiring teams to adopt a full observability suite.
Best for: Mid-market IT teams that need network monitoring with topology visualization and do not want to buy into an enterprise-scale observability platform.
Key features
- Network discovery and availability monitoring
- Physical and virtual server monitoring
- Topology maps and interface monitoring
- Workflow automation and fault management
- AIOps-enabled alerts and dashboards
Why choose ManageEngine OpManager: It fills the gap for IT teams where network visibility is the primary need. The device-based pricing model is straightforward, and the three editions (Standard, Professional, Enterprise) let teams scale up as their environment grows.
ManageEngine OpManager pricing: The Standard edition starts at $95 for 10 devices per year. The Professional edition starts at $145 for 10 devices per year. The Enterprise edition starts at $4,595 for 250 devices per year. A 30-day free trial is available.
G2 rating: Not verified from a confirmed G2 listing at time of writing. Capterra shows 4.6/5 for reference.
8. Grafana Cloud
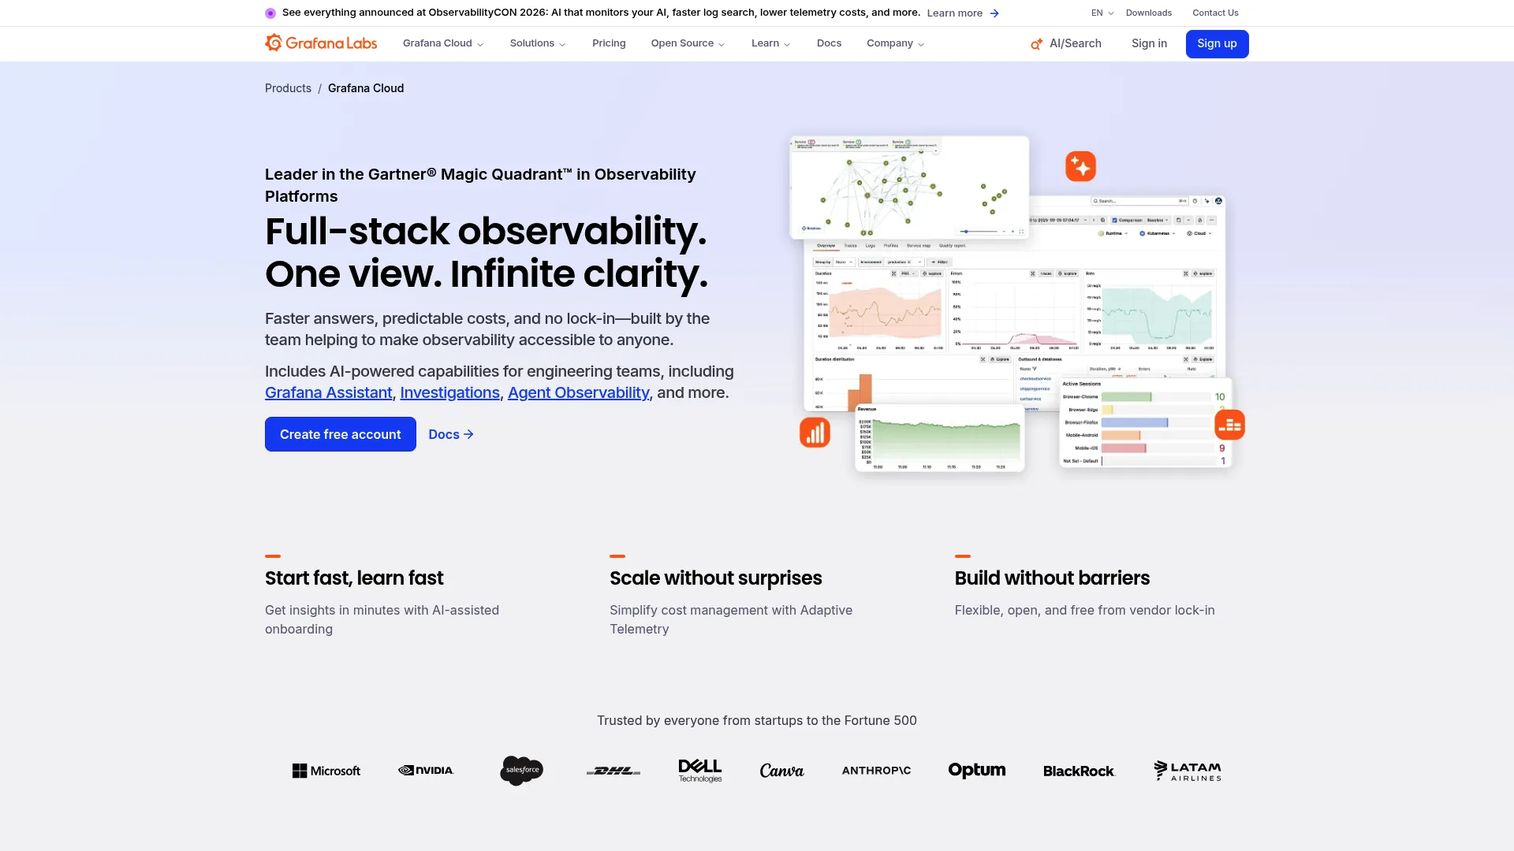
Grafana Cloud is a fully managed observability platform built around Grafana dashboards, metrics, logs, traces, profiles, and alerting. It is the managed version of the open-source Grafana stack, which means teams already running Grafana locally can move to managed infrastructure without rebuilding their dashboards.
Best for: DevOps and SRE teams already using Grafana or open telemetry tools who want managed infrastructure without running the stack themselves.
Key features
- Managed Grafana visualization and dashboards
- Metrics, log, trace, and profile storage backends
- Kubernetes, application, and database observability
- Synthetic monitoring and k6 load testing
- Grafana Assistant for natural-language queries and investigations
Why choose Grafana Cloud: The free plan is a genuine starting point, not a demo. Teams get always-free product tiers with usage-based Pro pricing as they scale. For teams standardizing on OpenTelemetry, the Grafana stack offers strong compatibility without locking into a proprietary telemetry format.
Grafana Cloud pricing: A free plan is permanently available. The Pro tier starts at $8 per active user per month, plus a $19 per month platform fee that includes three active users (Grafana Visualization). Enterprise pricing starts at a $25,000 annual minimum commitment, billed custom.
G2 rating: 4.5/5
9. SolarWinds Observability SaaS
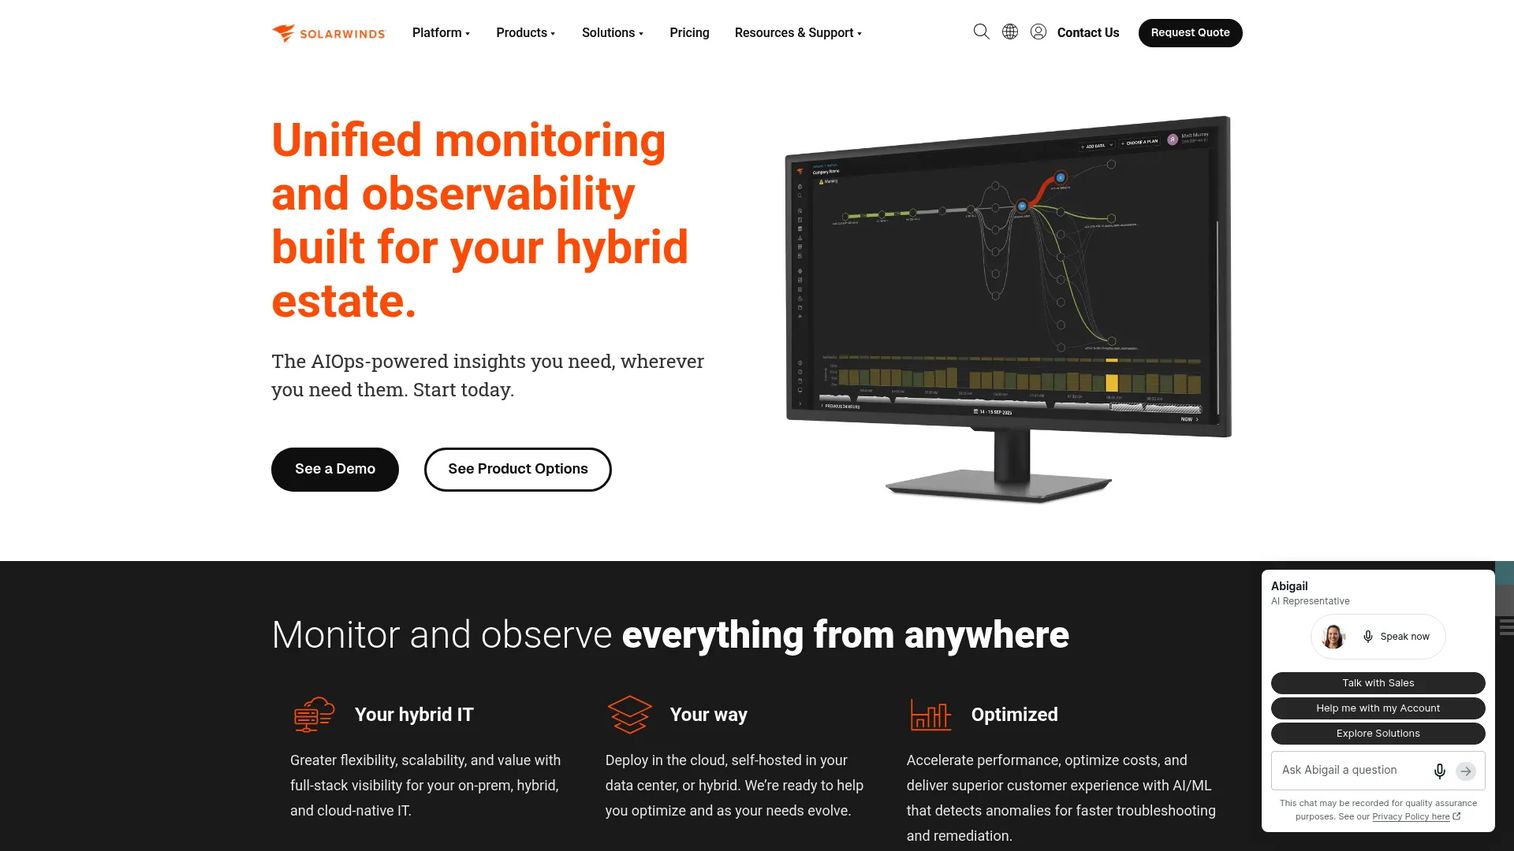
SolarWinds Observability SaaS is a SaaS-delivered full-stack observability platform for cloud-native and hybrid IT environments. It covers applications, microservices, Kubernetes, infrastructure, databases, networks, logs, and digital experience from a single cloud platform, which makes it useful for IT teams modernizing from traditional monitoring.
Best for: Hybrid IT operations teams that need SaaS observability across on-premises systems and cloud infrastructure without maintaining separate monitoring tools.
Key features
- Unified visibility across metrics, logs, traces, and user experience
- Monitoring for applications, Kubernetes, containers, infrastructure, and databases
- AIOps-powered anomaly detection and insights
- Network monitoring and end-user experience tracking
- OpenTelemetry and public API integrations
Why choose SolarWinds Observability SaaS: It suits teams that have grown beyond traditional monitoring and want a SaaS platform that covers both legacy on-premises infrastructure and cloud-native workloads from the same interface.
SolarWinds Observability SaaS pricing: Pricing is usage-based and subscription-based, with specific figures available through a sales conversation. A 30-day free trial gives teams full platform access before committing.
G2 rating: 4.3/5
10. Checkmk
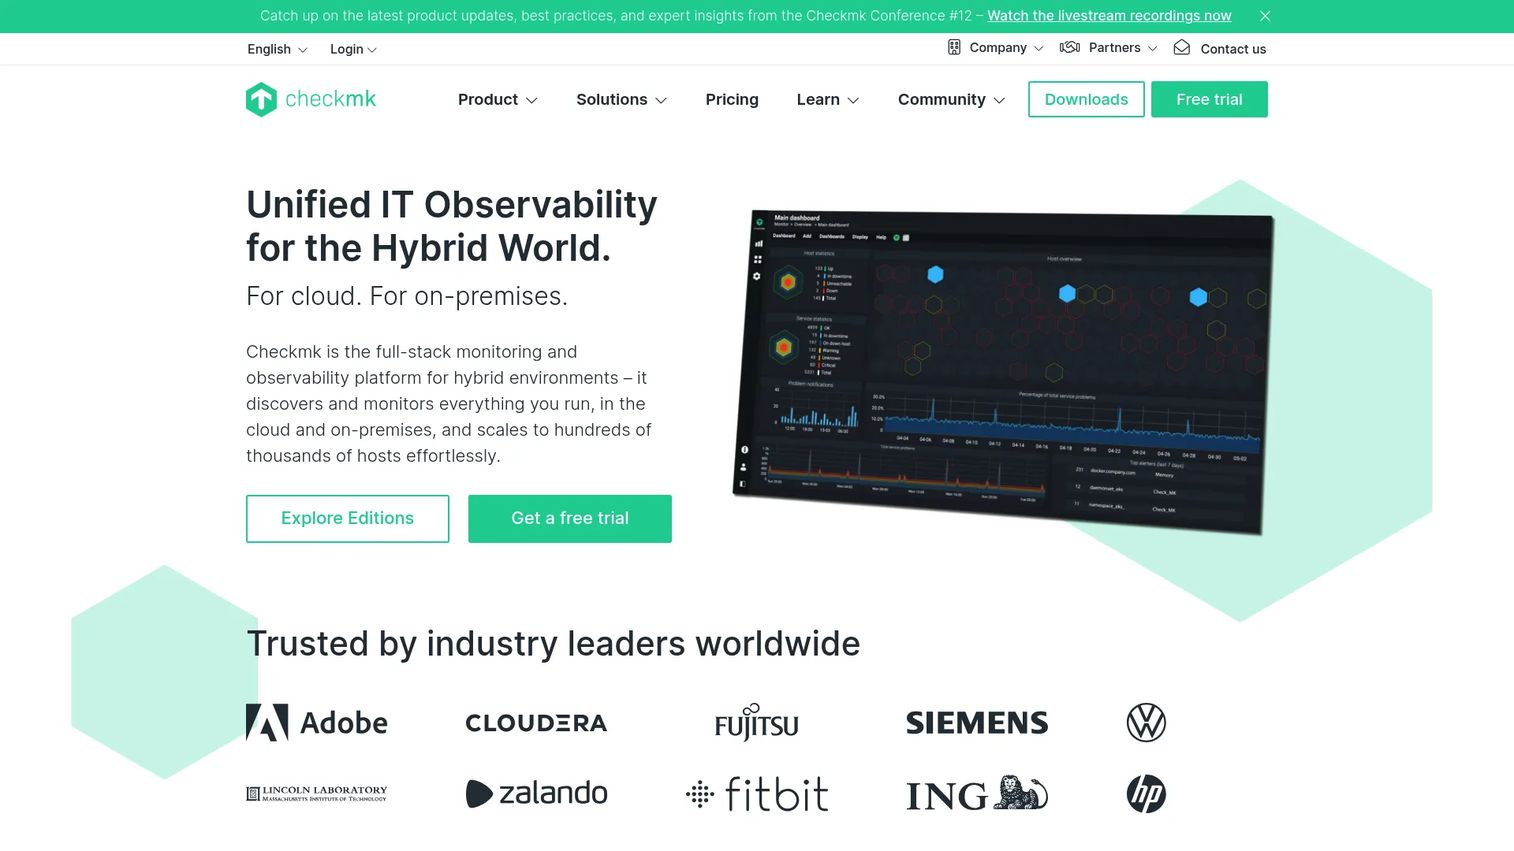
Checkmk is infrastructure and application monitoring software with auto-discovery, agent-based and agentless monitoring, dashboards, Kubernetes support, and a free Community edition. It is designed to give IT teams fast setup and broad coverage without requiring every integration to be built from scratch.
Best for: Teams that want scalable infrastructure monitoring with strong automation and do not want to configure every check manually.
Key features
- Auto-discovery of hosts and services
- Agent-based and agentless monitoring
- Network, server, cloud, and Kubernetes monitoring
- Alert rules with escalation and notification routing
- Synthetic monitoring for availability checks
Why choose Checkmk: The Community edition is genuinely free and runs without host limits. Teams that want commercial support, clustering, or enterprise features can upgrade to Pro or Ultimate. For IT teams running hybrid environments, it covers on-premises and cloud without requiring separate tools.
Checkmk pricing: The Community edition is free and open source. The Pro edition starts at €190 per month (billed annually). The Ultimate edition starts at €275 per month (billed annually). The Cloud (SaaS) edition starts at €240 per month. All paid plans include support and enterprise features.
G2 rating: 4.7/5
11. Icinga
Icinga is an open-source monitoring framework for availability, performance, alerts, and integrations across infrastructure and services. The core software supports unlimited hosts and services with no license cost. Enterprise modules and package repositories are available through paid subscriptions.
Best for: Technical teams that want open-source flexibility and the ability to build custom monitoring workflows through APIs, Git-based configuration, and infrastructure-as-code tools.
Key features
- Availability and performance monitoring across servers, networks, containers, and cloud
- Rule-based alerts with dependency visualization
- API integrations with Ansible, Puppet, Terraform, and Grafana
- Modular architecture with enterprise-only modules via subscription
- High availability and clustering support
Why choose Icinga: Icinga rewards teams with strong operational maturity and clear ownership of their monitoring stack. The forever-free core handles most infrastructure monitoring needs. Teams that need enterprise Linux packages or exclusive modules pay for Repository or Module subscriptions.
Icinga pricing: The Forever Free edition covers unlimited hosts and services at no cost. Repository subscriptions start at €5,000 per year. Module subscriptions start at €2,000 per year. Enterprise support starts at $15,000 per year (Basic) and $30,000 per year (Premium).
G2 rating: 4.4/5
12. Sematext Monitoring
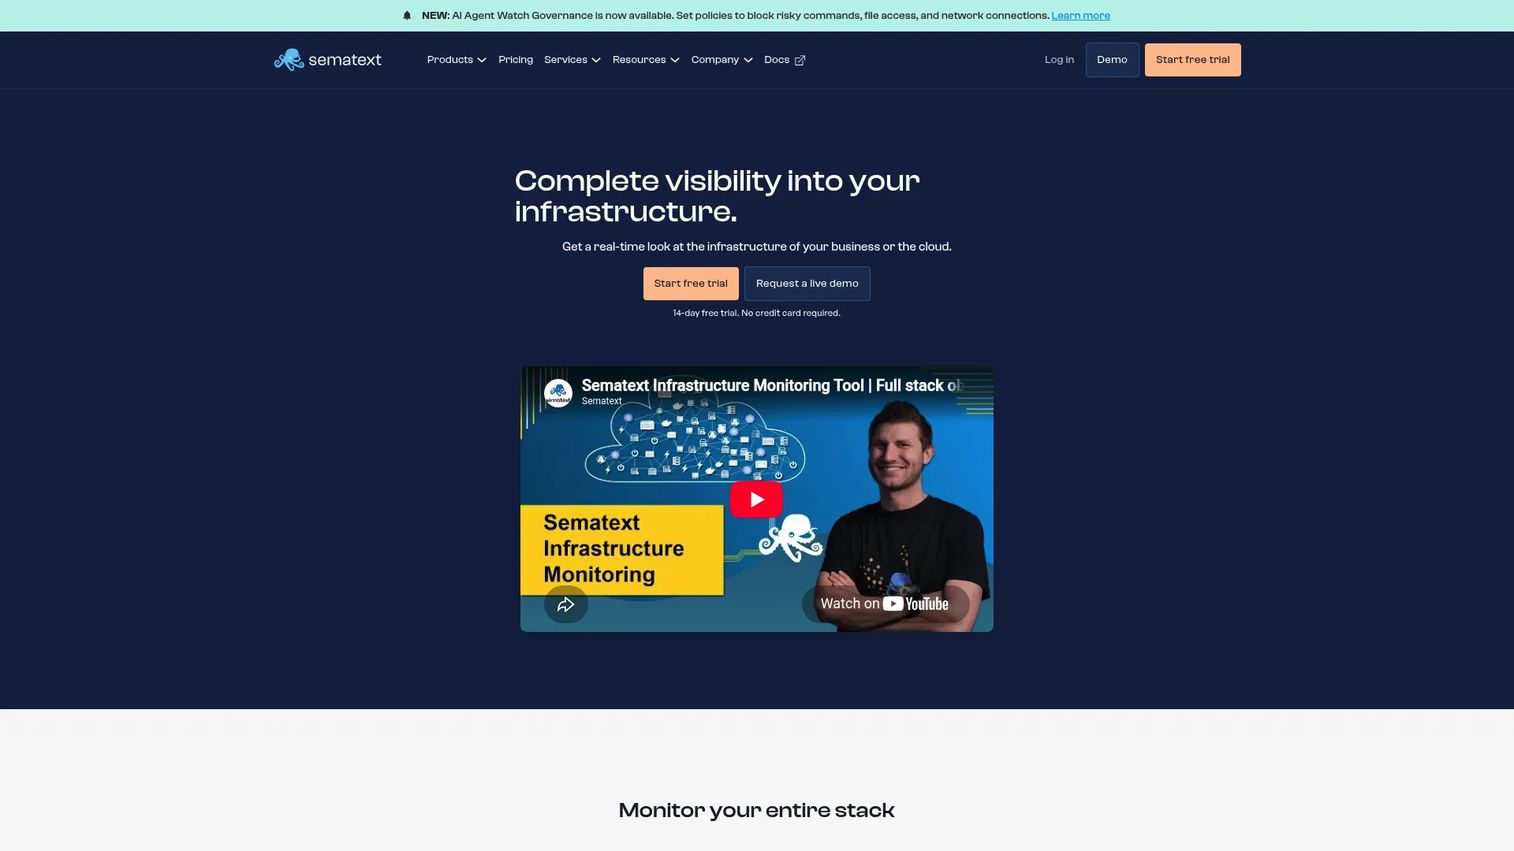
Sematext Monitoring is infrastructure and service monitoring software covering servers, Kubernetes clusters, containers, applications, databases, and synthetic website checks. It pairs infrastructure metrics with log management and real user monitoring in a focused platform without the overhead of a full enterprise observability rollout.
Best for: Lean IT teams that want log and metric visibility in a focused platform without adopting a heavier enterprise stack.
Key features
- Infrastructure monitoring for servers, containers, Kubernetes, and cloud instances
- Automatic service discovery and pre-built integrations
- Synthetic monitoring for uptime and website performance
- Real user monitoring for front-end performance tracking
- Custom dashboards, alert rules, and anomaly detection
Why choose Sematext Monitoring: It fits teams that need unified log and metric visibility without a long implementation cycle. The starting price per host is low enough to pilot before expanding, and the 14-day free trial lets you verify coverage against your actual infrastructure.
Sematext Monitoring pricing: Plans start at $2.8 per host per month. Tier-specific pricing for Basic, Standard, and Pro plans is based on host count and data retention. A 14-day free trial is available with full platform access. A free plan is also available with limited retention.
G2 rating: 4.7/5
Considerations when choosing monitoring software
Match the tool to what you actually monitor
An APM-heavy platform is overkill if your primary gap is network device visibility. A network monitoring tool may miss application-level traces entirely. Before comparing vendors, map your current systems: Servers, containers, cloud accounts, network devices, and applications. That map determines which tool category fits, and which features you will actually use.
Price your telemetry volume before signing anything
Monitoring costs often grow faster than expected. Usage-based platforms charge per host, per sensor, per GB ingested, or per user, and all of those dimensions expand as your environment does. Run the math on your current host count, daily log volume, and expected retention period. Get a pricing estimate from the vendor based on those numbers before you commit.
Test alert quality during the proof of concept
The number of alerts is not the measure of a good monitoring system. During a POC, simulate failure scenarios and evaluate how the platform deduplicates, routes, suppresses, and recovers from alerts. Poor alerting produces fatigue. Strong alerting tells the right person what happened and where, without the noise. This is especially relevant for presales engineers helping buyers validate a product in their environment, where alert behavior under load is often the decisive question. See our guide on API monitoring tools for adjacent tooling that pairs with alerting workflows.
Check whether alerts land where your team already works
Integrations with incident workflows matter more than checkbox counts. The practical question is whether an alert from your monitoring platform will surface in the tools your team uses, whether that is a chat channel, an incident ticketing system, or a paging service. Verify the specific integration depth, not just the presence of a logo on the integrations page.
Confirm governance, security, and data retention
Check SSO support, RBAC controls, audit logging, data retention periods, and region controls before finalizing any selection. For regulated environments, agent access and data residency may require specific configurations. Keep this evaluation separate from employee monitoring requirements, since IT monitoring data and workforce activity data sit in different compliance contexts.
Conclusion
The right monitoring software depends on your environment, your team, and how much operational overhead you can absorb.
For broad cloud-scale coverage, Datadog, Dynatrace, and New Relic are the strongest commercial observability platforms. Each offers a different pricing model: Host-based (Datadog), consumption-based (Dynatrace), and usage-plus-user (New Relic). Zabbix, Checkmk, and Icinga are the strongest open-source and self-hosted picks for teams that want control over their stack without license pressure. Paessler PRTG and ManageEngine OpManager cover network-heavy IT environments where device visibility is the primary gap. Grafana Cloud suits teams already invested in the Grafana ecosystem who want managed infrastructure. Sematext Monitoring is worth evaluating for lean teams that want logs, metrics, and website monitoring in a single focused platform.
The practical next step: Shortlist two or three tools based on environment fit, run the same incident scenario in each, and compare alert quality, telemetry coverage, and total cost before you commit.
FAQs
IT monitoring software tracks the health, availability, performance, and behavior of systems including servers, networks, applications, and cloud services. It helps teams detect issues, investigate root causes, and respond before end users are affected. Key use cases include uptime monitoring, application performance tracking, log analysis, and alerting on threshold breaches.
Monitoring typically starts with known metrics and predefined alert thresholds. You watch for conditions you already expect to fail. Observability goes further by helping teams investigate unknown failure modes through correlated metrics, logs, traces, and dependency context. Most modern platforms blend both, but the distinction matters when choosing a tool: Infrastructure-first environments often need monitoring; distributed cloud-native environments often need observability.
Datadog, Dynatrace, New Relic, Grafana Cloud, and SolarWinds Observability SaaS all cover cloud infrastructure well. The best choice depends on your cloud provider coverage, Kubernetes requirements, log volume, and incident workflow. New Relic offers a generous free tier for evaluation. Datadog covers the broadest integration range. Grafana Cloud is strongest for teams already using OpenTelemetry or the Grafana dashboard ecosystem.
Zabbix, Checkmk, and Icinga are the three strongest open-source options from this list. Zabbix and Icinga both have unlimited host and service monitoring with no license cost. Checkmk's Community edition is also free and includes auto-discovery. The key difference is operational overhead: All three require teams to configure, maintain, and scale their own infrastructure.
Pricing varies widely by model. Usage-based platforms charge per host, per GB of logs ingested, or per user, meaning costs grow as your environment does. Sensor-based platforms (like PRTG) charge by monitoring scope. Node-based platforms (like Nagios XI) use perpetual per-node licenses. Open-source software carries no license fee but requires operational investment. Model your expected host count, log volume, and data retention period before comparing vendor quotes.
Start by mapping your on-premises systems, cloud accounts, Kubernetes clusters, network devices, and applications. Then identify where your current blind spots are. Tools like SolarWinds Observability SaaS, Dynatrace, and Datadog are designed to cover both legacy and cloud-native workloads from a single platform. Open-source tools like Zabbix and Checkmk can cover hybrid environments but require more integration work to achieve the same coverage.
Yes, when alerts are tuned and routed correctly. Monitoring software contributes to incident response through early detection, dependency context, escalation routing, dashboard visibility, and historical evidence for postmortems. The improvement in response time depends on how well alert thresholds, suppression rules, and routing are configured, not simply on deploying the platform.
No. Employee monitoring software tracks worker activity including time, application usage, websites visited, or screen captures, and is primarily an HR and workforce management tool. IT monitoring software tracks infrastructure, applications, networks, services, logs, metrics, and alerts. The two categories serve different teams, different compliance requirements, and different operational goals.