

It's 3 a.m. The on-call engineer's phone buzzes for the seventh time in an hour. Six of those alerts are noise: a CPU spike that self-resolved, a flapping check, a duplicate from a sibling monitor. The seventh is real. By the time they triage it, customers have noticed.
This is the operational reality most engineering leaders inherit at Series B. Infrastructure complexity outruns headcount. According to Fortune Business Insights AIOps market forecast, the global AIOps market is projected to grow from about $2.67 billion in 2026 to $11.8 billion by 2034, a CAGR of 18.6%. That spend isn't theoretical. It's catching up to the cost of repeated incidents, alert fatigue, and SRE burnout that founders feel in their NRR numbers long before they see it in their cloud bill.
Industry analyst commentary, including Gartner's research on event intelligence solutions, consistently points to the same pattern: most production alerts are noise, and the share of duplicates and false positives is large enough that correlation has become the highest-leverage observability investment a scaling SaaS team can make.
This is a buyer's guide. The goal is a defensible shortlist your VP Engineering can act on this quarter.
What's inside
This guide is written for VPs of Engineering, Heads of Infrastructure, SRE leads, and the Series B founders signing the contract. We evaluated AIOps tools against five criteria:
- Coverage across telemetry sources (logs, metrics, traces, events, topology)
- Quality of AI and ML for correlation, anomaly detection, and root cause analysis
- Integration depth with existing observability stacks
- Pricing transparency and total cost of ownership at scale
- Verified G2 ratings and customer-reported operational outcomes
Tools are ordered by relevance to mid-market and enterprise SaaS buyers, not alphabetically. Pricing reflects values on each vendor's pricing page at the time of writing.
TL;DR
- Best overall for full-stack observability: Datadog, for teams already running cloud-native infrastructure who want AIOps inside one platform.
- Best causal AI and explainable RCA: Dynatrace, for hybrid and on-prem heavy environments where audit trails matter.
- Best for correlation-only specialism: BigPanda, for enterprises with five or more existing monitoring tools that don't want a rip-and-replace.
- Best incident-response anchor: PagerDuty, for teams where on-call workflow is the bottleneck.
- Best open-standards play: Grafana Cloud, for engineering-led teams committed to OpenTelemetry and Prometheus.
- Best for converged security and observability: Splunk, for orgs already standardized on Splunk for SIEM.
Background: What AIOps actually does
AIOps, short for Artificial Intelligence for IT Operations, is software that applies machine learning and increasingly agentic AI to telemetry data (logs, metrics, traces, events, and topology) to detect anomalies, correlate incidents, identify root causes, and automate response - a category originally defined by the definition of AIOps from Gartner.
Most AIOps platforms operate across five capability layers:
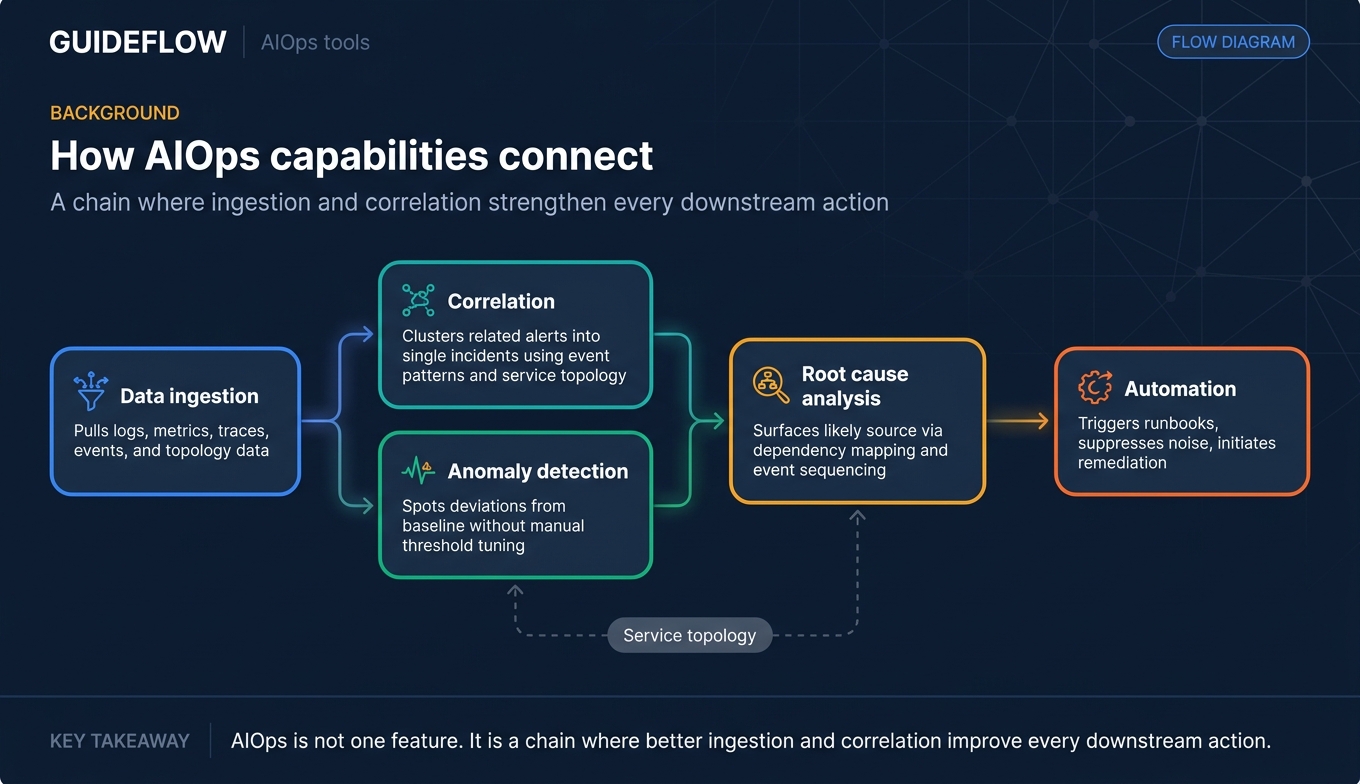
- Data ingestion: Pulling logs, metrics, traces, events, and topology data from infrastructure, applications, and existing monitoring tools.
- Correlation: Clustering related alerts into single incidents, often using ML on event patterns and service topology.
- Anomaly detection: Spotting deviations from baseline behavior without manual threshold tuning.
- Root cause analysis (RCA): Surfacing the most likely source of an incident based on dependency mapping and event sequencing.
- Automation: Triggering runbooks, suppressing transient noise, or initiating remediation actions.
A quick disambiguation, because these aiops platforms get confused with adjacent categories:
- AIOps focuses on IT operations telemetry and incident workflows.
- AI observability focuses on monitoring LLMs, model drift, and prompt performance for AI applications.
- Event intelligence solutions, the Gartner-coined category, sit underneath AIOps and focus specifically on correlating, deduplicating, and routing events from many sources.
The 2026 inflection point is agentic AI. The earlier generation of aiops software relied on rules and supervised ML for correlation. The newer generation, including Datadog Bits AI, Dynatrace Davis CoPilot, and LogicMonitor Edwin AI, takes investigative actions on its own: querying data sources, summarizing incidents, suggesting remediations. That shift changes how teams should evaluate AIOps vendors, and it's why pricing pages across the category are being rewritten this year.
When to use AIOps
Not every team needs an AIOps platform. The signal is usually one of three patterns.
Consolidate fragmented monitoring tools
Most mid-market and enterprise SaaS teams run multiple monitoring tools across infrastructure, APM, logs, network, and security. Each tool produces its own alerts, with no shared context. AIOps solutions create a correlation layer on top of that fragmentation, collapsing related events into single incidents and routing them through one workflow. The result is fewer pages, cleaner handoffs, and a single timeline for postmortems.
Cut alert fatigue and protect on-call hours
Alert fatigue isn't a morale problem. It's a retention problem. When on-call engineers stop trusting alerts, real incidents get acknowledged late. SRE burnout and alert fatigue research shows the operational cost compounding well before it shows up in cloud bills. Event correlation, often the highest-impact AIOps feature, can collapse thousands of raw alerts into a much smaller number of actionable incidents. For a SaaS team with three on-call SREs, that's the difference between sustainable rotation and quarterly attrition.
Shorten MTTR on production incidents
For Series B and Series C SaaS, every minute of downtime affects NRR and shows up in churn signals six months later. AIOps platforms shorten MTTR by surfacing probable root cause early, mapping service dependencies, and giving responders a starting point instead of a blank query bar - aligning with MTTR best practices for incident response. Faster resolution compounds. Fewer war rooms, more time on reliability engineering.
Comparison table
Below is a side-by-side comparison of the 10 AIOps vendors covered in this guide. Pricing reflects what's published on each vendor's official pricing page. G2 ratings are sourced from each tool's live G2 listing.
| # | Product | Intent | Key differentiation | Pricing | G2 rating |
|---|---|---|---|---|---|
| 1 | Datadog | Full-stack observability with embedded AIOps | Broadest integration coverage, Watchdog and Bits AI inside one platform | Infrastructure Pro: $15/host/month (annual) | 4.4/5 |
| 2 | Dynatrace | Causal AI and explainable RCA | Davis AI causal engine, OneAgent auto-discovery | Foundation & Discovery: $7/host/month | 4.5/5 |
| 3 | Splunk | Observability and security convergence | ITSI service health, Splunk AI Assistant for SPL | Custom (Workload, Ingest, Entity, or Activity-based) | 4.3/5 |
| 4 | New Relic | Consumption-priced full-platform AIOps | Applied Intelligence, NRDB-backed correlation, user-based pricing | Standard: $10/first user, $99/additional user | 4.4/5 |
| 5 | BigPanda | Specialist event correlation and incident intelligence | Open Box ML, transparent clustering logic | Custom credit-based plans starting at 20,000 credits | 4.5/5 |
| 6 | PagerDuty | Incident response with AIOps add-on | Auto-pause Incident Noise, Rundeck-based automation | Professional: $21/user/month (annual) | 4.5/5 |
| 7 | LogicMonitor | Hybrid infrastructure monitoring with Edwin AI | Agentic AI assistant, 3,000+ integrations | Essentials: $16 per hybrid unit/month | 4.5/5 |
| 8 | ServiceNow ITOM | AIOps inside the ServiceNow workflow | CMDB-coupled correlation, Now Assist for ITOM | Custom (ITSM Foundation, Advanced, Prime) | 4.4/5 |
| 9 | IBM Cloud Pak for AIOps | Containerized AIOps for multi-cloud and hybrid | Topology correlation, Watson AI, OpenShift-native | Modular, custom pricing | 4.2/5 |
| 10 | Grafana Cloud | Open-standards observability with AIOps capabilities | OpenTelemetry-first, Grafana ML, LGTM stack | Pro: $19/month platform fee + usage | 4.6/5 |
10 best AIOps tools for 2026
1. Datadog
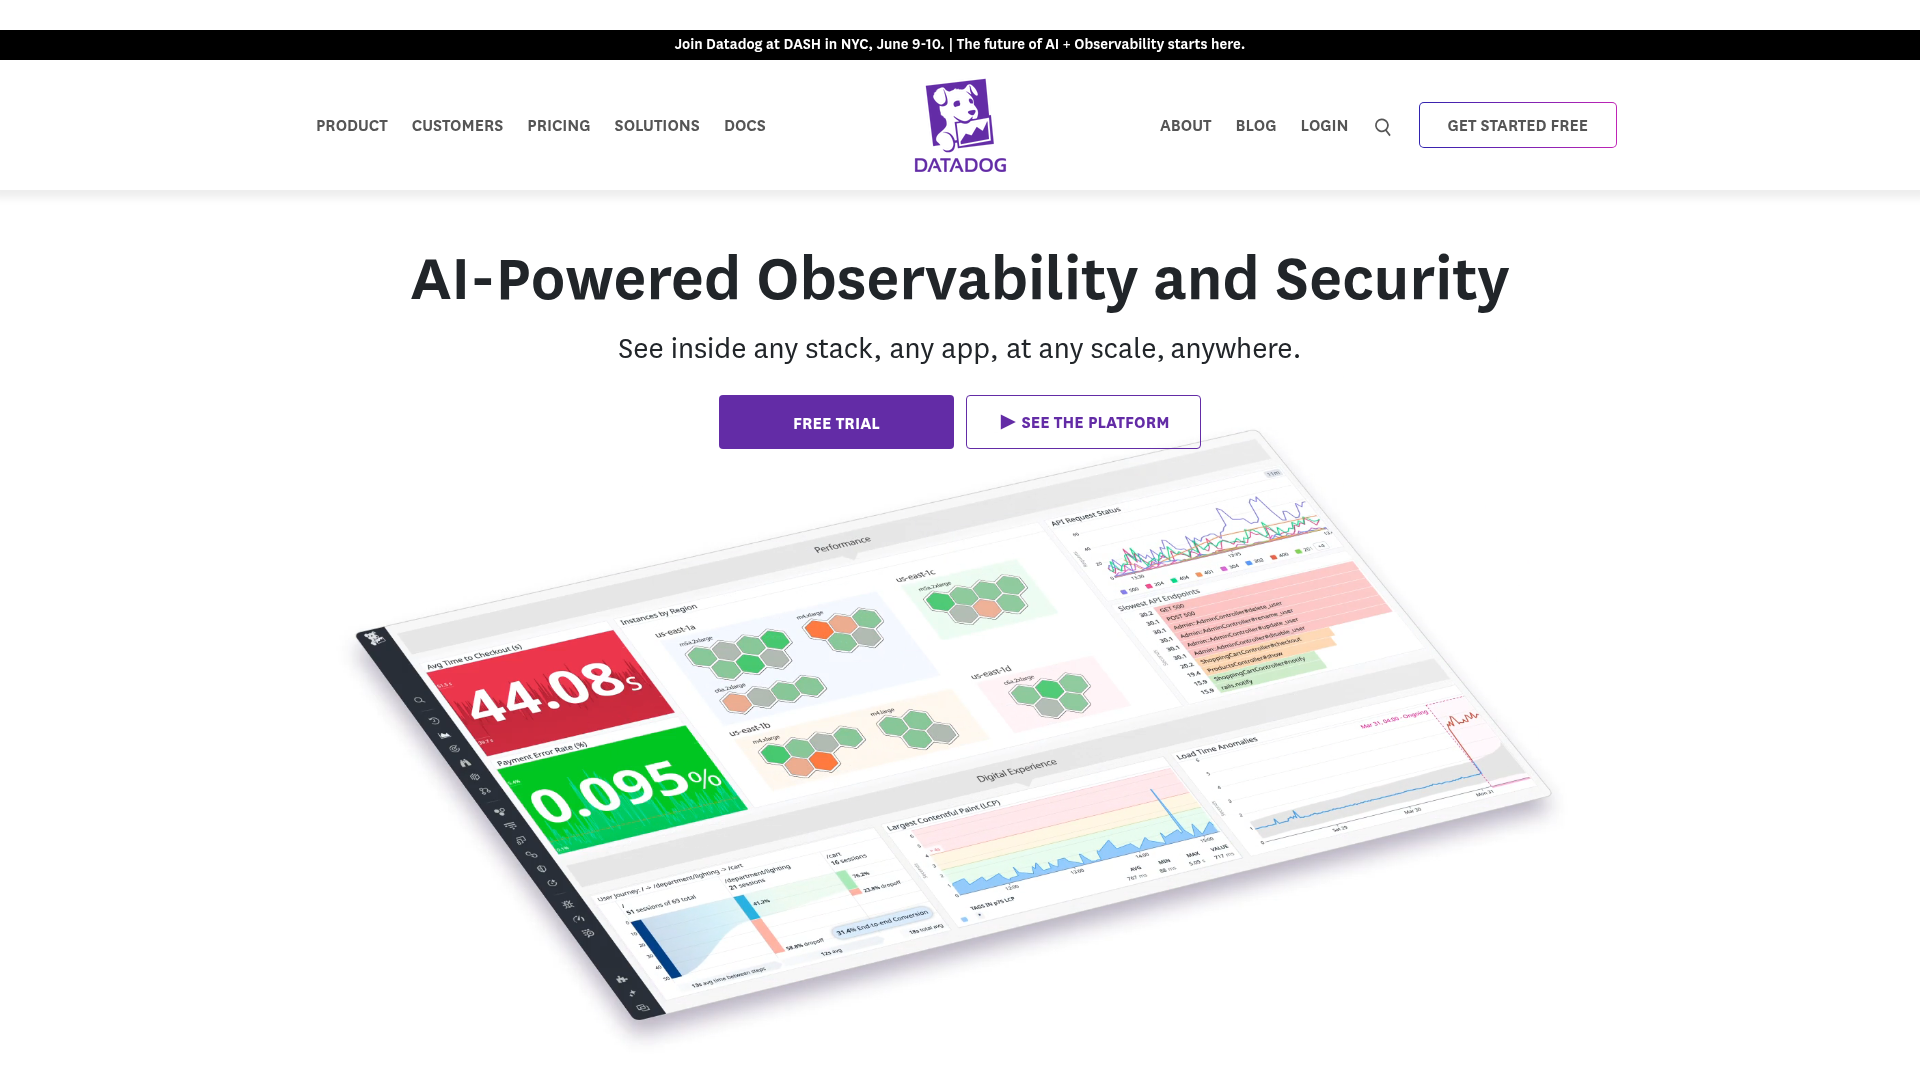
Datadog is an AI-powered observability and security platform for cloud applications. Its AIOps capabilities, primarily Watchdog (automated anomaly detection) and Bits AI (agentic investigation assistant), sit inside the same workspace where engineers already work with metrics, traces, logs, and security signals. For most cloud-native SaaS teams already running Datadog observability, AIOps adoption is incremental rather than a separate procurement cycle.
Best for: Mid-market and enterprise SaaS teams already running Datadog who want AIOps in the platform they already trust.
Key strengths
- Watchdog automated anomaly detection: ML-based detection across infrastructure, APM, and logs without manual threshold tuning.
- Bits AI agentic assistant: Investigates incidents in natural language, summarizes context, and proposes next steps.
- Hundreds of vendor-backed integrations: Tag-based search and analytics with broad coverage across Kubernetes, serverless, and major SaaS infrastructure.
Why choose Datadog: Lowest friction option for teams already invested in Datadog observability. One-click correlation across metrics, traces, logs, and security signals is genuinely useful in a live incident. Per-host pricing scales aggressively past a few hundred hosts, so model the curve before signing a multi-year commitment.
Datadog pricing: Datadog uses product-specific, usage-based pricing. Infrastructure Pro is $15 per infra host per month (billed annually) and Infrastructure Enterprise is $23 per infra host per month (billed annually). APM Pro is $35 per APM host per month and APM Enterprise (which adds Continuous Profiler) is $40 per APM host per month. A free trial is available. Verify current rates on the Datadog pricing page.
2. Dynatrace
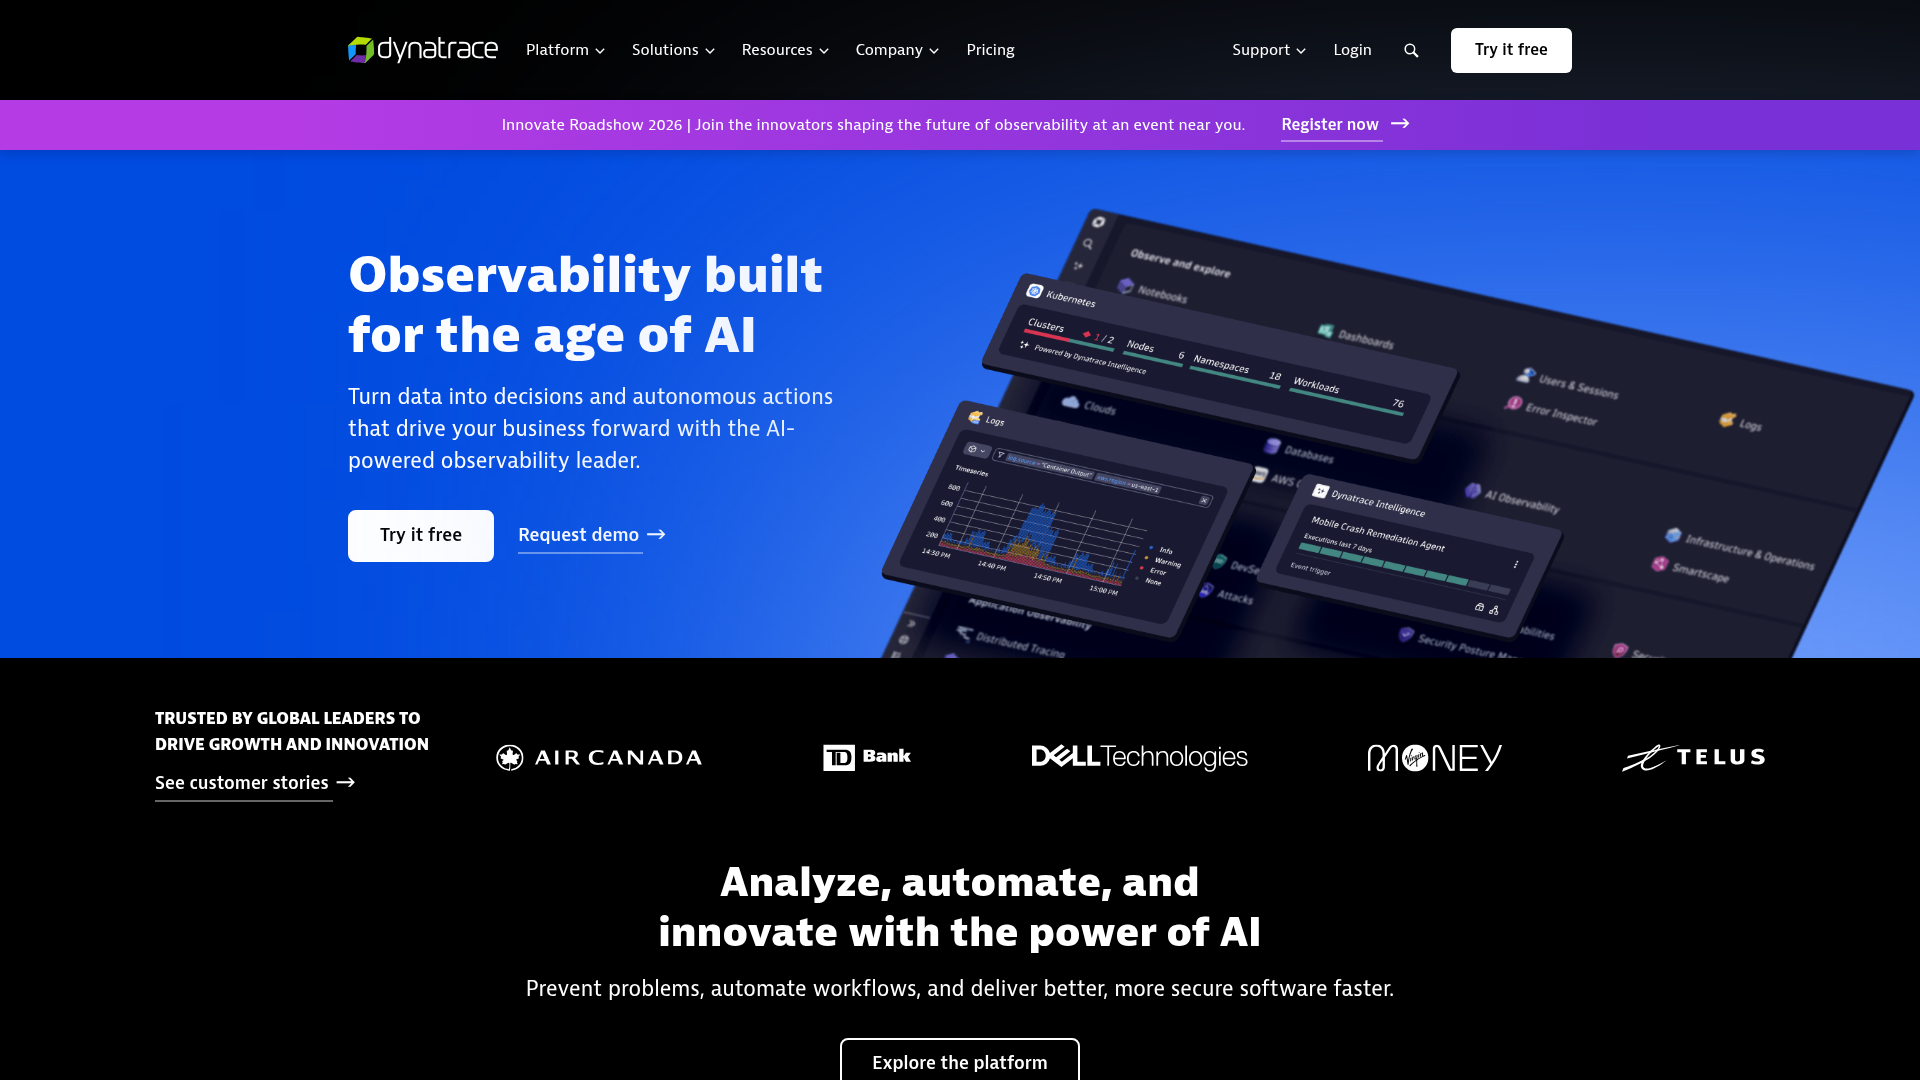
Dynatrace is an observability platform built around Davis AI, a causal-AI engine, and OneAgent, which automatically discovers and maps service dependencies into a real-time Smartscape topology. The combination produces deterministic root cause analysis rather than probabilistic correlation, which matters when audit and explainability requirements are non-negotiable.
Best for: Enterprises with hybrid or on-prem heavy environments needing explainable, deterministic RCA.
Key strengths
- Davis AI causal engine: Explainable root cause analysis grounded in topology, not statistical correlation alone.
- OneAgent and Smartscape: Auto-discovery and real-time topology mapping without manual instrumentation.
- Grail data lakehouse: Unified store for observability, security, and business event data.
Why choose Dynatrace: Strongest deterministic RCA in the market. Best fit when audit trails, explainability, and regulated workloads matter more than maximum stack flexibility. The agentic AI roadmap and Davis CoPilot are credible answers to the 2026 shift.
Dynatrace pricing: Dynatrace uses the Platform Subscription model with Foundation & Discovery starting at $7 per host per month, Infrastructure Monitoring at $29 per host per month, and Full-Stack Monitoring at $58 per 8 GiB host per month. Additional usage-based pricing applies for log analytics, real user monitoring, synthetic monitoring, and application security. Multi-year and volume discounts are available. Verify current rates on the Dynatrace pricing page.
3. Splunk
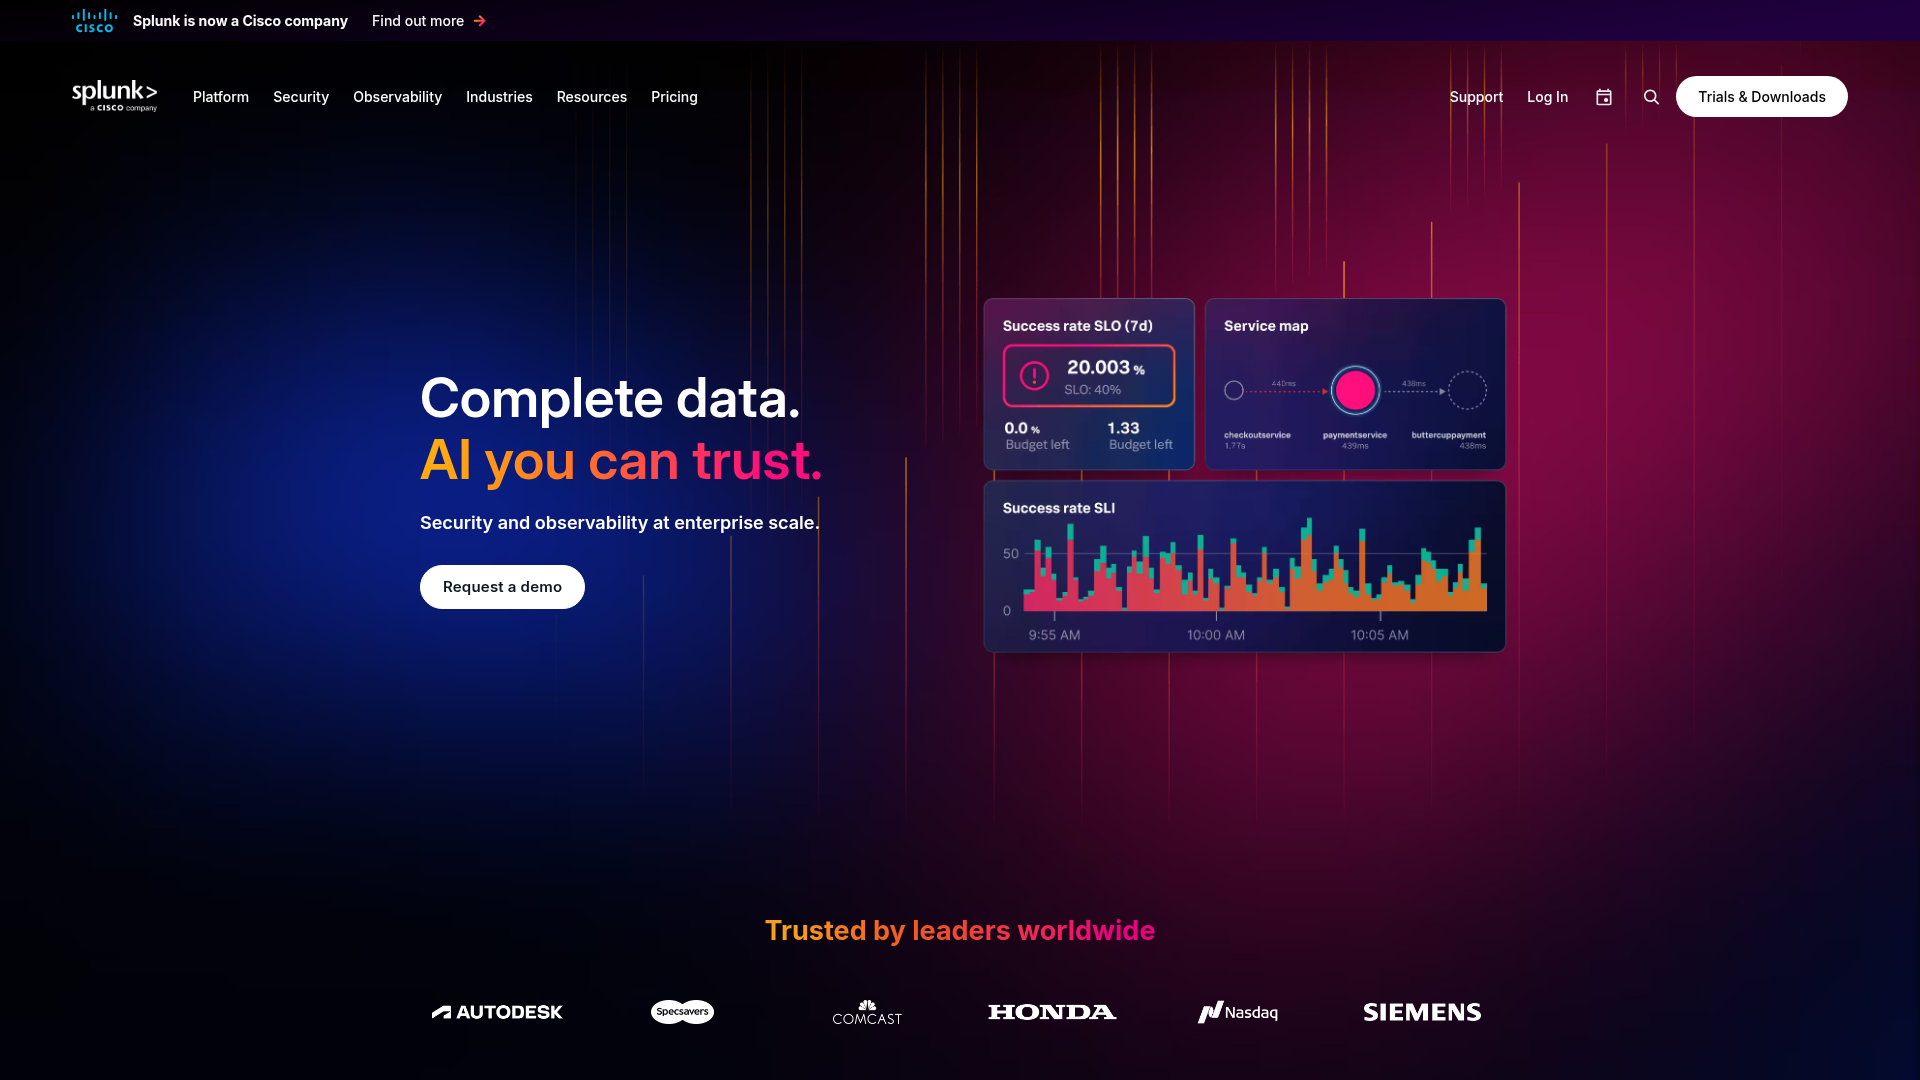
Splunk, now part of Cisco following the completed acquisition, offers a unified security and observability platform that searches, analyzes, and acts on machine data at scale. The AIOps story sits primarily inside Splunk IT Service Intelligence (ITSI) and Splunk Observability Cloud, with the Splunk AI Assistant for SPL adding natural language query generation across both.
Best for: Large enterprises already running Splunk for SIEM who want to converge security and observability on one data platform.
Key strengths
- Splunk ITSI service health scoring: Aggregates KPIs into glanceable service health and surfaces episodes via event correlation.
- Splunk AI Assistant for SPL: Generates SPL queries from natural language prompts, lowering the bar for non-power-users.
- Security and observability convergence: Under Cisco, Splunk is positioned to unify SIEM, observability, and Cisco security signals on shared data.
Why choose Splunk: This is the convergence play. If your org is already on Splunk Enterprise or Splunk Cloud for security, ITSI and Observability Cloud extend that investment without a parallel observability platform. Less compelling as a greenfield AIOps choice.
Splunk pricing: Splunk publishes pricing models rather than numeric list prices. Buyers can choose between Workload Pricing, Ingest Pricing, Entity Pricing, or Activity-based pricing depending on use case. Splunk Cloud Platform is sold via custom quote. Get current numbers on the Splunk pricing page.
4. New Relic
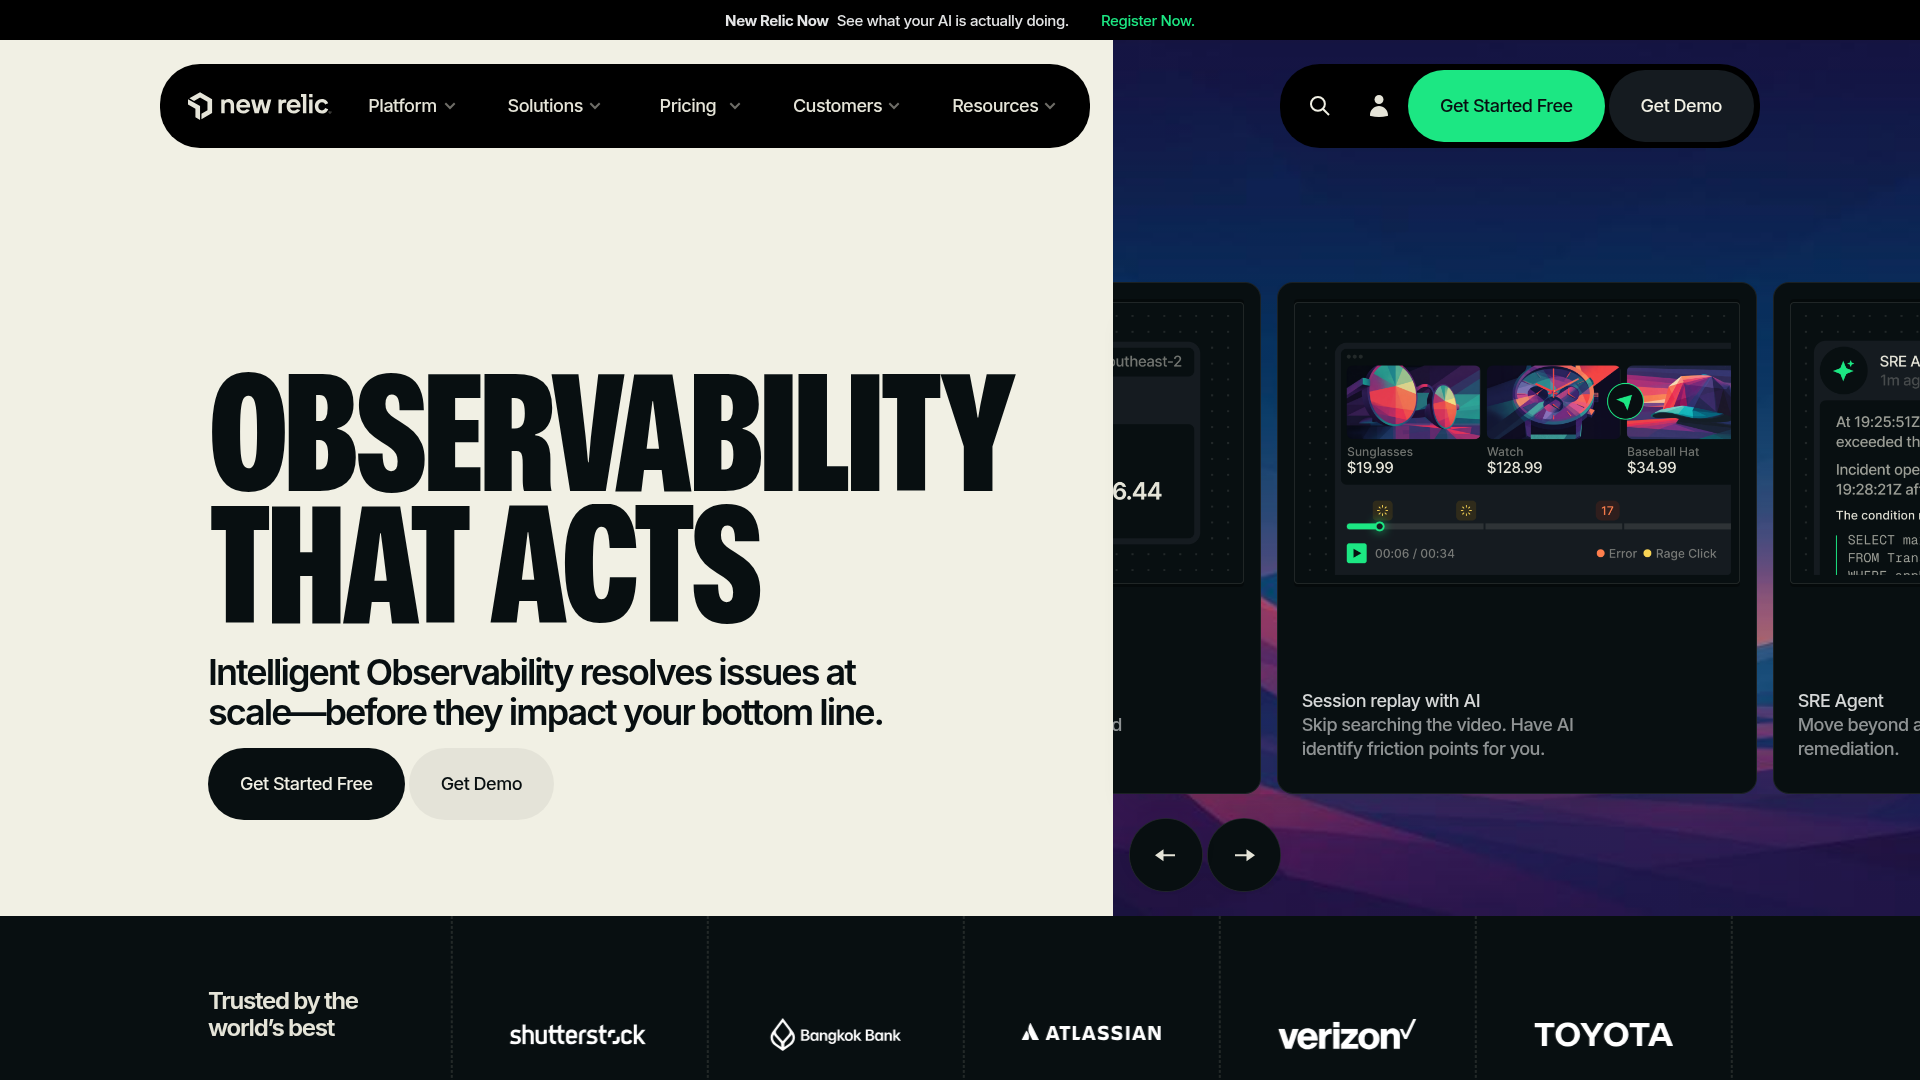
New Relic is an intelligent observability platform that uses AI to help teams resolve issues at scale before they impact the business. Its Applied Intelligence layer delivers anomaly detection and event correlation across metrics, logs, and traces stored in the NRDB telemetry database. The differentiator most engineering teams care about is the user-based commercial model, which behaves very differently from per-host pricing at growth-stage scale.
Best for: Engineering-led teams with variable workloads who want predictable, consumption-based pricing and strong APM roots.
Key strengths
- APM 360: Application performance monitoring with dependency views and distributed tracing for fast troubleshooting.
- Applied Intelligence: Anomaly detection and event correlation across all ingested telemetry.
- Browser and infrastructure monitoring: Real user monitoring tied to backend and Kubernetes health for end-to-end context.
Why choose New Relic: Consumption pricing is friendlier for variable workloads than per-host models, and the perpetual free tier makes it easy to start small. Good fit for product engineering teams that own observability directly rather than handing it to a separate platform group.
New Relic pricing: New Relic offers a Free tier with 100 GB of data ingest per month. Standard is $10 for the first user and $99 per additional user (monthly). Pro is $349 per user with annual commitments or $418.80 per user month-to-month. Enterprise is custom. Original data ingest is $0.40/GB beyond the free 100 GB on Standard and Pro. Verify current rates on the New Relic pricing page.
5. BigPanda
BigPanda is an agentic IT operations platform that uses AI to automate IT incident detection, triage, and resolution. Unlike full-stack observability vendors, BigPanda is built specifically for event correlation and incident intelligence on top of your existing monitoring stack. That focus is the point: it's the cleanest specialist when you don't want to replace your monitoring tools, just correlate them.
Best for: Enterprises drowning in alerts from five or more monitoring tools who need a correlation layer, not another observability platform.
Key strengths
- AI Detection and Response: Correlates signals across monitoring sources and accelerates incident triage with transparent clustering logic.
- AI Incident Prevention: Change risk analysis and problem management to catch issues before they page.
- AI Incident Assistant: Investigation, collaboration, and post-incident reporting support for on-call teams.
Why choose BigPanda: The clearest specialist for noise reduction and event correlation. The Open Box ML approach makes correlation logic explainable, which matters when on-call engineers need to trust why two alerts were grouped. Best when you have heavy investment in existing monitoring and don't want to rip and replace.
BigPanda pricing: BigPanda uses a value-based hybrid subscription model with tiered credit plans, a universal credit system across products, plans starting at 20,000 credits, and one- to three-year commitments. No dollar-denominated list price is published. Reviewer-reported deployments commonly start in the mid-five to six-figure annual range, depending on scope. Request a quote on the BigPanda pricing page.
6. PagerDuty
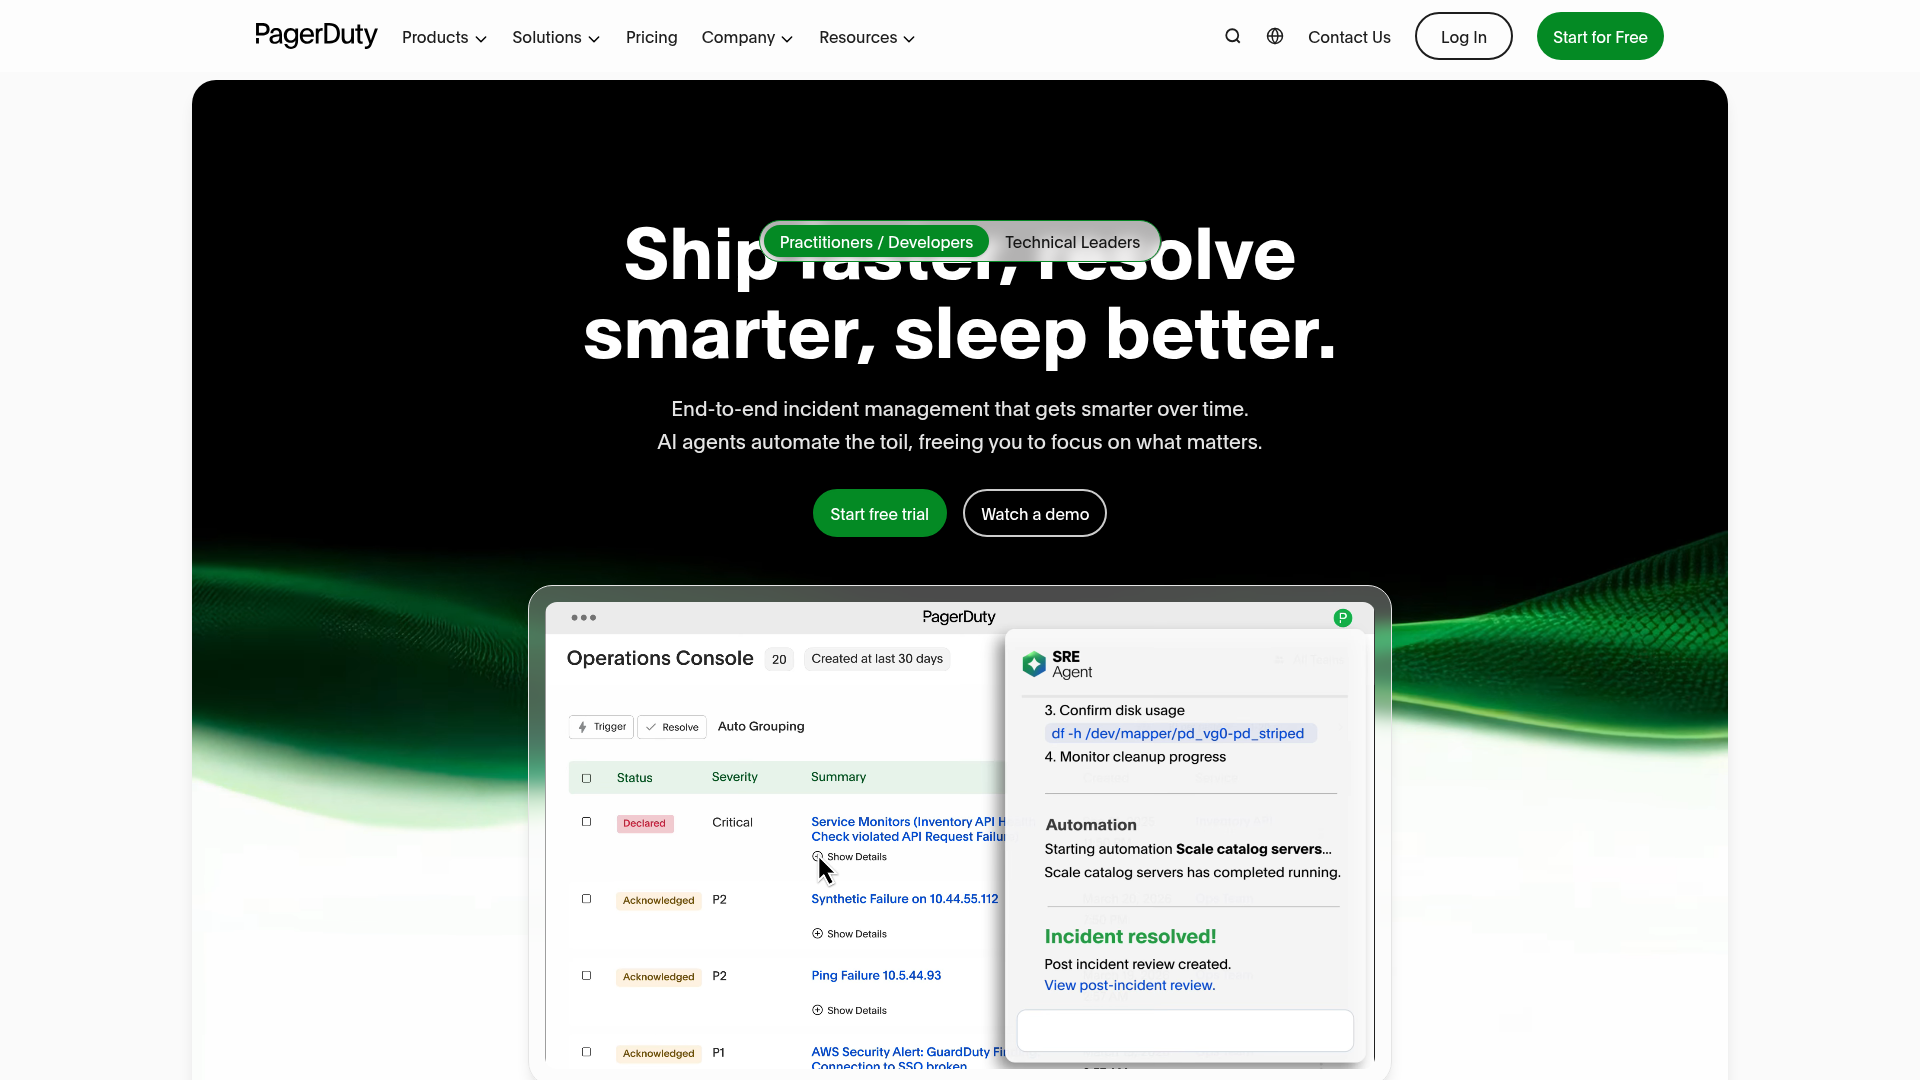
PagerDuty is an AI-powered operations platform for incident management, AIOps, automation, and digital operations work. The PagerDuty AIOps add-on layers event correlation and noise reduction on top of the core incident response platform that most SaaS engineering orgs already use for on-call.
Best for: Teams already using PagerDuty for on-call who want to add intelligent correlation upstream without buying a separate AIOps platform.
Key strengths
- Incident workflows and on-call schedules: Escalation policies, roles, tasks, stakeholder updates, and post-incident learning in one workflow.
- Auto-pause Incident Noise: Suppresses transient and flapping alerts before they page on-call teams.
- Runbook automation via Rundeck: PagerDuty Process Automation, based on the Rundeck runbook automation acquisition, enables auto-remediation workflows.
Why choose PagerDuty: Best when incident response is the primary bottleneck, not telemetry coverage. The AIOps add-on integrates tightly with existing on-call workflows, so adoption doesn't require a parallel rollout. If your engineers already trust PagerDuty for paging, AIOps adoption is incremental.
PagerDuty pricing: PagerDuty offers a Free plan for up to 5 users. Professional is $21 per user per month and Business is $41 per user per month, both at yearly pricing (16% off month-to-month). Enterprise is custom. PagerDuty AIOps is sold as an add-on alongside add-ons for PagerDuty Advance, Stakeholder Licenses, and Status Pages. Verify current rates on the PagerDuty pricing page.
7. LogicMonitor
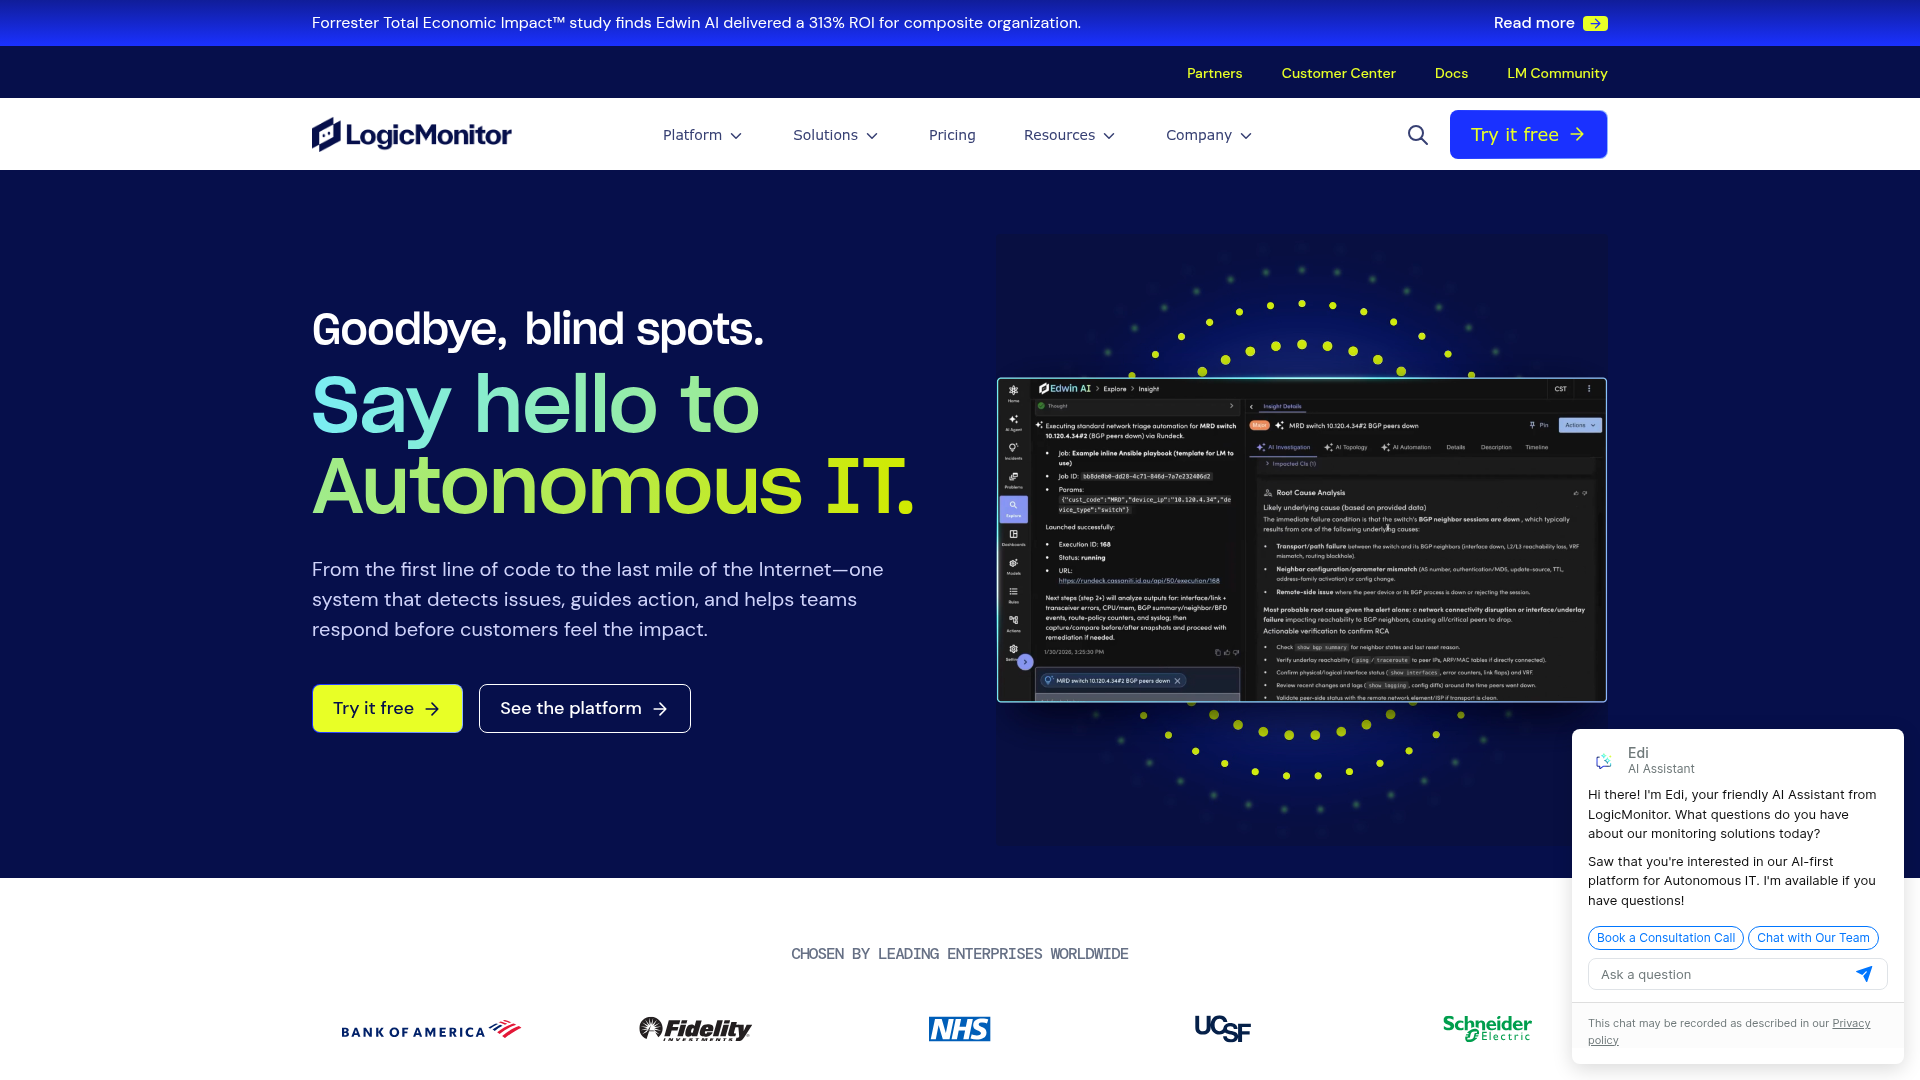
LogicMonitor is a unified, AI-powered observability platform for hybrid IT across networks, cloud services, Kubernetes, IoT, and more. Edwin AI is the agentic assistant layered on top, designed to investigate and summarize incidents inside the same workflow used for monitoring and alerting.
Best for: Mid-market IT operations teams running mixed on-prem, cloud, and network infrastructure where network monitoring matters as much as APM.
Key strengths
- Automated discovery with agentless collectors: Lightweight collectors that map infrastructure without invasive agents.
- AI-powered anomaly detection: Dynamic thresholds, usage forecasting, and Edwin AI for agentic investigation.
- 3,000+ integrations: Broad coverage across cloud, on-prem, network, VM, database, and storage.
Why choose LogicMonitor: Strongest fit when network and infrastructure monitoring matter as much as application observability. Hybrid-first architecture is a real differentiator for orgs that haven't gone cloud-only. Edwin AI brings the agentic AIOps story into a category previously dominated by traditional infrastructure monitoring.
LogicMonitor pricing: LogicMonitor lists three platform packages: Essentials at $16 per hybrid unit per month, Advanced at $27 per hybrid unit per month, and Signature + Edwin AI at $53 per hybrid unit per month. Prices are in USD and represent starting monthly list pricing based on standard minimum quantities; actual pricing varies by volume and contract terms. A 15-day free trial is available. Verify current rates on the LogicMonitor pricing page.
8. ServiceNow IT Operations Management

ServiceNow is an enterprise AI platform that brings AI, data, and workflows together across the business. ServiceNow IT Operations Management (ITOM) includes embedded AIOps capabilities tightly coupled to the ServiceNow CMDB and ITSM workflow, with Now Assist for ITOM adding generative AI for incident summarization and suggested next actions.
Best for: Large enterprises already standardized on ServiceNow for ITSM who want AIOps inside that same platform and workflow.
Key strengths
- CMDB-integrated correlation: Event correlation uses ServiceNow service maps and dependency data directly.
- Now Assist for ITOM: Generative AI summarizes incidents and suggests next actions inside ITSM tickets.
- End-to-end workflow: Detection, ticket, assignment, and resolution in one platform with no handoff to a separate ITSM tool.
Why choose ServiceNow: Only if you're already a ServiceNow shop. The integration depth with ITSM, CMDB, and change management is unmatched if you're already on the platform. Otherwise, the platform tax is high relative to AIOps-focused alternatives.
ServiceNow pricing: ServiceNow lists ITSM Foundation, ITSM Advanced, and ITSM Prime packages on its pricing page and directs buyers to a custom quote. No dollar-denominated list pricing is published. Reviewer and analyst reports suggest enterprise ITOM deployments typically land in the six-figure annual range. Request a quote on the ServiceNow ITSM pricing page.
9. IBM Cloud Pak for AIOps
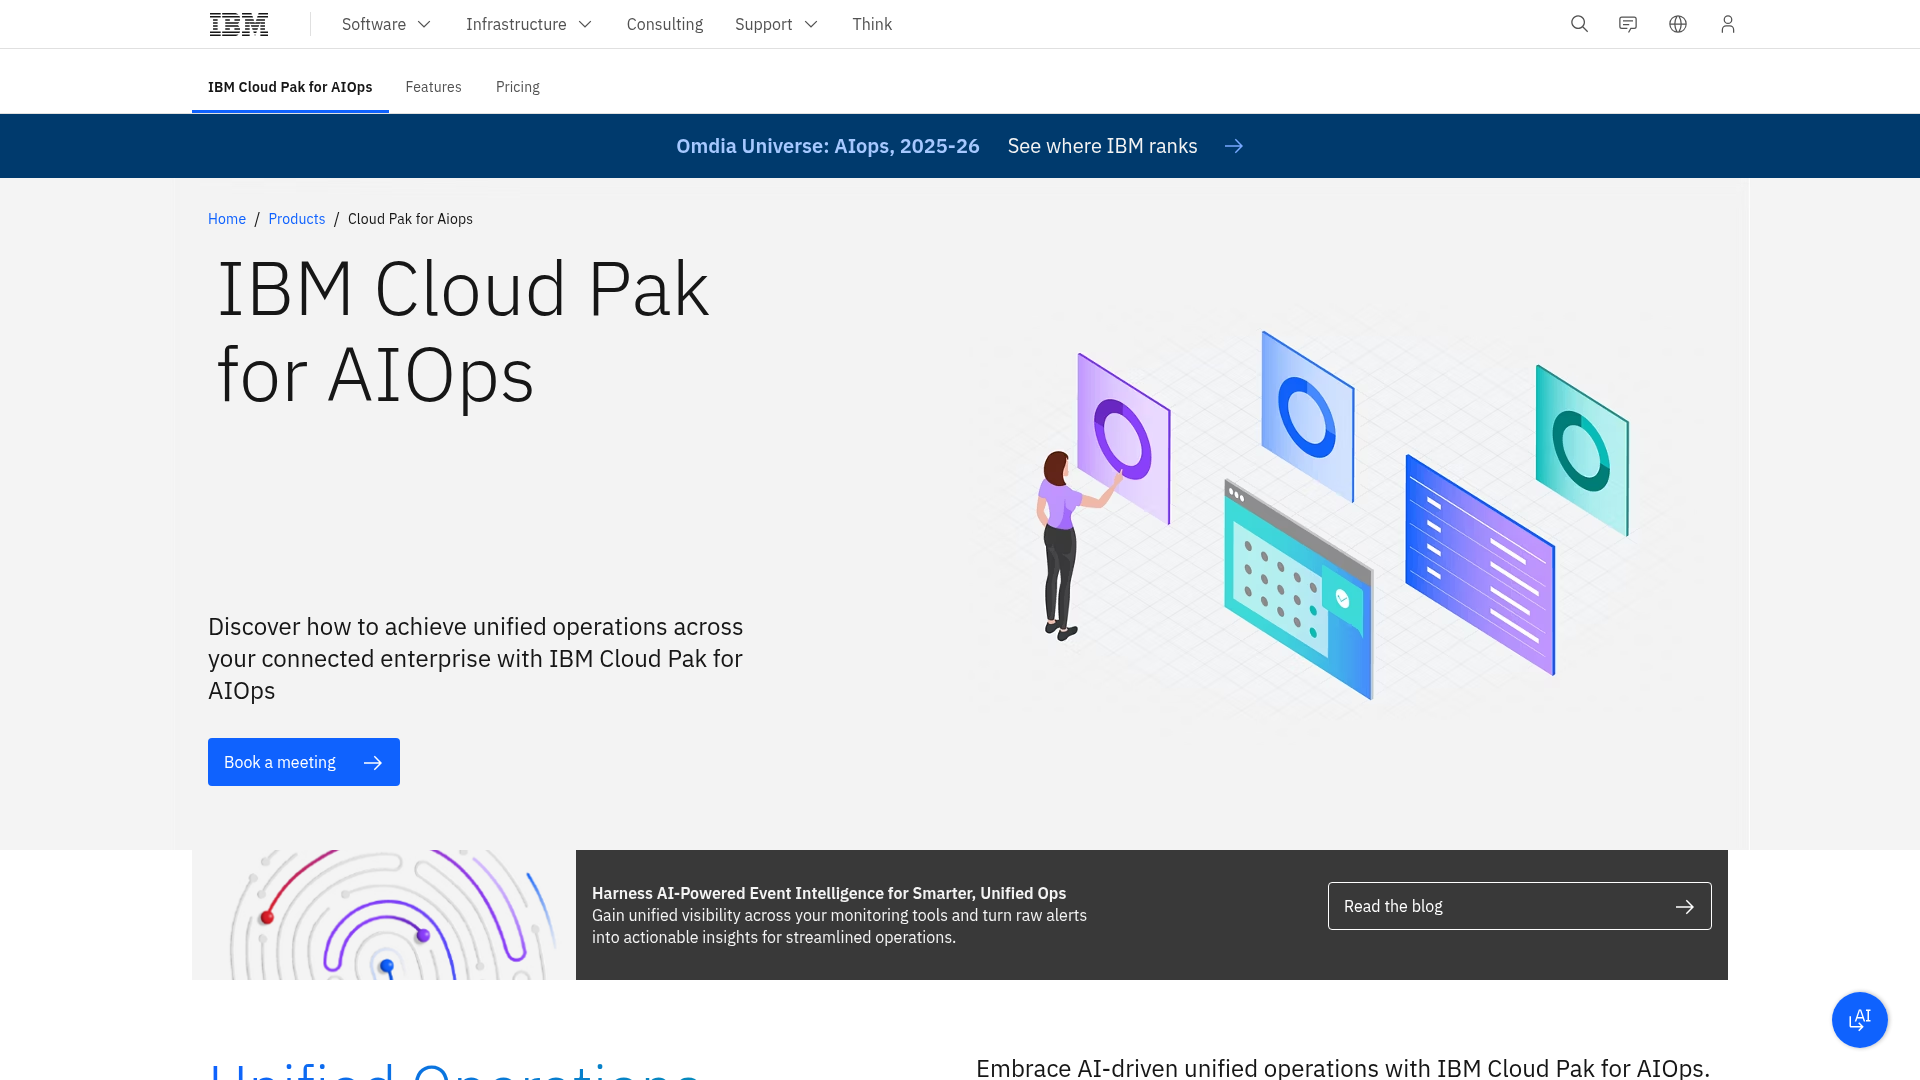
IBM Cloud Pak for AIOps is AI-driven IT operations software that centralizes monitoring, management, and automation across complex environments to accelerate incident resolution. Built on Red Hat OpenShift container platform, it brings event grouping, anomaly detection, and incident localization to multi-cloud and hybrid environments, drawing on IBM's heritage in event correlation and Watson AI.
Best for: Regulated industries and large enterprises with multi-cloud, hybrid, or mainframe environments where compliance and topology complexity dominate.
Key strengths
- Event grouping: Topology-aware correlation that maps incident impact across complex service dependencies.
- Anomaly detection: ML-based detection across telemetry and log streams.
- Incident localization: Surfaces the most likely source of an incident based on dependency graphs.
Why choose IBM Cloud Pak for AIOps: Best in genuinely complex enterprise environments with multi-cloud, regulated workloads, or significant on-prem and mainframe footprint. Overkill for SaaS-only stacks. The containerized OpenShift deployment is a strength for some buyers and an overhead cost for others.
IBM pricing: IBM describes Cloud Pak for AIOps pricing as modular, allowing customers to build a use case-specific configuration. Restricted Red Hat OpenShift is included, and financing options are referenced. No public numeric pricing is listed; deployments are typically sold on six-figure annual contracts. Request a quote on the IBM Cloud Pak for AIOps pricing page.
10. Grafana Cloud
Grafana Cloud is a managed service that removes the need to deploy, scale, upgrade, or operate your own observability stack. The AIOps story comes through Grafana ML (forecasting and outlier detection), adaptive alerting, and the LGTM stack (Loki, Grafana, Tempo, Mimir) delivered as a unified platform. For engineering-led teams committed to OpenTelemetry and open standards, Grafana Cloud is the strongest answer in this guide.
Best for: Engineering-led teams that prefer open standards (Prometheus, OpenTelemetry) and want predictable, usage-based pricing without vendor lock-in on the data layer.
Key strengths
- OpenTelemetry-native observability: First-class support for OpenTelemetry, Kubernetes Monitoring, Application Observability, and Grafana SLO.
- Grafana ML: Forecasting and outlier detection on time-series metrics, plus adaptive alerting.
- Adaptive Telemetry: Reduces noise and cost by prioritizing high-diagnostic-value data.
Why choose Grafana Cloud: Best fit for technical buyers prioritizing flexibility, open standards, and storage-based pricing predictability. The free tier is genuinely useful for evaluation, not just a marketing tier. Strongest hedge against vendor lock-in among the aiops companies in this guide.
Grafana Cloud pricing: Grafana Cloud offers a Free tier at $0, a Pro tier with a $19 per month platform fee plus pay-as-you-go usage by product area, and an Enterprise tier with custom annual pricing and a minimum commit of $25,000 per year. Built-in access policies and full RBAC are included. Verify current rates on the Grafana Cloud pricing page.
Considerations: How to evaluate AIOps vendors
A shortlist isn't a decision. Five questions to pressure-test before signing.
Integration coverage with your existing stack
Confirm the vendor supports your specific telemetry sources (logs, metrics, traces, events) and your existing monitoring tools. Don't trust the "integrations" page; ask for a working demo against your top three sources. A vendor that supports 600 integrations and a vendor that supports 60 may look identical until your specific Kafka cluster needs to be ingested. Vendors that invest in robust integration ecosystems typically surface this depth more transparently during evaluation.
Pricing model alignment
Per-host, per-user, ingest-based, and consumption-based pricing all behave very differently at scale. Model your 24-month total cost of ownership at 2x current infrastructure. A platform that looks affordable at 50 hosts can become the largest line item in your cloud budget at 300 hosts.
Quality of AI explainability
Black-box correlation creates trust problems with on-call engineers. Demand explainable correlation logic, surfaced root cause confidence, and the ability to audit why two events were grouped. Vendors typically support evaluation through guided product walkthroughs, and interactive demos from vendors give your SRE lead the fastest path to validating explainability claims before a sales-led POC. For buyers comparing several vendors at once, exploring a demo center can shorten the evaluation cycle significantly.
Time-to-value
Realistic deployment ranges from a few weeks for SaaS-native platforms with pre-built integrations to several months for complex enterprise environments with custom data sources. Ask peers, not the vendor, what onboarding actually took. First useful correlation in week one to two is a strong signal; full ROI typically takes a couple of months of tuning.
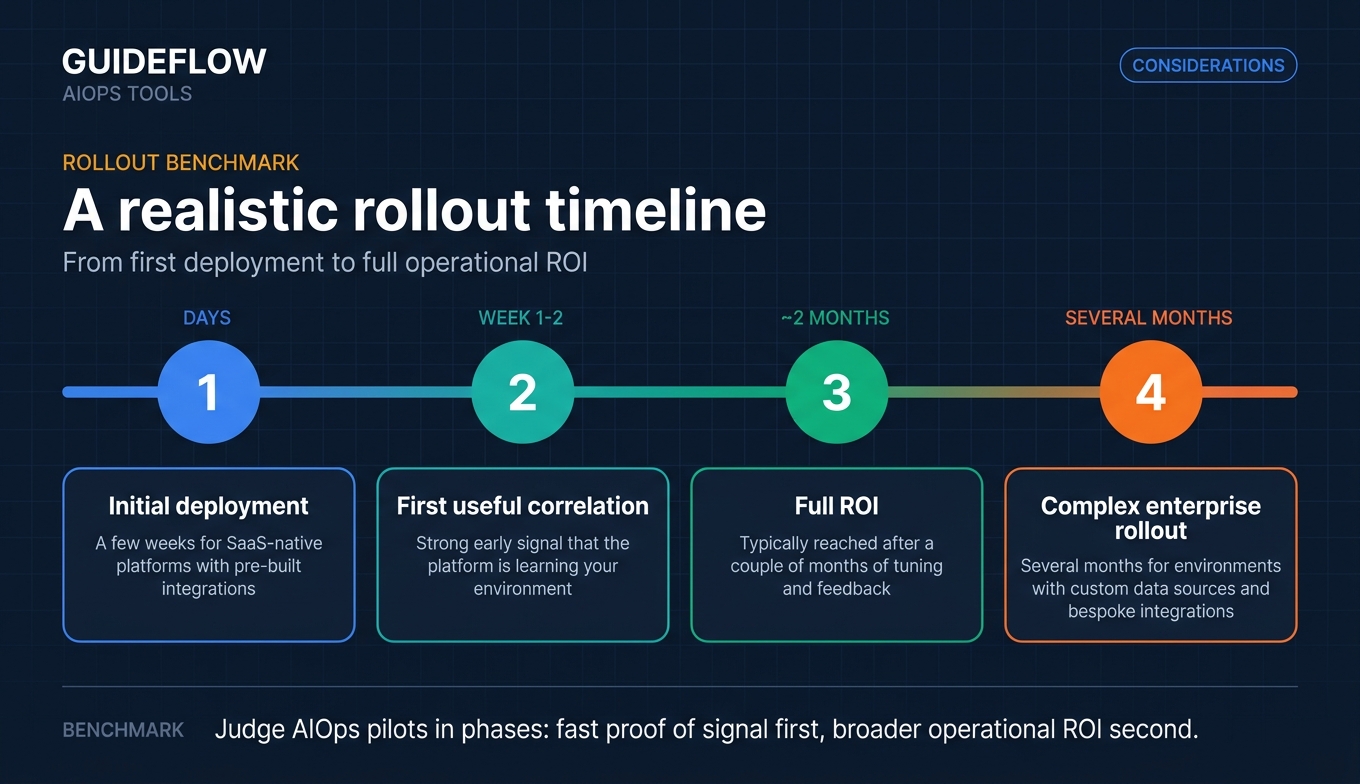
Pairing the rollout with user onboarding best practices for your SRE team can accelerate adoption.
Vendor stability and roadmap
Cisco's acquisition of Splunk reshaped the security-observability landscape. Cisco's earlier acquisition of AppDynamics did the same to APM. The aiops gartner-tracked category is consolidating, and acquisitions affect roadmaps. Factor in vendor stability and ownership when signing multi-year deals.
Conclusion
Most of the AIOps decision comes down to fit, not features.
Datadog and Dynatrace are the most commonly recommended full-platform options for cloud-native and hybrid environments respectively. BigPanda is the strongest specialist when correlation across existing monitoring tools is the actual job. Grafana Cloud is the open-standards play for engineering-led teams committed to the OpenTelemetry observability standard. PagerDuty is the right starting point when incident response and on-call workflow are the bottleneck, not telemetry coverage.
A useful next step: shortlist three vendors that match your stage and stack. Run a 30-day pilot on a single high-noise service. Measure alert reduction, MTTR delta, and on-call hours saved. Hand the pilot to your SRE lead, not yourself. The data from a focused pilot is more useful than six vendor demos and a feature matrix. If you're benchmarking related categories alongside AIOps, our roundups of the best product analytics software tools and best session replay software tools offer adjacent context for reliability and product teams.
The AIOps category is moving fast in 2026, especially on agentic AI. Pick a vendor whose roadmap matches where your team actually needs to be in 18 months, not where the demo looks best today. Teams exploring agentic capabilities more broadly may also find our guide to agentic AI tools for sales and AI orchestration platforms useful for cross-functional context.
FAQs
AIOps tools apply machine learning and increasingly agentic AI to IT operations data (logs, metrics, traces, and events) to detect anomalies, correlate incidents, identify root causes, and automate response. They typically sit on top of or alongside observability platforms, replacing static thresholds and manual triage with pattern recognition and automated workflows.
Observability is the practice of collecting and analyzing telemetry from systems to understand internal state. AIOps is the AI and ML layer that applies correlation, anomaly detection, and automation on top of that telemetry. Most modern observability platforms include AIOps capabilities, but some aiops products specialize purely on the AIOps layer without owning data collection.
Gartner's research on AIOps and event intelligence solutions consistently features Datadog, Dynatrace, Splunk, BigPanda, and ServiceNow among the key vendors. Specific quadrant placements shift annually, and the most recent Gartner reports should be referenced directly. Gartner Peer Insights AIOps reviews aggregates customer reviews that complement the analyst research.
Entry-level AIOps and observability plans often start in the low double-digits per host per month, but most vendors use hybrid usage-based pricing that scales with hosts, ingest volume, users, or events. At enterprise scale, AIOps deployments commonly reach six-figure and sometimes seven-figure annual contracts. Event-correlation specialists like BigPanda and full-platform vendors like ServiceNow are typically priced in the mid-five to six-figure annual range and above.
Grafana Cloud and the broader OpenTelemetry ecosystem offer credible open-source-rooted observability platforms with AIOps-style capabilities including anomaly detection, forecasting, and adaptive alerting. Combined with Prometheus open-source monitoring, they typically require more engineering investment than fully managed ai ops tools but offer better cost predictability and avoid lock-in on the data layer. They're a strong choice for teams with mature platform engineering.
Agentic AIOps refers to AI systems that don't just detect and correlate; they take investigative actions, query data sources, run diagnostics, and propose or execute remediations autonomously. Datadog's Bits AI, Dynatrace's Davis CoPilot, and LogicMonitor's Edwin AI are early examples. The shift from rules-based correlation to agentic investigation is the 2026 inflection point for the category.
No. AIOps tools reduce alert noise, speed up correlation, and accelerate root cause analysis, but production engineering judgment, runbook design, and architectural decisions remain human work. In most case studies, teams reallocate SRE time from manual triage to proactive reliability work rather than reducing headcount. The ROI shows up in reliability improvements and reduced burnout, not in lower payroll.
Realistic deployments range from a few weeks for SaaS-native platforms with pre-built integrations to six months or more for complex enterprise environments with custom data sources. Many teams see useful correlated incidents within the first few weeks, while meaningful operational ROI typically takes a couple of months of tuning, integration, and team adoption. Plan for both phases when budgeting and setting expectations with leadership.
Splunk is the most common choice for teams that want to converge security operations and observability on a shared data platform, particularly under Cisco ownership where SecureX integration is part of the roadmap. ServiceNow and IBM Cloud Pak for AIOps are also credible options in regulated enterprise environments where security workflows and IT operations sit in the same platform. The right choice depends on whether SIEM, observability, or ITSM is the anchor investment.