

A pipeline broke at 2am. The dashboard your CFO opens at 8am is now showing last week's numbers. Nobody knows yet. By the time someone notices, three downstream models have already trained on stale data, and a board deck has gone out with figures that are quietly wrong.
That is the failure mode data observability software exists to catch. According to Gartner, organizations estimate that poor data quality costs $12.9 million a year in lost revenue and wasted effort. The damage rarely announces itself. A schema change upstream, a freshness lag in a single table, a volume drop after a silent job failure, and the data still looks fine until someone acts on it.
The category is growing fast. Gartner predicts that 50% of enterprises adopting data observability by 2026 with distributed data architectures will adopt data observability tools, up from about 20% in 2023. The enterprise data observability market size forecast is estimated at roughly $1.4 billion in 2025, on track to reach about $3.3 billion by 2035.
So the question stops being "should we monitor our data?" and becomes "which data observability platform actually fits our stack, our budget, and the way our team works?" That is what this guide answers. Below are 11 data observability tools worth evaluating in 2026, with verified pricing where vendors publish it, real G2 ratings, and a buying framework you can apply to your own environment.
What's inside
This guide is for data engineers, analytics engineers, and data platform leads choosing a monitoring layer for their pipelines, warehouses, and BI tools. Presales and sales engineering teams at data-tooling vendors will also find it useful for technical validation and POCs. If your work spans technical buying, you may also find our roundup of the best presales software tools helpful.
We selected tools based on four criteria that matter most to a data-team buyer:
- Stack and pipeline coverage: support for your warehouse, transformation layer, and orchestration.
- Detection depth: anomaly detection plus schema, freshness, volume, and lineage monitoring.
- Root-cause and alerting workflow: how fast you go from symptom to source and who gets notified.
- Integrations and pricing transparency: ecosystem fit and a cost model that scales with your data.
TL;DR
Short on time? Here are the decision shortcuts from the list below.
- Best for full-stack enterprise coverage: Monte Carlo
- Best for warehouse-first teams wanting fast time-to-value: Metaplane
- Best for data SLAs at scale: Bigeye
- Best for checks-as-code engineering teams: Soda
- Best for dbt-centric analytics engineering: Elementary
- Best for large enterprises wanting governance plus observability: Informatica or IBM
- Best for teams already standardized on a broad observability platform: Datadog
Each pick maps to a different stack and team shape. Read the full sections before committing budget.
Background: what is data observability software?
Data observability software is a category of platforms that continuously monitor the health, quality, and reliability of data as it moves through pipelines, warehouses, and BI tools, detecting issues like freshness lags, schema changes, volume anomalies, and broken lineage before they reach downstream consumers.
Most vendors describe data health using five pillars of data observability framework. The framework is widely referenced across the modern data stack community:
- Freshness: Is the data up to date, or has a table stopped updating?
- Distribution: Are values within expected ranges, or has the data drifted?
- Volume: Did the expected number of rows arrive, or did a load silently shrink?
- Schema: Did a column type, name, or structure change without warning?
- Lineage: How do tables and columns connect, so you can trace an issue from symptom to source?
A capable data observability platform pairs those pillars with a working set of features:
- Automated anomaly detection across metrics and tables
- Schema-change monitoring and alerts
- Table- and column-level data lineage
- Root-cause analysis driven by lineage and metadata
- Alerting and incident routing to Slack, email, or PagerDuty
- SLA and SLO tracking for critical datasets
It helps to keep three adjacent ideas distinct. Data quality measures the state of data against fixed rules you already know to write. Data governance controls access, ownership, and policy. Data observability continuously watches the systems producing the data and surfaces issues you did not know to look for. And unlike application or infrastructure observability, which monitors software health through metrics, events, logs, and traces, a data observability platform monitors the data itself as it flows through your stack.
That distinction matters when you evaluate tools. Some products on this list are pure-play data observability platforms. Others are broader observability platforms or enterprise data management suites that include data observability as one capability among many. For teams weighing related analytics layers, our guide to the best product analytics software tools covers the downstream consumers that observability protects.
When to use data observability software
Not every data team needs the same depth. These three scenarios cover the most common triggers.
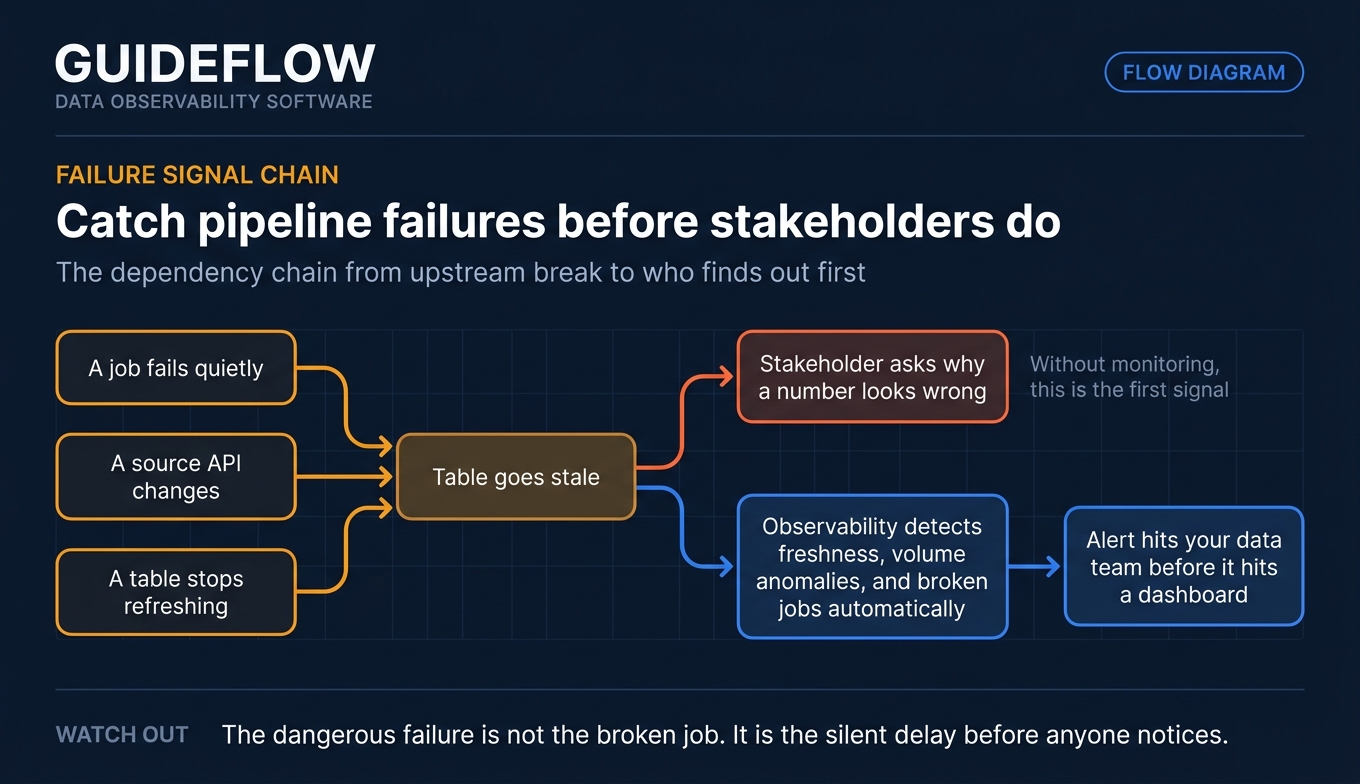
Catch pipeline failures before stakeholders do
A job fails quietly. A source API changes. A table stops refreshing. Without monitoring, the first signal is a stakeholder asking why a number looks wrong. Data observability solutions detect freshness and volume anomalies and broken jobs automatically, so the alert hits your team before it hits a dashboard. The goal is simple: you find out first, every time.
Monitor cloud and multi-cloud data stacks
Modern stacks are spread across warehouses, transformation layers, and orchestrators built on the modern data stack architecture. Leading data observability tools integrate with major cloud warehouses like Snowflake cloud data warehouse, BigQuery, and often Redshift, plus workflow tools such as dbt data transformation framework and Airflow, though exact integration sets vary by vendor. If you run a cloud or multi-cloud setup, cloud observability tools that span those services give you one place to watch data health instead of stitching together partial views.
Speed up root-cause analysis with lineage
When something breaks, the clock starts. Column- and table-level lineage lets you trace an issue from the broken dashboard back to the upstream table or job that caused it, without manually grepping through SQL. The faster you find the source, the faster you fix it, and the less time stakeholders spend distrusting the data.
Comparison table
Here is a side-by-side view of the top rated data observability software in this guide. Most vendors in this category use custom or usage-based pricing, so several entries show request-based pricing rather than a public dollar figure. Use this to shortlist the best data observability tools for your stack, then read the full sections for detail.
| # | Product | Intent | Key use case | Pricing | G2 rating |
|---|---|---|---|---|---|
| 1 | Monte Carlo | Enterprise full-stack | End-to-end observability, lineage, incident response | Credit-based, request pricing | 4.3/5 |
| 2 | Metaplane | Warehouse-native | Fast anomaly detection across modern stacks | Free; Pro usage-based; Enterprise custom | 4.8/5 |
| 3 | Bigeye | Data SLAs at scale | SLA-driven monitoring, autometrics, lineage | Request pricing | 4.1/5 |
| 4 | Soda | Checks-as-code | SQL-based data quality checks and contracts | Free; Team $750/mo; Enterprise custom | 4.4/5 |
| 5 | Elementary | dbt-native | Observability inside the dbt workflow | Seat- and environment-based, talk to us | 4.5/5 |
| 6 | Informatica | Enterprise data management | Governance plus observability in one suite | Consumption-based (IPUs), quote | 4.3/5 |
| 7 | IBM | Enterprise AI and data fabric | AI-driven governance and observability | Free; pay-as-you-go tiers | 4.4/5 |
| 8 | Sifflet | Observability plus catalog | Full-stack observability with lineage and glossary | Entry, Growth, Enterprise tiers | 4.4/5 |
| 9 | DQLabs | Quality plus observability | AI-augmented quality with no-code rules | Request pricing | 4.6/5 |
| 10 | Datadog | Unified observability | App, infra, and data signals in one platform | Free; modular per-host pricing | 4.4/5 |
| 11 | Telmai | Open architecture | ML anomaly detection on data in motion and at rest | Request pricing | 4.9/5 |
The 11 best data observability software tools
Each section below covers what the tool does, who it fits, its key strengths, why you might choose it, and verified pricing where the vendor publishes it.
1. Monte Carlo
Monte Carlo is an agent trust platform that unifies data and agent observability to monitor, troubleshoot, and improve production AI systems. It is one of the best-known names in this category and a frequent reference point when teams discuss data observability. Monte Carlo covers data, ML, agent, and performance observability in one platform, with incident triaging, root-cause analysis, and lineage across production data and AI systems.
Best for: Enterprise data, AI, and analytics teams that need observability, lineage, anomaly detection, and incident response across production data and AI systems.
Key strengths
- End-to-end observability: Monitors data, ML, agents, and performance in a single platform, so signals stay connected across the stack.
- Incident response and lineage: Pairs incident triaging and root-cause analysis with lineage to trace issues from symptom to source.
- AI-powered monitoring: Uses automated data quality monitoring and testing to surface anomalies without writing every rule by hand.
Why choose Monte Carlo: If you run a large, production-grade environment where data feeds both analytics and AI systems, Monte Carlo gives you one platform that watches all of it. It suits teams that want broad coverage and a mature incident workflow over a lightweight, single-warehouse setup.
Monte Carlo pricing: Monte Carlo lists four tiers: Start, Scale, Enterprise, and Business Critical. Customers buy credits and consume them based on consumption rates. The pricing page does not display a public dollar amount and shows request pricing, so you will need to contact the vendor for a quote tailored to your environment and data scale.
2. Metaplane
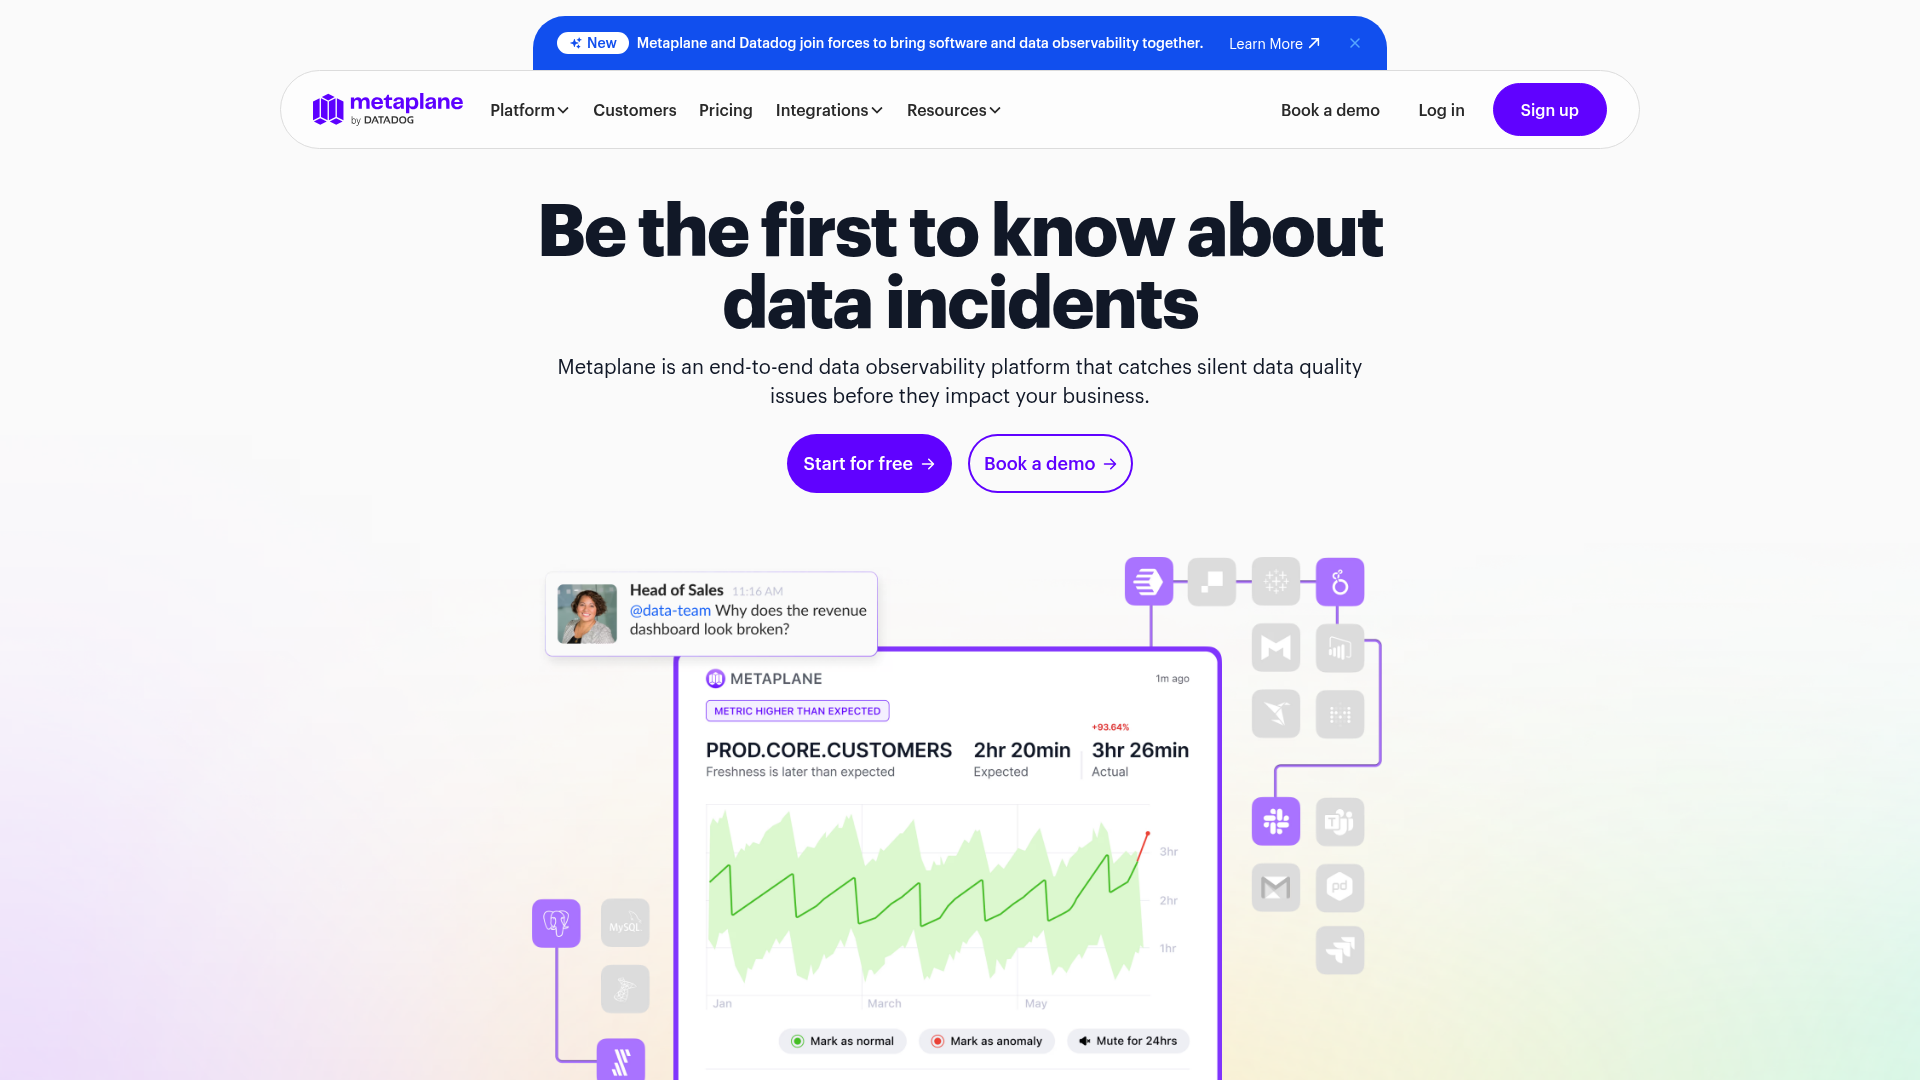
Metaplane is an end-to-end data observability platform for detecting data quality incidents, monitoring pipelines, and understanding lineage and data usage. It is warehouse-native and built for quick setup, which makes it a common pick for lean teams that want monitoring live in days rather than quarters. It fits modern stacks built around Snowflake and dbt well.
Best for: Data teams that need automated data observability, anomaly detection, lineage, and alerting across modern data stacks.
Key strengths
- Automated anomaly detection: Monitors volume, schema, freshness, uniqueness, nullness, statistical distribution, and custom SQL monitors out of the box.
- Column-level lineage: Provides lineage and impact analysis across the data stack, so you see what a change downstream will affect.
- Flexible alerting: Routes alerts via Slack, email, MS Teams, PagerDuty, API, and webhooks depending on your plan.
Why choose Metaplane: Metaplane is the strong pick when you want fast time-to-value without a heavy rollout. A small data team can stand up meaningful monitoring quickly, then scale coverage as data volume grows. Its free tier also makes it easy to validate before committing budget.
Metaplane pricing: Metaplane offers a Free plan at $0 with 10 monitored tables and 4 users. The Pro plan is usage-based, charging per monitored table with 12 users plus unlimited viewers. The Enterprise plan is custom and adds pay-per-monitored-table scaling, 12-plus users, unlimited viewers, custom integrations, SSO, and AWS or Azure PrivateLink support. Contact sales for Enterprise figures.
3. Bigeye
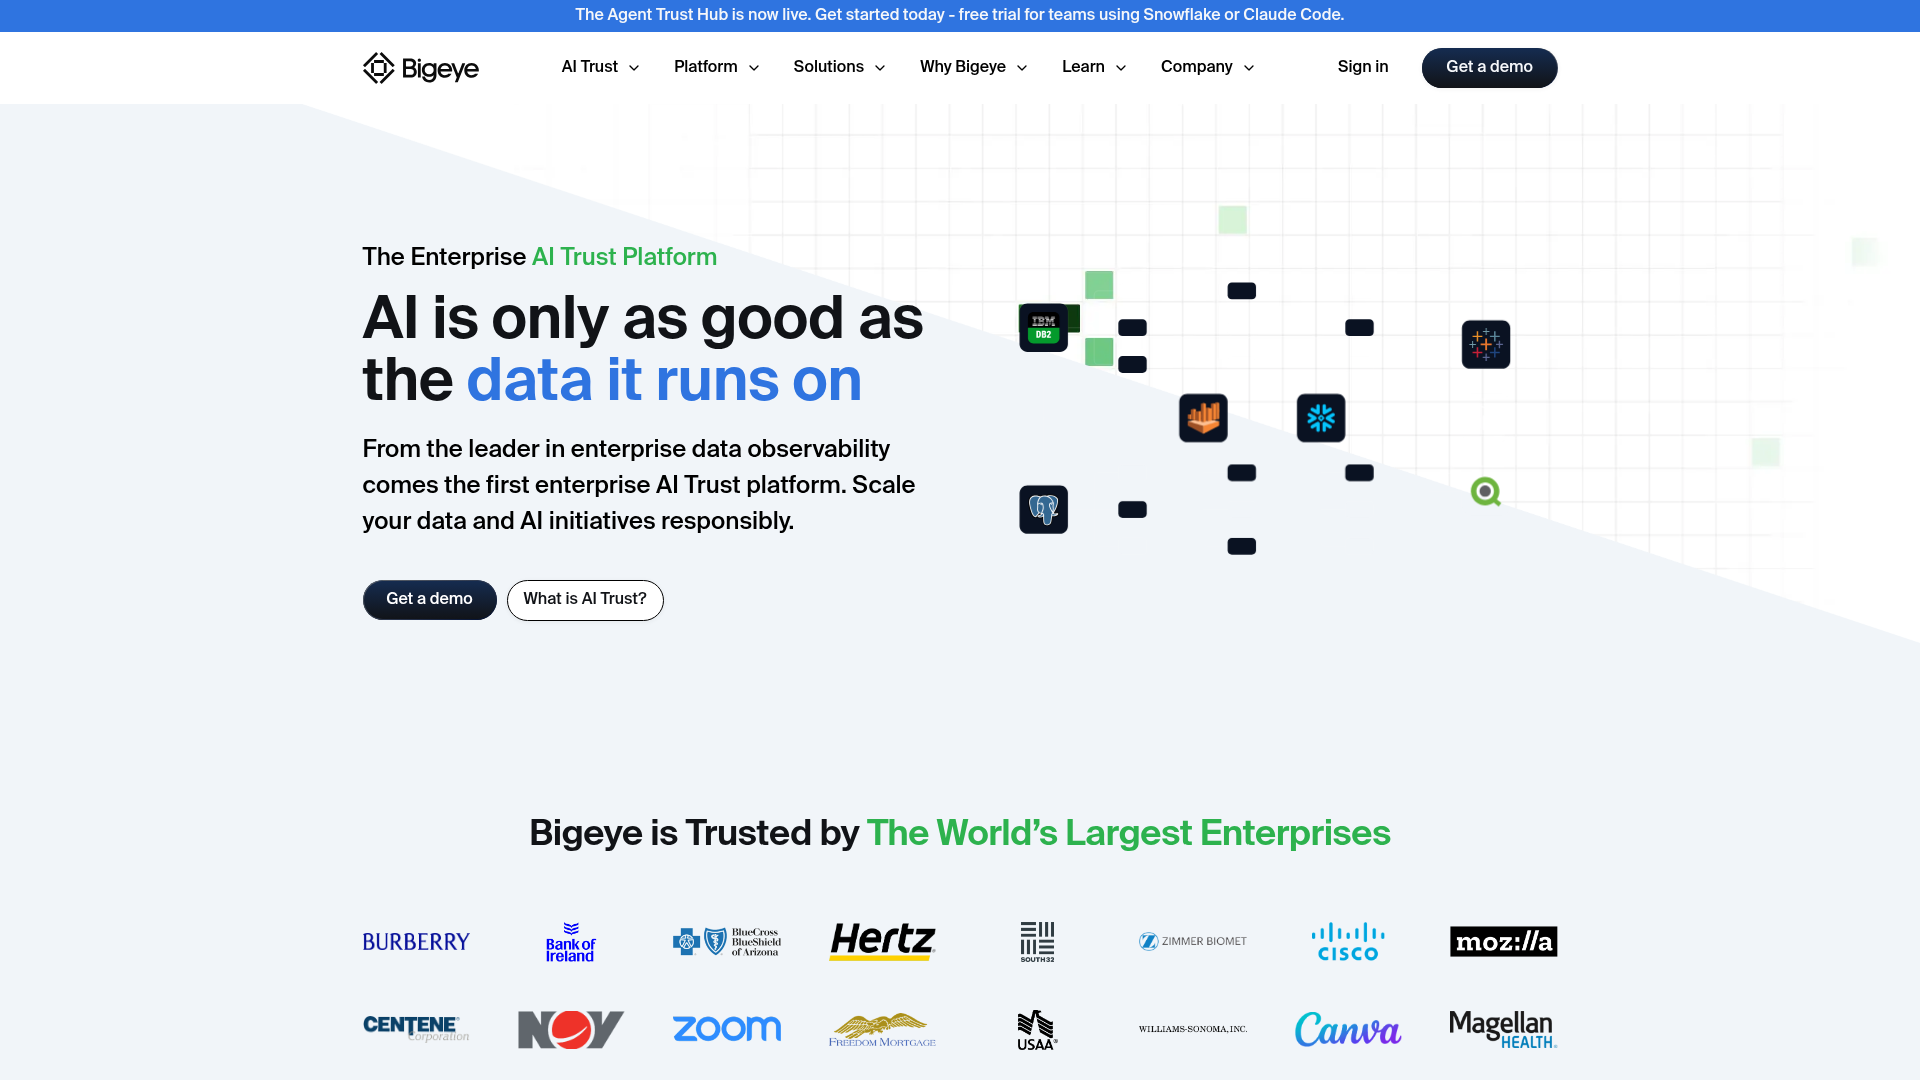
Bigeye is an enterprise AI trust and data observability platform for improving data quality, lineage visibility, sensitivity discovery, governance, and AI policy enforcement. It is built around the idea of data SLAs: defining expectations for critical datasets and monitoring against them at scale. That focus makes it a fit for teams that need to hold data to a contract.
Best for: Enterprises that need data observability, lineage, data quality monitoring, sensitive-data governance, and AI trust controls across complex data stacks.
Key strengths
- Lineage-enabled observability: Combines anomaly detection and data monitoring with lineage to speed up incident resolution.
- Sensitive data discovery: Identifies and classifies PII, PHI, PCI, and other PII and PHI sensitive data classification across your stack.
- Governance and AI controls: Adds metadata management, data governance, and AI Guardian runtime policy enforcement modules.
Why choose Bigeye: Bigeye suits teams that need broad monitor coverage tied to data SLAs, plus governance and sensitive-data controls in regulated environments. If your priority is enforcing expectations on critical datasets at scale, it is worth a close look over lighter tools.
Bigeye pricing: Bigeye does not publish public pricing or plan names on its site, and its pages emphasize demo and contact CTAs. Bigeye's terms of use reference free trials, but a public free tier could not be confirmed from a first-party pricing page. Expect a sales conversation to scope pricing to your environment.
4. Soda
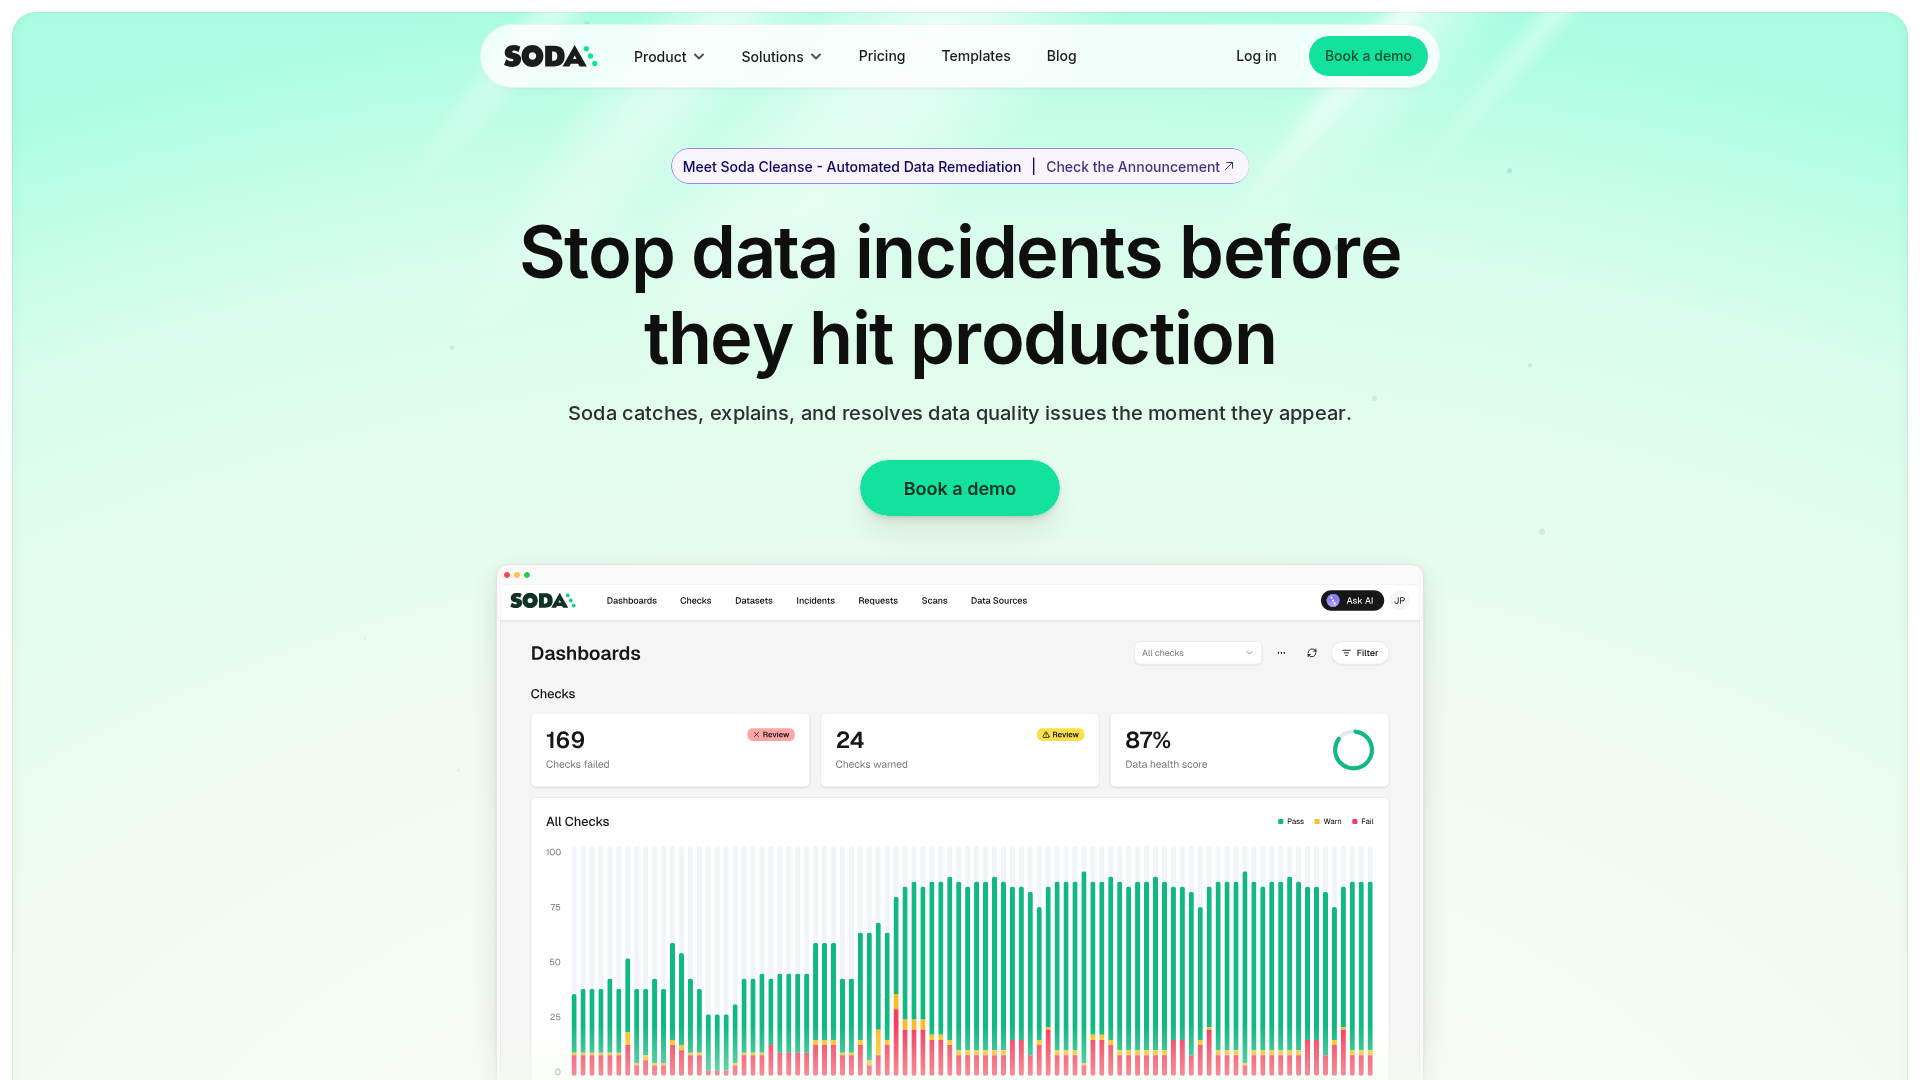
Soda is a data quality platform for finding, understanding, and fixing data quality issues across data pipelines and production datasets. Its signature is SodaCL, a checks-as-code language that lets teams define data quality rules in a SQL-like, developer-friendly way. Soda combines an open-source core with a managed cloud product.
Best for: Data engineering and governance teams that need automated data quality monitoring, pipeline testing, and collaborative data contracts.
Key strengths
- Checks as code: SodaCL lets engineers version, review, and ship data quality checks like any other code.
- Pipeline and CI/CD testing: Runs data quality checks inside pipelines and CI/CD so issues get caught before deployment.
- Collaborative data contracts: Captures producer-consumer expectations and adds metrics observability with anomaly detection and alerting.
Why choose Soda: Soda is the natural fit for engineering teams that prefer defining data quality as code rather than clicking through a UI. If your team already works in Git and YAML and wants checks living alongside their pipelines, Soda matches that workflow.
Soda pricing: Soda's Free plan is $0 per month and includes Soda Processing Units, pipeline testing, metrics observability, alerting, and ticketing integrations, with no credit card required. The Team plan is $750 per month and adds unlimited users, pay-as-you-go for additional units, catalog integrations, and add-ons. Enterprise uses custom pricing and includes collaborative data contracts, a no-code interface, advanced AI-powered features, audit logs, RBAC, private deployment, SSO, and premium support.
5. Elementary
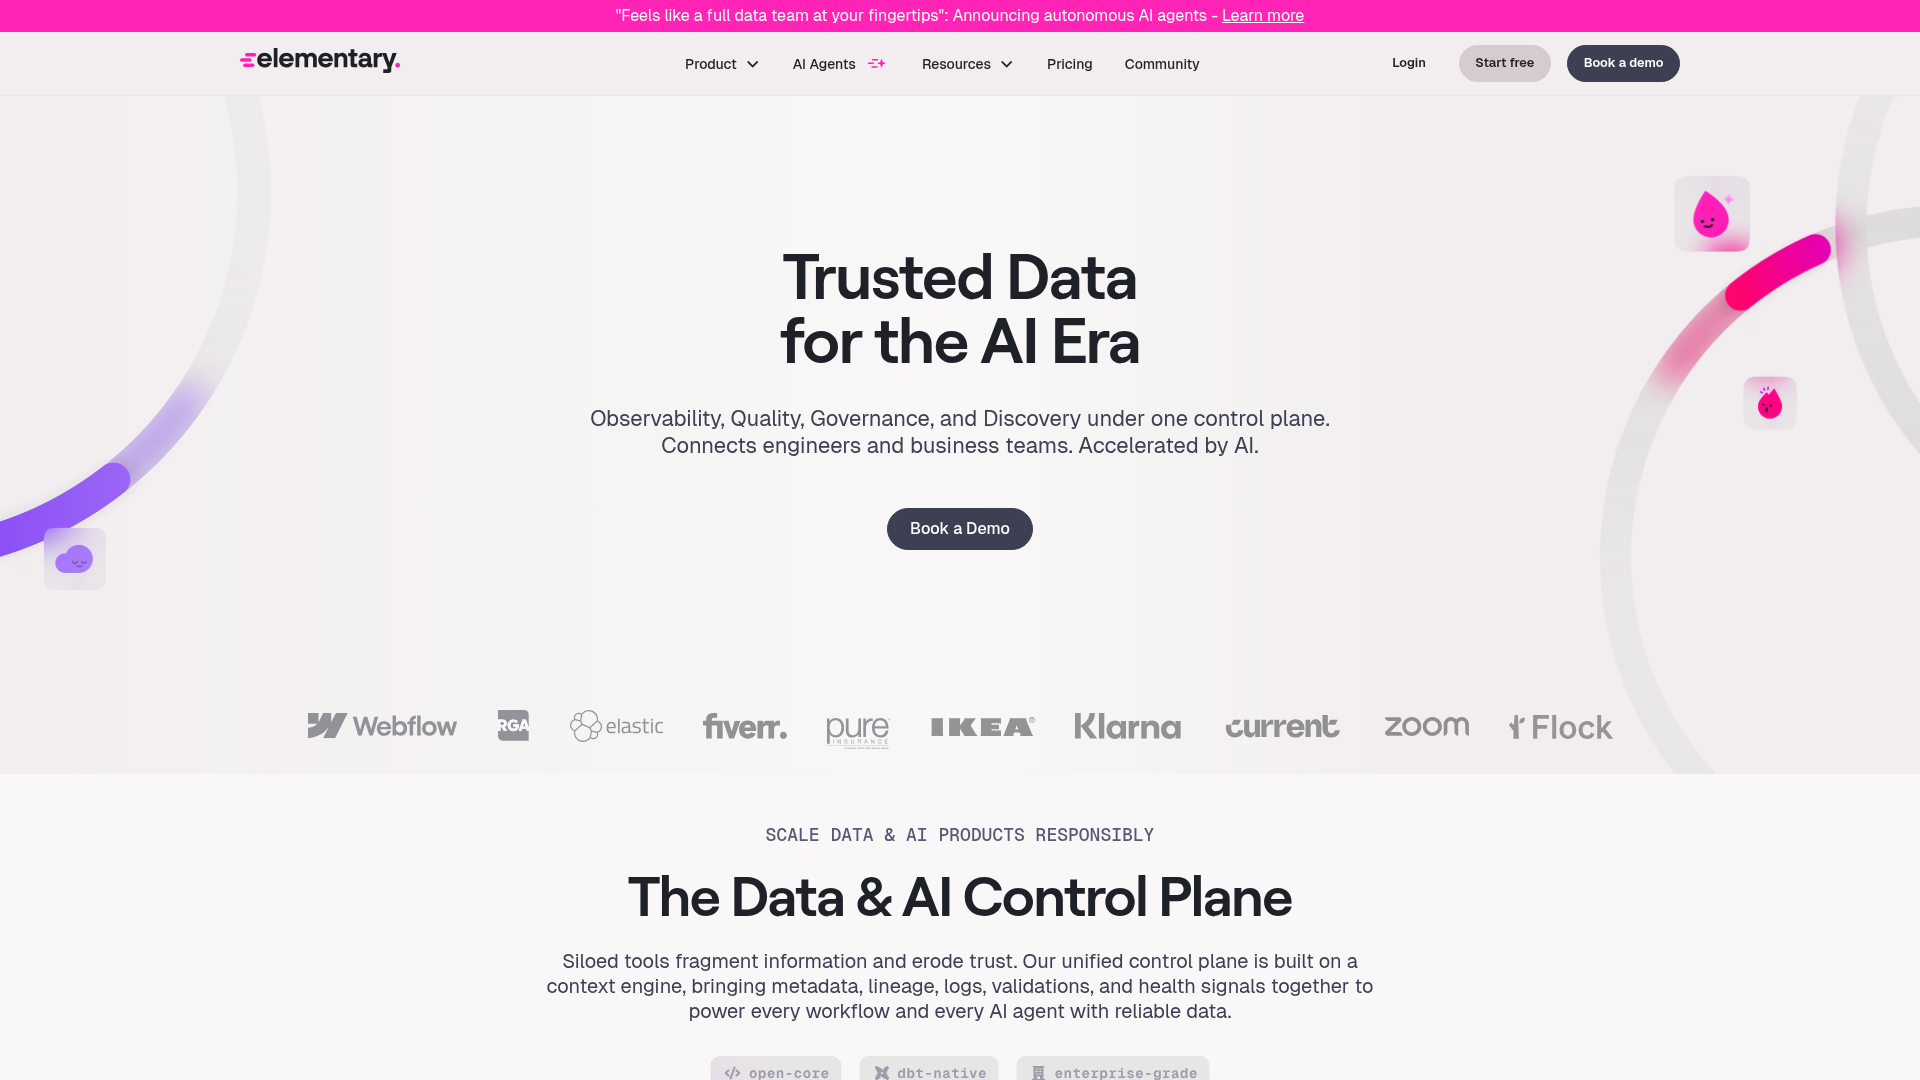
Elementary is a data observability platform for data and analytics engineers to prevent, detect, and resolve data quality issues in dbt pipelines and beyond. With open-source roots, it plugs observability directly into the dbt workflow, which makes it a natural choice for teams whose transformation layer is dbt.
Best for: Data and analytics engineering teams using dbt that need data quality monitoring, anomaly detection, lineage, and alerting.
Key strengths
- dbt-native monitoring: Automated monitors for freshness, volume, and schema changes run inside the dbt workflow analytics engineers already use.
- Anomaly detection: Covers nullness, distribution, dimensions, completeness, and more without heavy manual rule-writing.
- Lineage and dashboards: Adds column-level lineage, alerts, data tests, a catalog, performance monitoring, CI/CD, and integrations.
Why choose Elementary: If dbt is the center of your stack, Elementary keeps observability where your team already works rather than bolting on a separate tool. Its open-source roots also give teams a low-friction way to try it before adopting the cloud product.
Elementary pricing: Elementary prices by number of seats and environments. The Scale tier includes up to 10 editor seats and up to 1,000 tables, Enterprise includes up to 20 editor seats, up to 40 viewer seats, and up to 3,000 tables, and Unlimited includes unlimited editor and viewer seats with up to 3,000 tables. An AI Layer adds credit-based pricing. All plans show "Talk to us" for figures, and the pricing page mentions a 30-day free trial and a self-hosted community version.
6. Informatica
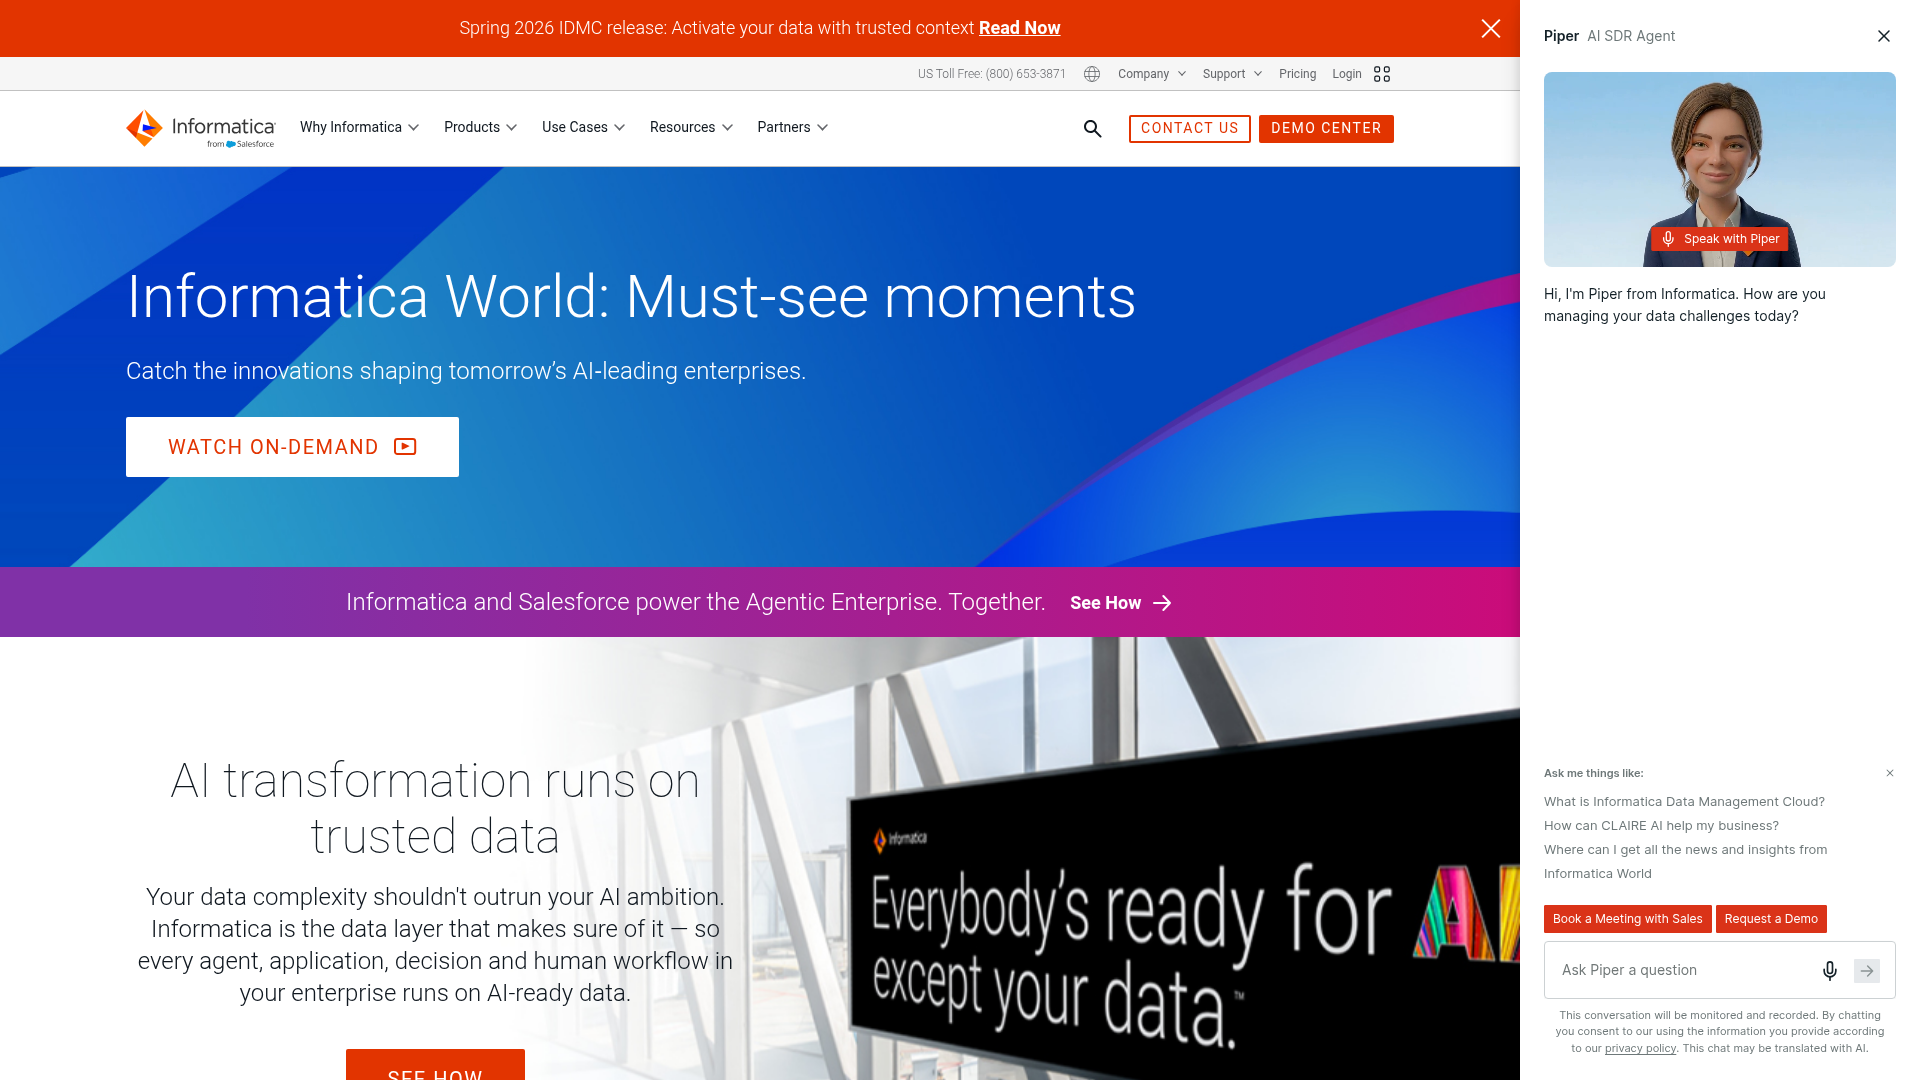
Informatica provides an AI-powered Intelligent Data Management Cloud for managing data across the enterprise lifecycle. Observability here is one capability inside a much broader suite that spans cataloging, integration, quality, governance, and master data management. That breadth is the point for large organizations consolidating tools.
Best for: Large enterprises needing trusted, governed, AI-ready data management across hybrid and multi-cloud environments.
Key strengths
- Data catalog: Discovers, classifies, organizes, and helps teams understand enterprise data at scale.
- Integration and engineering: Integrates data and applications across multi-cloud and on-premises sources.
- Quality and governance: Combines data quality, observability, governance, access, privacy, MDM, and 360 applications in one platform.
Why choose Informatica: Informatica is the fit when you want observability inside a single enterprise data management platform rather than as a standalone tool. Large, regulated organizations that already lean toward consolidation get governance and observability under one roof.
Informatica pricing: Informatica uses consumption-based pricing built on Informatica Processing Units (IPUs), with volume-based and pay-for-what-you-need usage and AI-powered optimization. The pricing page directs users to request a quote or sample price range rather than displaying public figures. Expect quote-based pricing scoped to your usage.
7. IBM
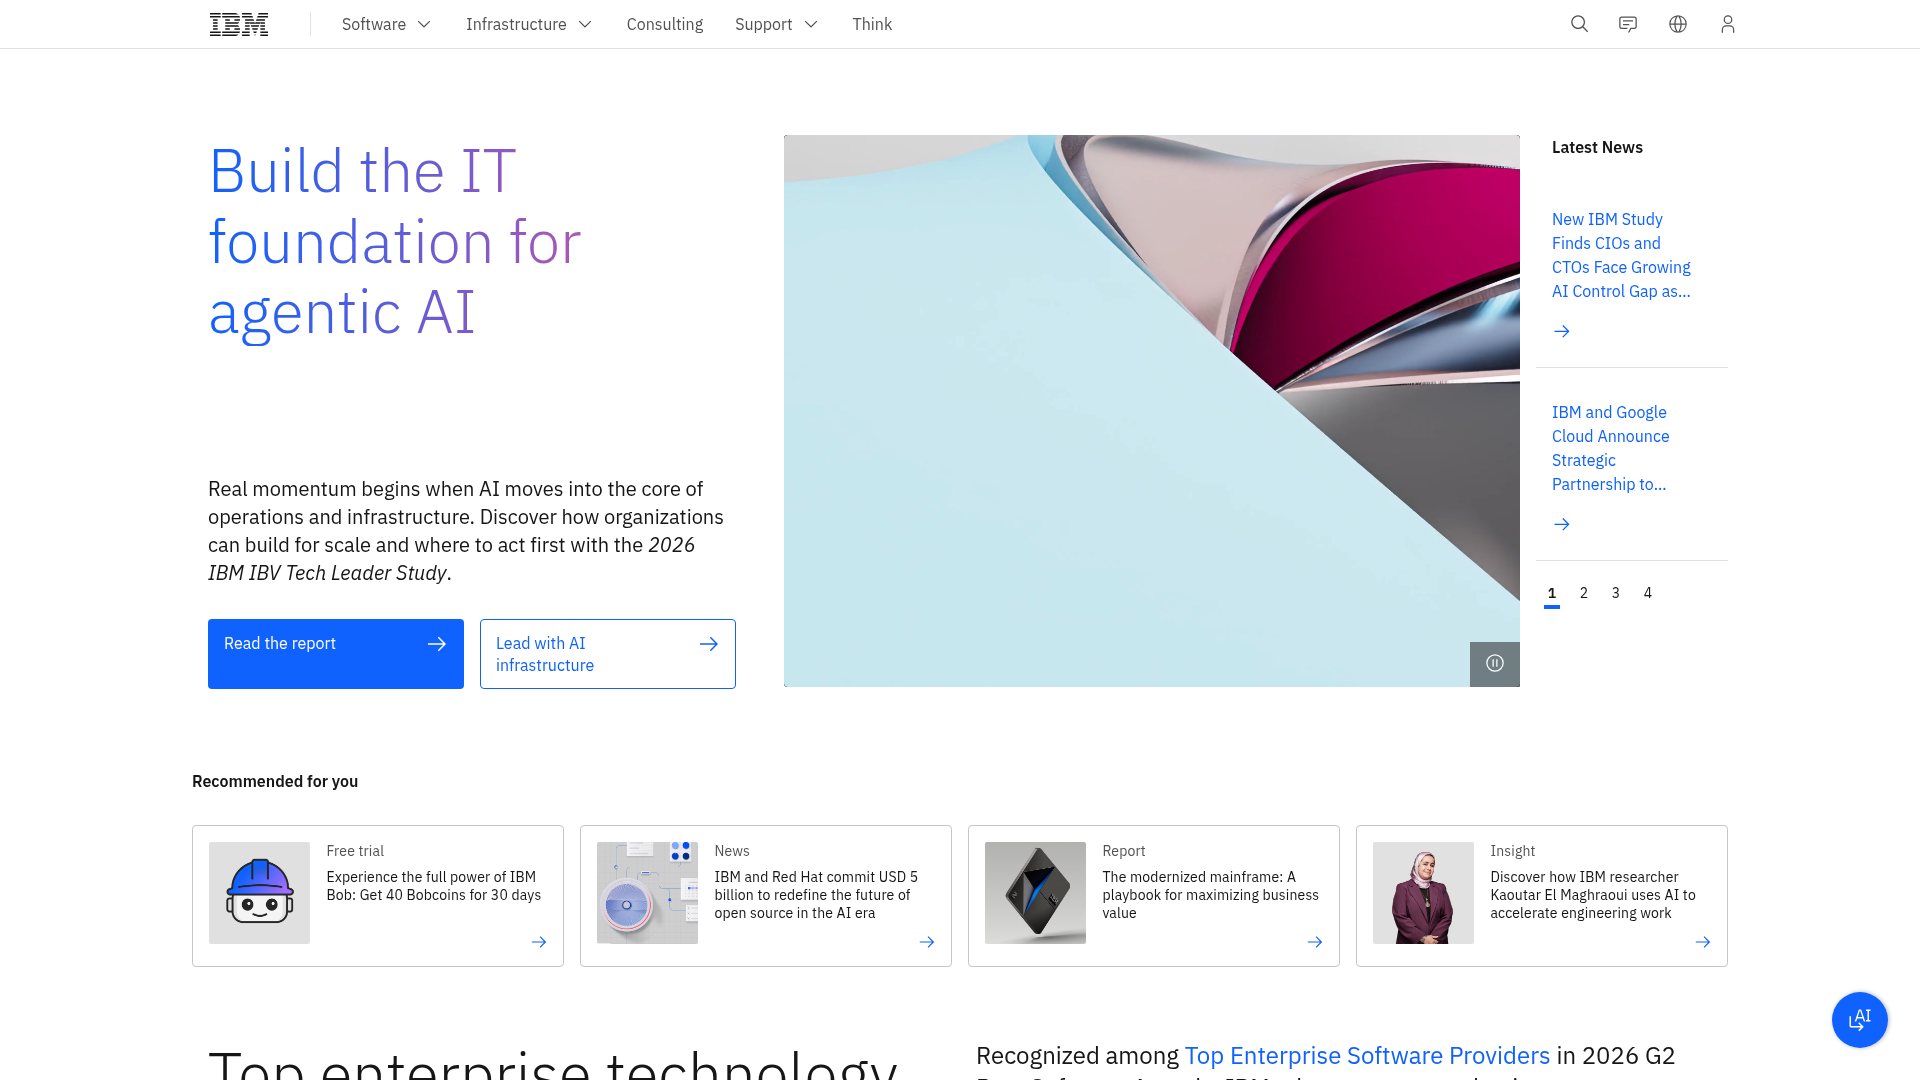
IBM offers enterprise-grade, AI-driven data and AI capabilities as part of its broader data fabric and governance portfolio. IBM watsonx.ai is an integrated, end-to-end AI development studio for building, testing, tuning, and deploying enterprise AI, and observability and governance sit alongside it within IBM's wider data strategy. This is a fit for organizations already standardized on the IBM stack.
Best for: Enterprise teams building and deploying governed generative AI, foundation-model, RAG, and machine-learning applications.
Key strengths
- AI agent development: Build and deploy AI agents within a governed enterprise environment.
- Model customization: Tune and adapt foundation models to your data and use cases.
- RAG development: Build retrieval-augmented generation applications on enterprise data.
Why choose IBM: IBM is the natural choice for large, regulated enterprises already invested in its data fabric, where governance and AI readiness matter as much as monitoring. It fits organizations that want their observability and AI development inside one enterprise portfolio.
IBM pricing: IBM watsonx.ai lists a Free plan, an Essentials pay-as-you-go tier starting at USD 0 per month for production deployments, and a Standard pay-as-you-go tier starting at USD 1,110 per month for enterprise production. IBM marks these prices as indicative, noting they may vary by country, taxes, duties, and offering availability.
8. Sifflet
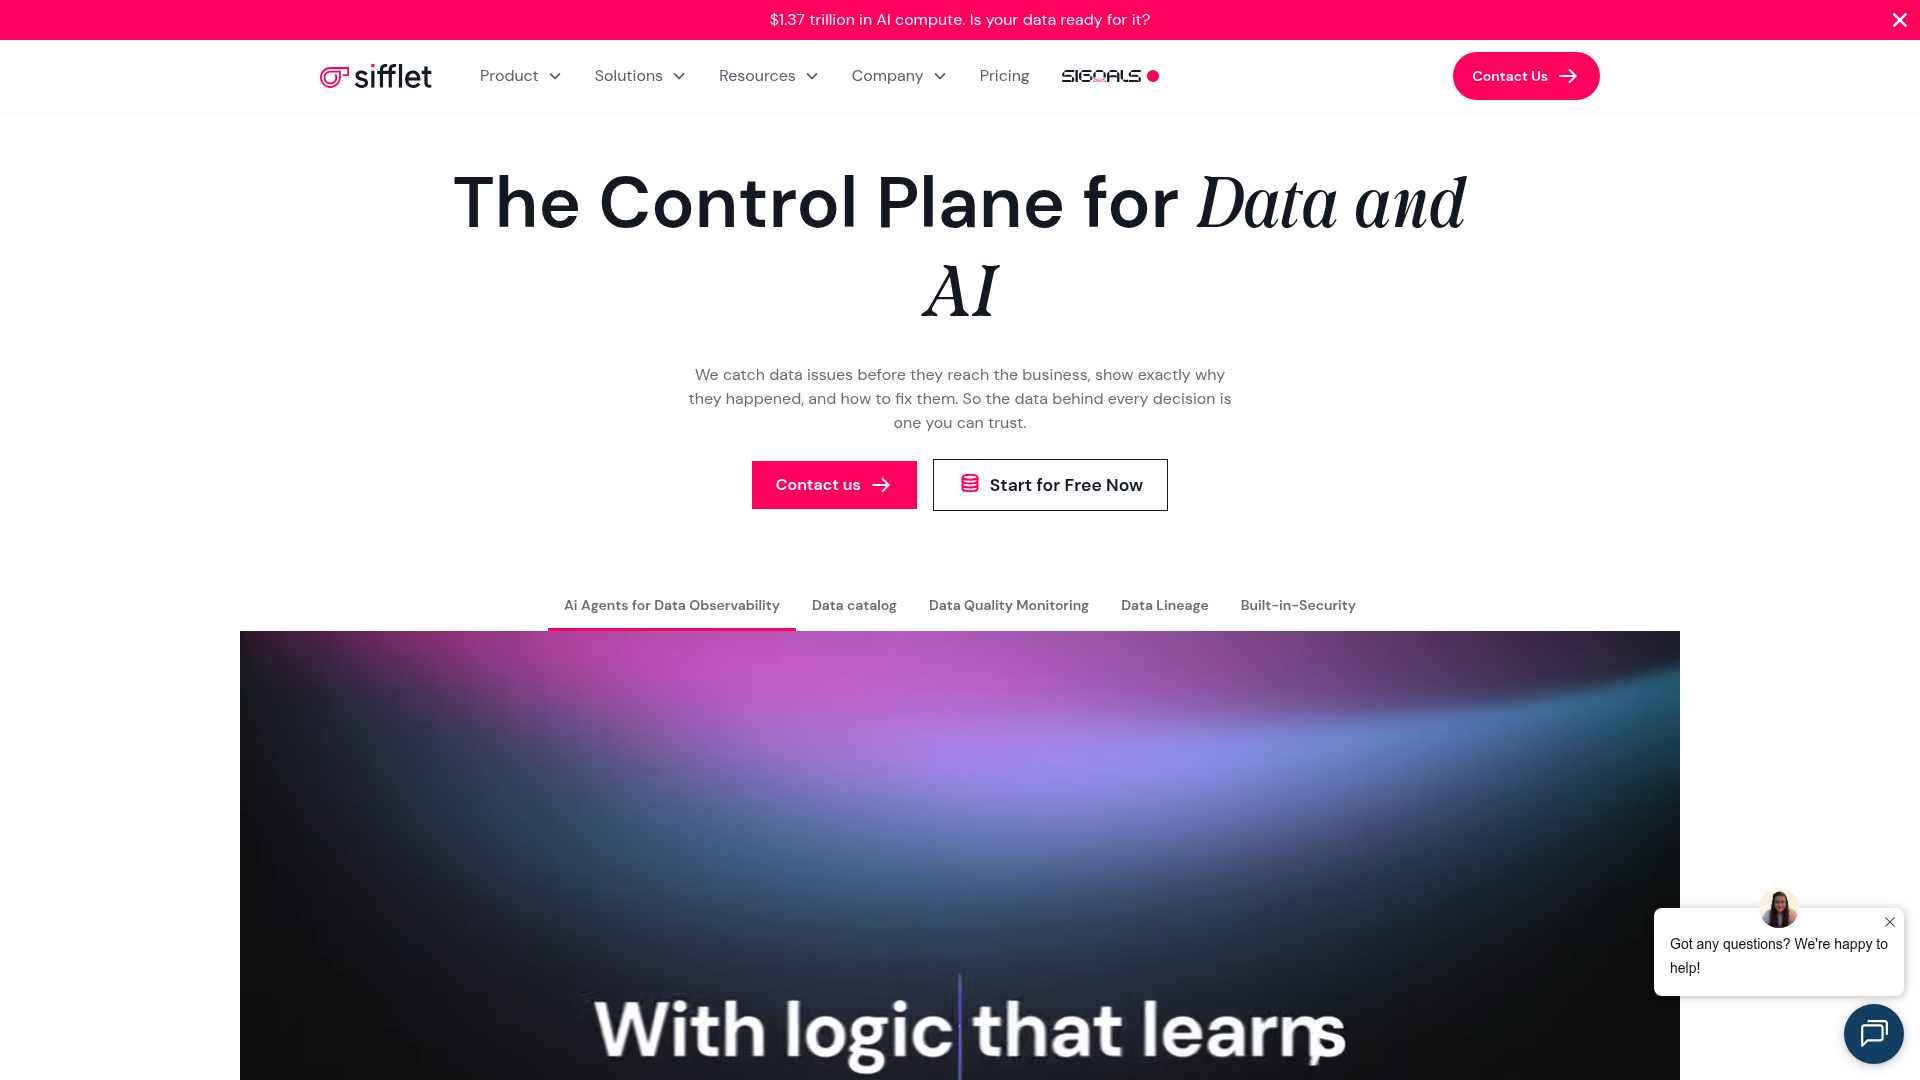
Sifflet is an AI-augmented, full-stack data observability platform for monitoring data quality, lineage, incidents, and governance across modern data stacks. What sets it apart is pairing observability with a data catalog and business glossary, so technical issues connect to business context. That makes it useful when you want observability and discovery in one place.
Best for: Data teams that need data observability, lineage, monitoring, and incident triage across complex or regulated data environments.
Key strengths
- Data catalog: Search and adopt data assets across the organization from one place.
- Quality monitoring: Out-of-the-box and custom monitors track data quality across the stack.
- Business-aware lineage: Lineage and impact analysis tie technical changes to business meaning.
Why choose Sifflet: Sifflet suits teams that want observability and a catalog together rather than buying and integrating them separately. Its business-aware lineage helps bridge the gap between data engineers and the business stakeholders who consume the data.
Sifflet pricing: Sifflet lists Entry, Growth, and Enterprise tiers. Entry covers up to 500 monitored assets, Growth up to 1,000, and Enterprise covers 1,000-plus assets with flexible scaling. The pricing page shows asset limits but no public price numbers, so contact the vendor to scope a quote.
9. DQLabs
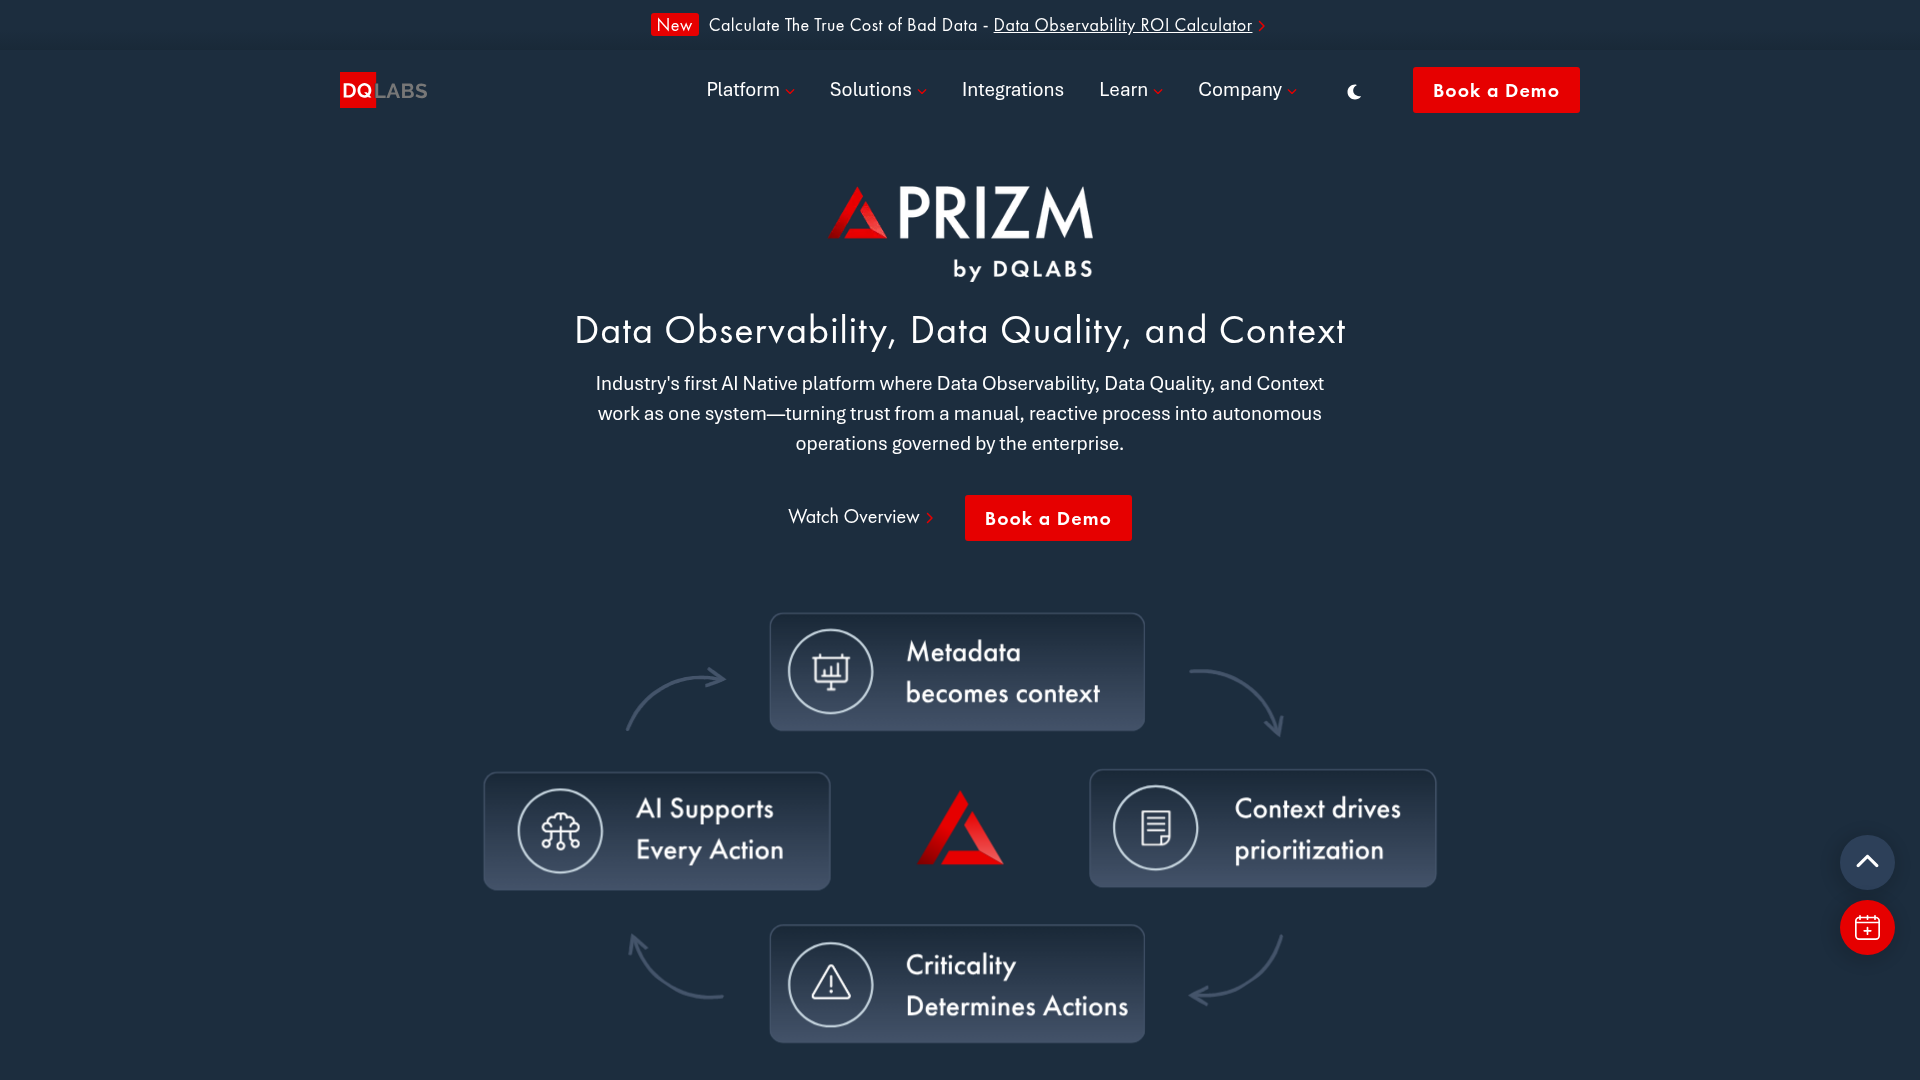
DQLabs offers Prizm, an AI-native enterprise platform for data observability, data quality, and context. It blends quality and observability with a strong emphasis on no-code rule authoring, which lowers the barrier for teams that do not want to script every check. That mix appeals to organizations bridging data quality and observability work.
Best for: Enterprises needing unified data observability, data quality, and context for trustworthy analytics and AI-ready data.
Key strengths
- Data observability: Monitors freshness, schema, volume, cost, and performance anomalies.
- Data quality: No-code rule authoring, AI recommendations, quality scoring, SLAs, and scorecards.
- Context platform: Automated discovery, classification, tagging, business glossary, semantics, and lineage.
Why choose DQLabs: DQLabs is the pick when you want data quality and observability unified, with no-code rules so non-engineers can contribute. Teams looking to make data AI-ready while keeping rule-building accessible will find the balance useful.
DQLabs pricing: DQLabs does not publish public pricing figures or a first-party pricing page. Pricing, tiers, and free-tier availability are not disclosed, so you will need to contact the vendor for a quote scoped to your environment.
10. Datadog
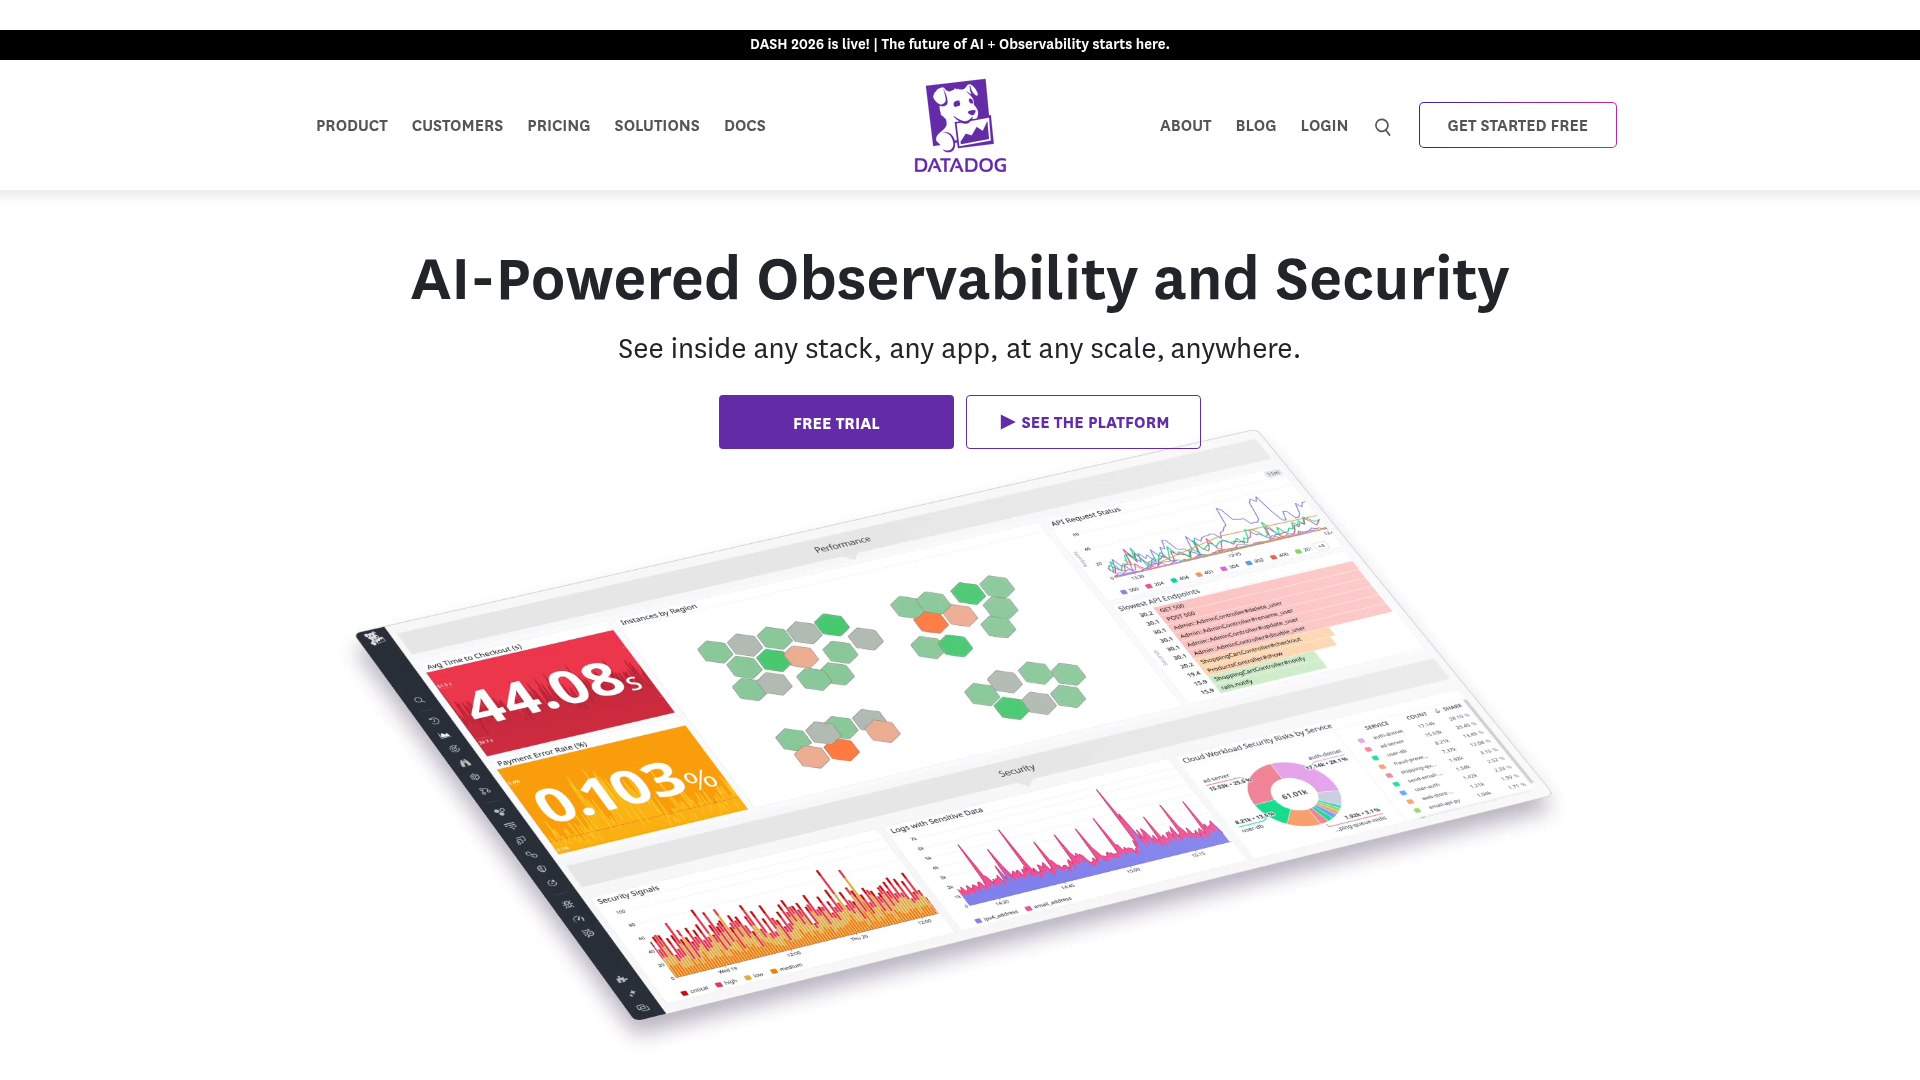
Datadog is an integrated monitoring, security, and analytics platform for observing infrastructure, applications, logs, user experience, networks, and cloud environments. Its Data Observability product helps teams unify application, infrastructure, and data signals in one platform, tracing issues from pipelines and warehouses through to downstream services. Datadog is a broad observability platform that includes data observability features, not a pure-play data observability vendor.
Best for: Engineering, DevOps, SRE, and security teams that need unified observability across cloud infrastructure, applications, logs, networks, and user experience.
Key strengths
- Infrastructure monitoring: 1,000-plus integrations and out-of-the-box dashboards across your environment.
- Application performance monitoring: Distributed tracing and service health metrics for application observability.
- Log management: Search, filter, analyze, and correlate across logs, metrics, and traces.
Why choose Datadog: Datadog is the fit when your organization already standardizes on it for application and infrastructure observability and wants data signals in the same place. Unifying app, infra, and data telemetry under one platform reduces tool sprawl for teams committed to Datadog.
Datadog pricing: Datadog publishes modular product pricing. Infrastructure starts with a Free plan at $0 for up to 5 hosts with 1-day metric retention. The Pro plan is $15 per host per month billed annually, or $18 on-demand. Enterprise is $23 per host per month billed annually, or $27 on-demand. DevSecOps infrastructure bundles start at $22 per host per month billed annually. Data observability is one of several modular products layered on top.
11. Telmai
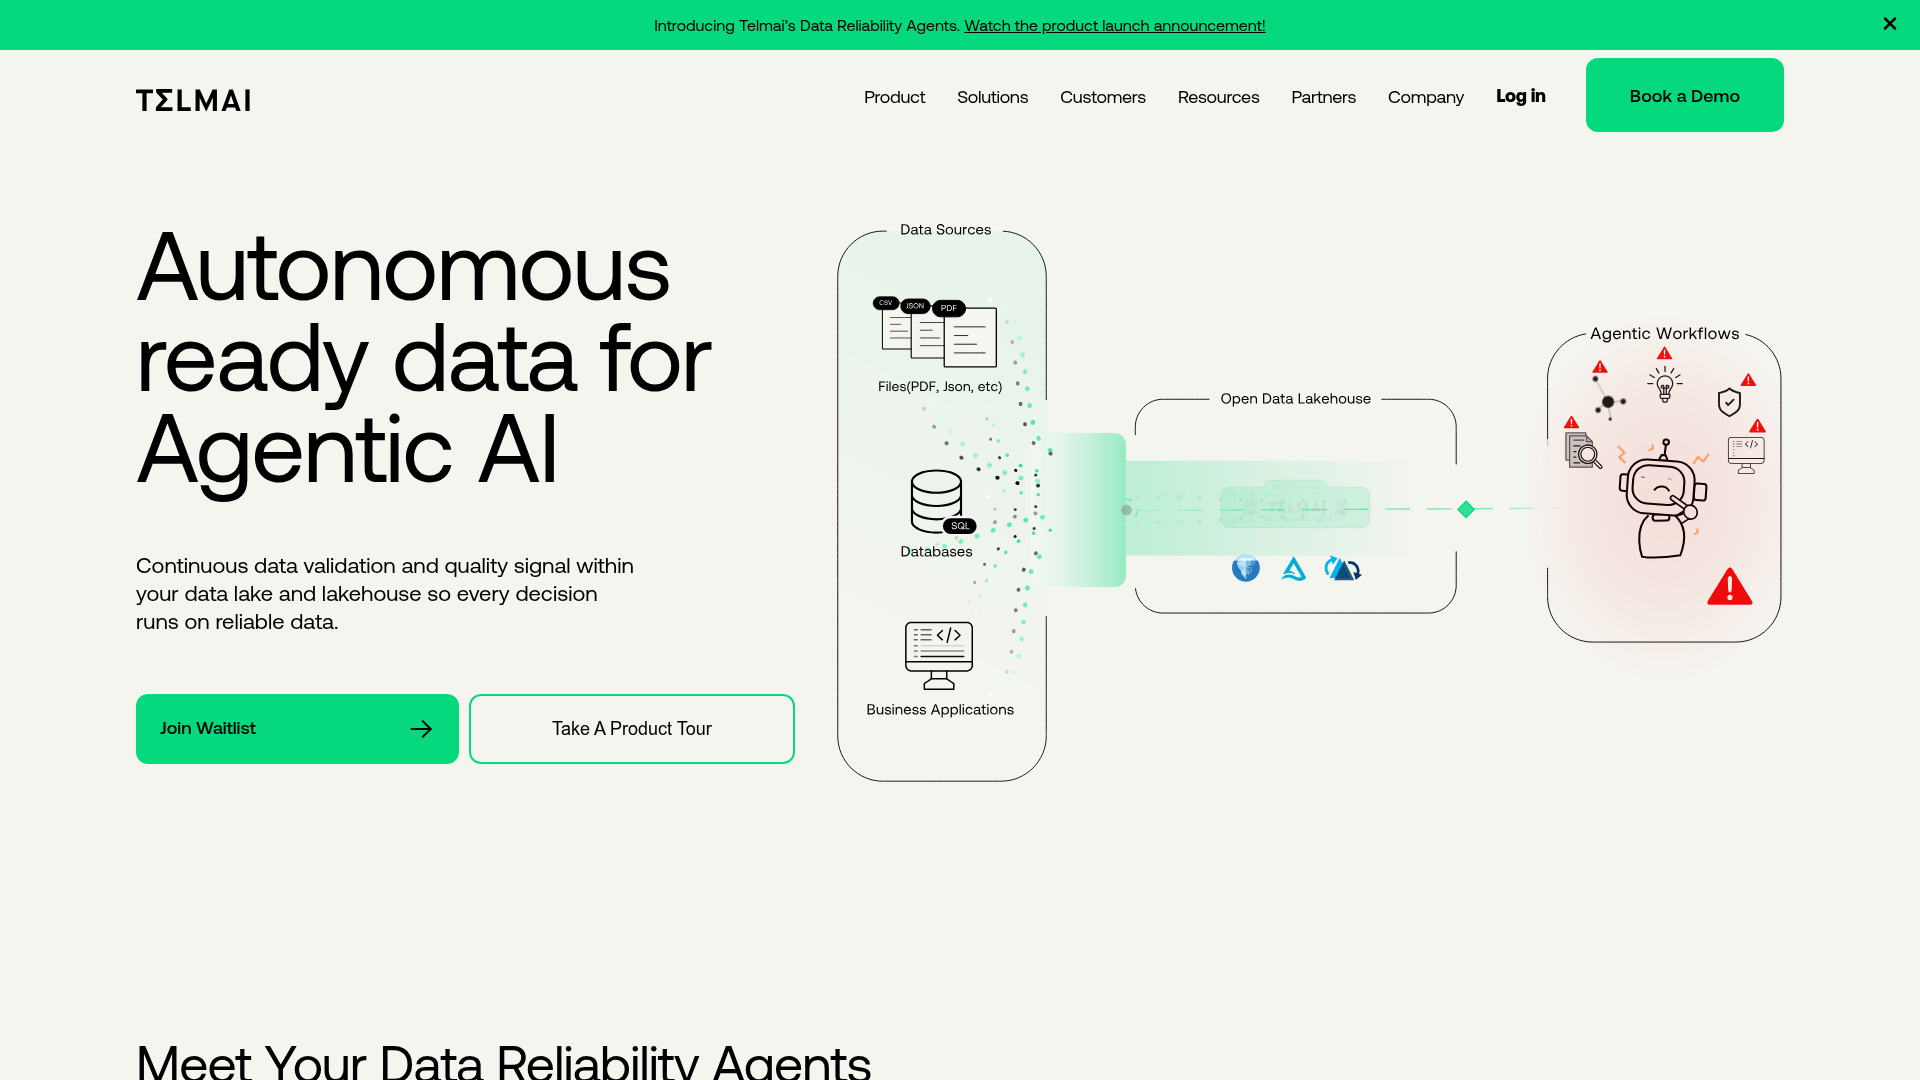
Telmai is an AI-based data observability and data reliability platform for continuously validating and monitoring data across pipelines, data lakes, lakehouses, and AI workflows. Its open architecture and focus on both data in motion and data at rest make it a fit for teams with diverse or streaming sources that other tools handle less cleanly.
Best for: Enterprise data teams that need proactive AI/ML-driven data quality, anomaly detection, and observability across complex modern data pipelines.
Key strengths
- Automated quality monitoring: Tracks KPIs like completeness, correctness, uniqueness, timeliness, validity, and accuracy.
- ML-based anomaly detection: Catches data drifts, outliers, schema drifts, completeness issues, and pattern changes.
- Open architecture: Integrates with data lakes, lakehouses, warehouses, streams, catalogs, and REST API workflows.
Why choose Telmai: Telmai is the strong pick when your data lives across streaming and batch sources, not just a single warehouse. Its open architecture and ML-based detection suit teams whose pipelines span lakes, lakehouses, and streams.
Telmai pricing: Telmai does not publish public pricing on its site, and its pages emphasize booking a demo. Pricing, tiers, and free-tier availability are not disclosed, so expect to contact the vendor for a quote scoped to your data sources and scale.
Considerations: how to choose data observability software
A shortlist is only useful if you know what to weigh. Here is the buyer's checklist to run before you commit.
Stack and warehouse coverage
Confirm the platform supports your warehouse (Snowflake, BigQuery, or Redshift), your transformation layer (dbt), and your orchestration (Apache Airflow orchestration). A tool that covers most of your stack but misses a critical source leaves a blind spot exactly where you can least afford one. Check the vendor's integrations page against your actual environment.
Detection depth
Anomaly detection alone is not enough. Look for coverage across all five pillars: freshness, distribution, volume, schema, and lineage. The deeper the detection, the more unknown-unknown issues you catch before they reach a dashboard or model.
Root-cause and incident workflow
When something breaks, how fast can you trace it to the source? Lineage-driven root-cause analysis, alert routing to Slack or PagerDuty, and a clear triage flow separate a tool that just alerts from one that actually helps you fix issues quickly.
Integrations and ecosystem fit
Check how the platform connects to your CI/CD, data catalogs, BI tools, and notification channels. The more it fits the way your team already works, the higher adoption will be. Technical buyers often validate this fit hands-on, the same way presales teams at software vendors use interactive demos to let evaluators test a product against real requirements before signing.
Pricing model and scalability
Decide whether usage-based, seat-based, or custom pricing fits how your data volume will grow. A model that looks cheap at current scale can balloon as monitored tables multiply. Map the pricing to your 12-month data growth, not just today's footprint. Vendors that want evaluators to grasp this quickly often build a live demo that walks through pricing scenarios in context.
Conclusion
The right data observability platform depends on your stack, your scale, and how your team prefers to work. For broad enterprise coverage across data and AI systems, Monte Carlo is the most complete option. Warehouse-first teams wanting fast time-to-value should start with Metaplane, which offers a free tier to validate before spending. dbt-centric analytics engineering teams will feel at home with Elementary, while engineering teams that want checks-as-code should evaluate Soda, also free to start.
If governance matters as much as monitoring, Informatica and IBM bring observability inside larger enterprise data management and AI portfolios. Teams already standardized on a broad observability platform can extend Datadog to cover data signals. And for diverse or streaming sources, Telmai's open architecture is worth a look.
The best next step is to shortlist two or three tools that match your stack, then run a hands-on trial against your real pipelines. Many of these vendors let you explore the product first through a demo center before booking time with sales. If you are warehouse-first and want to move fast, start with Metaplane's free plan and see how quickly meaningful monitoring goes live in your environment. For teams researching adjacent analytics layers, our roundups of the best marketing analytics software and the best sales analytics software tools are useful companions.
FAQs
Data observability software continuously monitors the health of your data, including freshness, volume, schema, distribution, and lineage, to catch and resolve issues before they reach downstream users. It detects problems like stale tables, schema drift, and volume anomalies automatically. The goal is to find and fix data issues before a stakeholder notices a dashboard is wrong.
The five pillars are freshness, distribution, volume, schema, and lineage. Freshness tracks whether data is up to date. Distribution checks whether values fall within expected ranges. Volume confirms the expected number of rows arrived. Schema watches for structural changes, and lineage maps how tables and columns connect so you can trace issues to their source.
Data quality measures the state of your data against rules you already know to write, like "this column should never be null." Data observability continuously monitors the systems and pipelines producing that data, surfacing unknown-unknown issues you did not think to test for. Quality checks catch what you anticipate; observability catches what you do not.
Application and infrastructure observability monitors software and systems health through metrics, events, logs, and traces. Data observability monitors the data itself as it flows through pipelines and warehouses. One tells you whether your services are running; the other tells you whether the data those services produce can be trusted.
Pricing spans free and open-source options, mid-market SaaS plans that often scale with data volume or monitored assets, and custom enterprise contracts for large deployments. Many vendors use usage-based or quote-based pricing rather than public per-seat rates, so cost depends heavily on your data scale. Several tools on this list offer free tiers or trials to validate before committing.
Elementary, Metaplane, Soda, and Bigeye are commonly chosen for dbt- and warehouse-native stacks, with integrations for Snowflake and other modern cloud warehouses. Elementary is built directly into the dbt workflow, while Metaplane is warehouse-native with fast setup. Always confirm exact integration support on each vendor's integrations page against your specific environment.
Yes. Tests catch known issues you wrote rules for, but they do not surface the problems you did not anticipate. Data observability adds anomaly detection, schema drift monitoring, and freshness tracking across the whole pipeline, catching the unknown-unknowns that fixed tests miss. The two work together rather than replacing each other.
Focus on stack coverage for your warehouse, transformation layer, and orchestration; detection depth across all five pillars; lineage-driven root-cause analysis; alert routing to tools like Slack and PagerDuty; and a pricing model that scales with your data volume. Run a hands-on trial against real pipelines before committing, since fit with your actual environment matters more than any feature list.