

Product analytics software tracks what users actually do inside your app, not just how they found it. While Google Analytics tells you where traffic came from, product analytics tools like Amplitude, Mixpanel, and Heap show which features get used, where users drop off, and what behaviors predict retention or churn.
This guide covers 13 product analytics platforms, comparing their core capabilities, pricing, and best-fit use cases so you can pick the right tool for your team's stage and goals.
Product analytics software captures and analyzes user behavior within digital products like apps and websites. Unlike traditional web analytics that tracks traffic sources and page views, product analytics tools use event-based tracking, session replays, and AI to identify patterns in how users interact with features. Leading platforms like Amplitude, Mixpanel, Pendo, and Heap give product marketing teams granular insights that surveys and testing alone can't provide.
What's inside
This guide covers 13 product analytics tools that help you understand what users do inside your product and why. We selected tools based on core capabilities (event tracking, funnel analysis, session replay), ease of implementation, integration depth, and real-world adoption by product and growth teams.
TL;DR
- Product analytics software tracks in-app user behavior to improve adoption, retention, and conversion
- Amplitude excels at behavioral cohort analysis; Mixpanel leads for funnel and retention tracking; Heap offers auto-capture without manual tagging; Pendo combines analytics with in-app guides
- Key features to evaluate: event tracking, funnel analysis, session replay, user segmentation, and retroactive data capture
- Choose based on company stage: mature products benefit from Amplitude or Mixpanel; fast-moving teams often start with PostHog or HotJar
- Guideflow can complement product analytics by tracking how prospects engage with demos before becoming users
What is product analytics software
Product analytics is a category of business intelligence software that exposes usage patterns from digital products. While Google Analytics tells you where visitors came from and which pages they viewed, product analytics tools track what happens after someone logs in: which features they use, where they get stuck, and whether they come back.
The core mechanism is event-based tracking. Every meaningful user action (clicking a button, completing a form, using a feature) gets recorded as an event with associated properties. From there, you can build funnels, segment users, and identify patterns that drive retention or churn.
Core capabilities of product analytics platforms
Most product analytics tools share a common feature set:
- Event tracking: Records specific user actions like clicks, signups, purchases, and feature usage
- Funnel analysis: Maps the steps users take toward a conversion goal and shows where they drop off
- Retention analysis: Measures whether users return to your product and what behaviors correlate with stickiness - top products retain 1.7-1.9x more users than average
- Session replay: Video recordings of user sessions that reveal friction points and confusion
- User segmentation: Groups users by demographics, behaviors, or cohorts for targeted analysis
Who uses product analytics tools
Product analytics serves multiple teams with different goals. Product managers track feature adoption and use data to prioritize roadmap decisions. Growth teams optimize conversion funnels and identify levers for reducing churn.
Customer success teams spot at-risk users and improve onboarding flows. Engineering teams debug issues and understand how technical performance affects user experience. Product marketing teams measure launch performance and tie messaging to actual usage patterns.
Product analytics tools comparison table
13 best product analytics tools for product teams
1. Mixpanel

Mixpanel focuses on tracking conversion funnels and retention trends with AI-powered insights. The platform excels at answering questions like "which user actions predict conversion?" and "where do users drop off in onboarding?" Its query interface lets non-technical users build reports without SQL.
Best for: Teams focused on conversion optimization and retention analysis who want actionable insights without heavy data engineering.
Key strengths
- Funnel analysis with conversion tracking across any sequence of events
- Retention reports showing cohort behavior over time
- AI-powered insights that surface anomalies and opportunities automatically
- Mobile and web tracking through unified SDKs
Mixpanel pricing
Free tier available for up to 20M events/month. Paid plans scale based on event volume and features.
2. Amplitude

Amplitude positions itself as the enterprise standard for behavioral analytics and experimentation. The platform's strength is cohort modeling: grouping users by shared behaviors and tracking how those cohorts perform over time. It also includes built-in A/B testing and feature flagging.
Best for: Mature products with dedicated analytics resources who want sophisticated behavioral analysis and experimentation in one platform.
Key strengths
- Cohort analysis for tracking user groups by behavior over time
- Experimentation platform with statistical rigor built in
- Data governance features for enterprise compliance requirements
- Behavioral targeting for personalization based on usage patterns
Amplitude pricing
Free tier available. Growth and Enterprise plans are custom-priced based on tracked users and features.
3. Heap

Heap (now part of Contentsquare) differentiates through auto-capture: it records every user interaction automatically without requiring you to define events upfront. This means you can ask questions about past behavior retroactively, even if you didn't think to track that event when it happened.
Best for: Teams that want to start analyzing quickly without building a tracking plan first, or those who frequently discover they need data they didn't anticipate.
Key strengths
- Auto-capture records all clicks, form submissions, and page views automatically
- Retroactive analysis lets you define events after the fact
- Session replay included for qualitative context
- Minimal engineering setup compared to event-based tools
Heap pricing
Free tier available. Paid plans are custom-priced based on session volume.
4. Pendo

Pendo combines product analytics with in-in app guidance, making it popular with B2B SaaS teams who want to measure and influence user behavior in one platform. You can track feature adoption, then deploy tooltips, walkthroughs, or NPS surveys without separate tools.
Best for: B2B SaaS product teams who want analytics and in-app engagement capabilities together.
Key strengths
- Feature adoption tracking with usage heatmaps
- In-app guides for onboarding and feature announcements via product tour software
- NPS and feedback surveys triggered by user behavior
- Product-led growth tools for self-serve onboarding
Pendo pricing
Custom pricing based on monthly active users and features.
5. FullStory

FullStory focuses on digital experience intelligence, with session replay as its core capability. The platform captures user sessions and uses AI to surface "frustration signals" like rage clicks, dead clicks, and error clicks that indicate UX problems.
Best for: UX and product teams who want to understand the "why" behind quantitative metrics through qualitative session analysis.
Key strengths
- Session replay with searchable, indexed recordings
- Frustration signals that automatically flag problematic sessions
- Heatmaps showing click and scroll patterns
- Error tracking connected to user experience impact
FullStory pricing
Custom pricing based on session volume.
6. PostHog

PostHog offers an open-source alternative that bundles product analytics, session recording, feature flags, and A/B testing in one platform. Engineering teams particularly like the self-hosted option and the ability to see exactly how data is handled.
Best for: Engineering-led teams who want control over their data and prefer open-source tools they can customize.
Key strengths
- Open-source with self-hosted deployment option
- Feature flags for controlled rollouts
- Session recording included
- All-in-one platform reducing tool sprawl
PostHog pricing
Free tier available. Cloud plans scale based on events and features. Self-hosted is free with optional paid support.
7. Hotjar

Hotjar provides heatmaps, session recordings, and user feedback tools in an accessible package. It's often the first qualitative analytics tool teams adopt because setup takes minutes and the interface is intuitive.
Best for: Smaller teams or those new to user research who want quick qualitative insights without complexity.
Key strengths
- Heatmaps showing click, move, and scroll patterns
- Session recordings with simple filtering
- Feedback widgets for collecting user input
- Survey tools for targeted questions
Hotjar pricing
Free tier available. Paid plans start at $32/month.
8. LogRocket

LogRocket combines session replay with frontend error tracking, making it useful for debugging user-reported issues. When a user says "something broke," you can find their session and see exactly what happened, including any JavaScript errors.
Best for: Product and engineering teams who want to connect user experience problems to technical root causes.
Key strengths
- Session replay with error context
- Error tracking integrated with recordings
- Performance monitoring for frontend issues
- Developer-friendly integrations with issue trackers
LogRocket pricing
Free tier available. Paid plans start at $99/month.
9. Countly

Countly offers a privacy-focused analytics platform with self-hosted deployment options. Organizations with strict data residency or compliance requirements often choose Countly because data never leaves their infrastructure.
Best for: Companies with strict privacy requirements, GDPR compliance needs, or preferences for on-premise deployment.
Key strengths
- Self-hosted option for complete data control
- GDPR compliance built into the architecture
- Mobile analytics with push notification support
- Extensible plugins for custom functionality
Countly pricing
Free community edition available. Enterprise pricing is custom.
10. Mouseflow

Mouseflow specializes in conversion optimization with features like form analytics and friction scoring. The platform automatically identifies where users struggle, particularly useful for e-commerce checkout flows and lead generation forms.
Best for: Teams focused on conversion rate optimization, especially for forms and checkout processes.
Key strengths
- Form analytics showing field-level abandonment
- Friction scoring that ranks pages by user struggle
- Session replay with automatic tagging
- Funnel visualization for conversion paths
Mouseflow pricing
Free tier available. Paid plans start at $31/month.
11. UXCam

UXCam focuses exclusively on mobile app analytics, providing session replay, heatmaps, and funnel analysis designed for iOS and Android. The platform captures touch gestures, swipes, and mobile-specific interactions that web-focused tools miss.
Best for: Mobile-first product teams who want analytics designed specifically for app experiences.
Key strengths
- Mobile session replay with gesture tracking
- Touch heatmaps showing tap and swipe patterns
- Crash analytics connected to user sessions
- Screen flow analysis for mobile navigation
UXCam pricing
Custom pricing based on session volume.
12. Quantum Metric
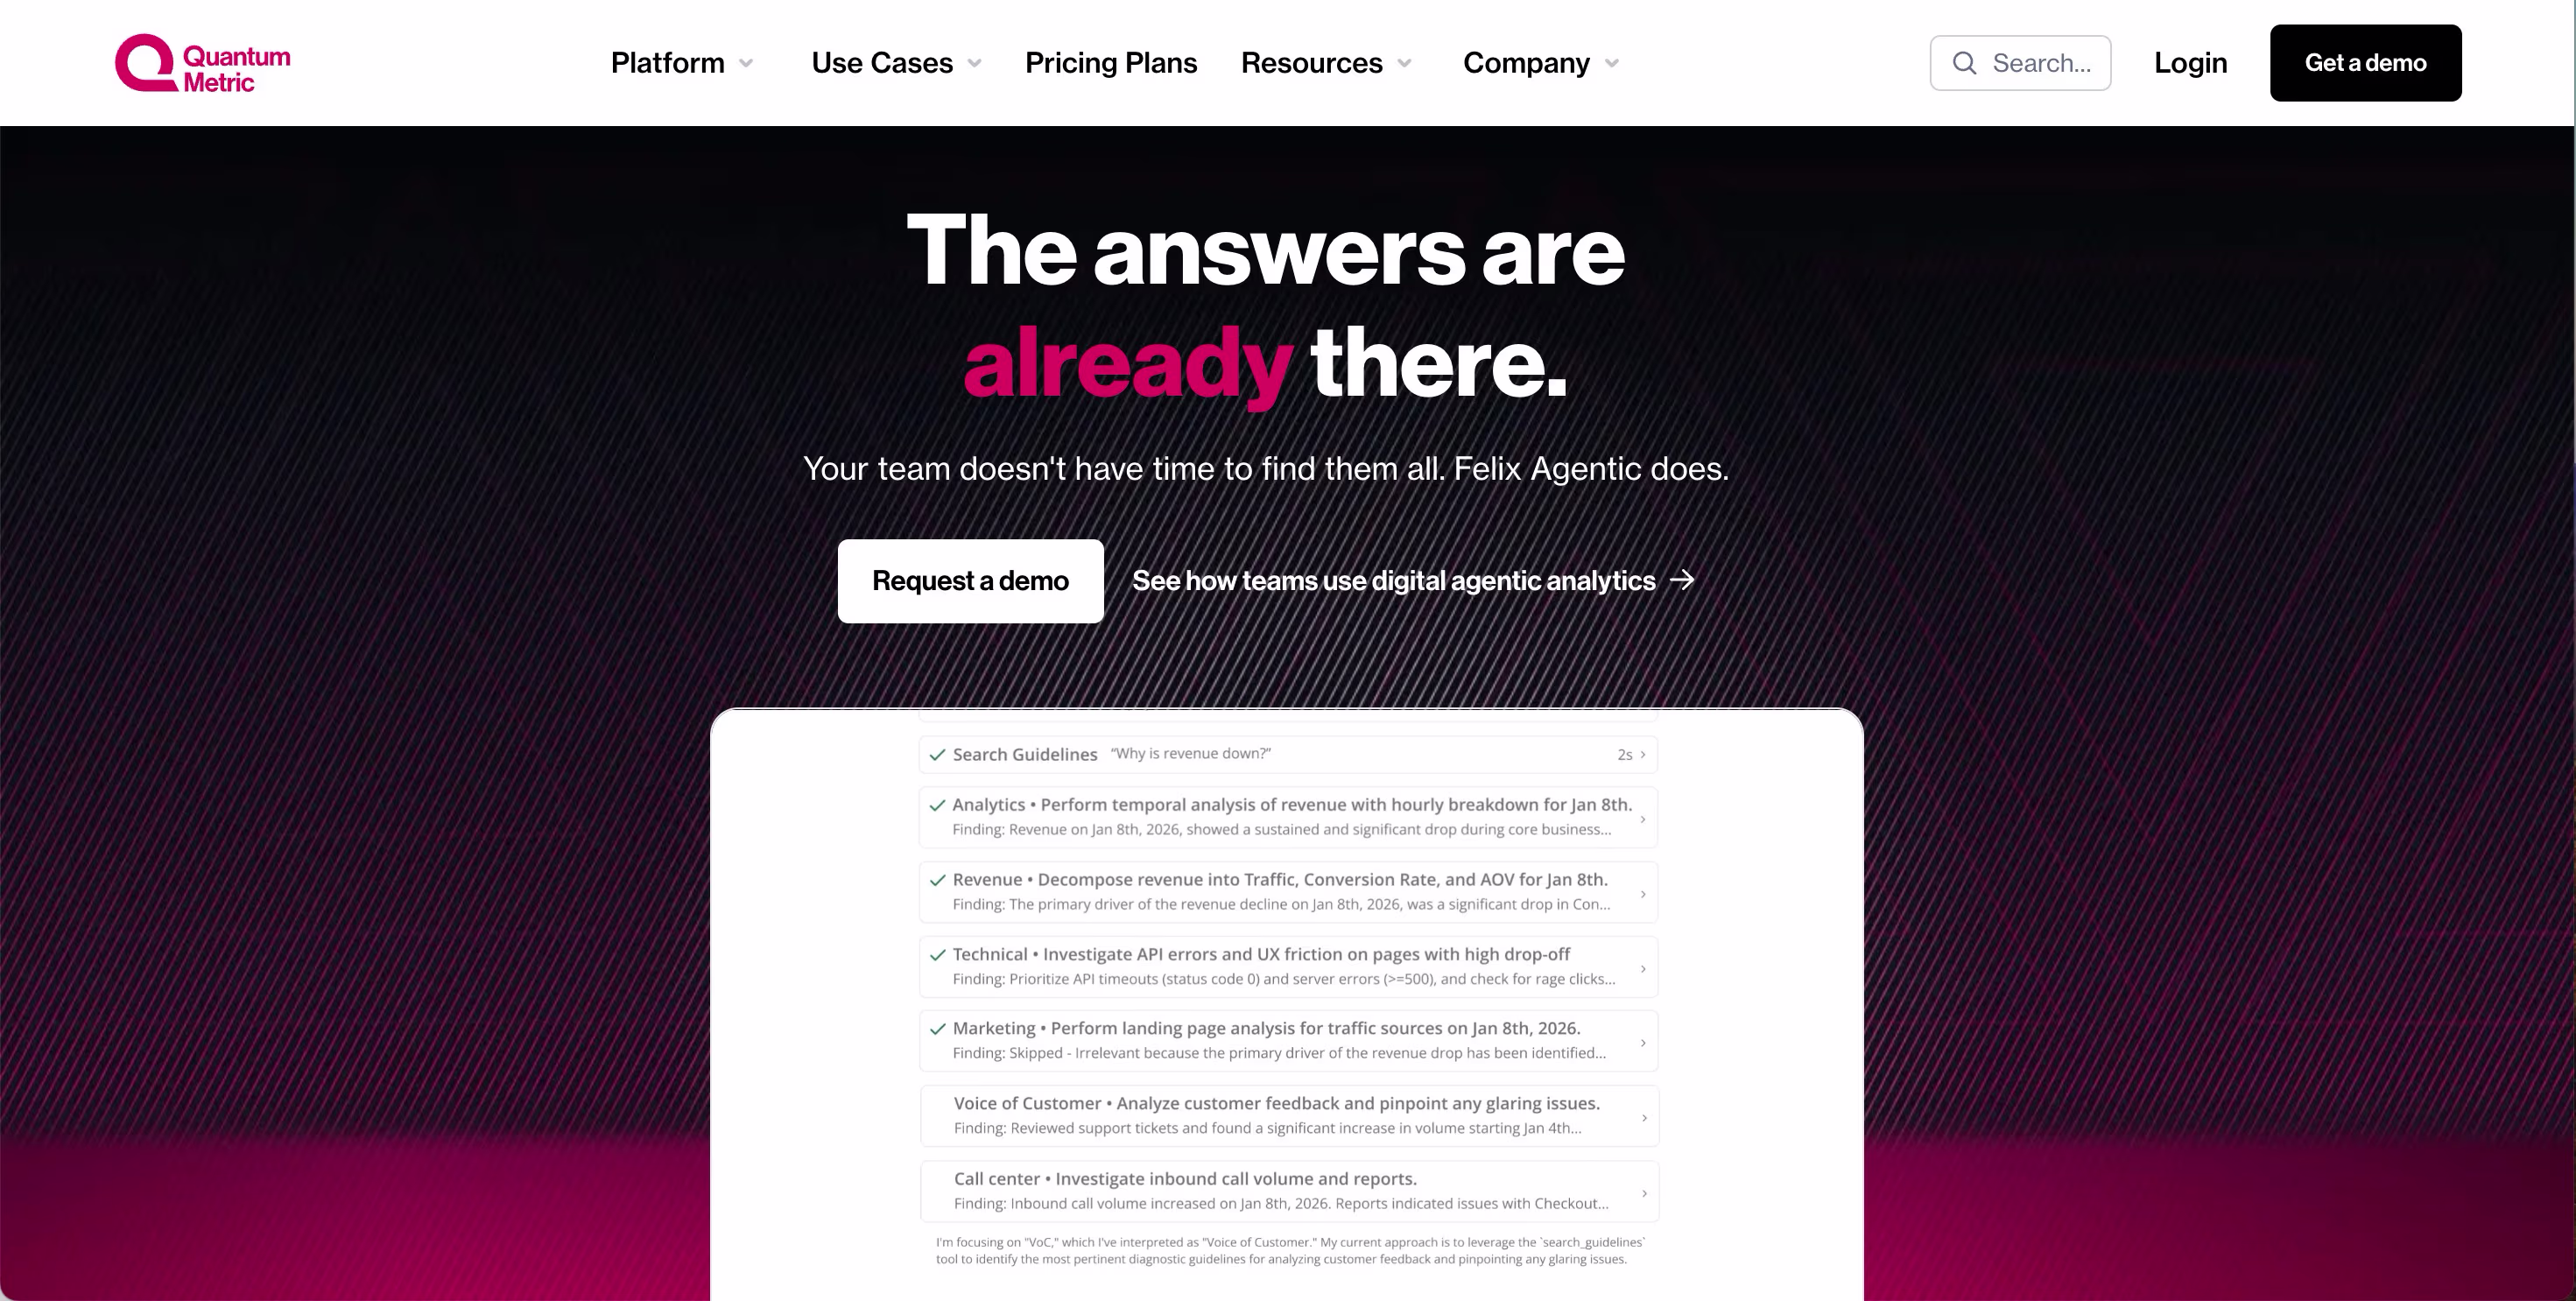
Quantum Metric serves enterprise organizations with a focus on quantifying the business impact of user experience issues. The platform automatically calculates revenue impact when users encounter friction, helping prioritize fixes by dollar value.
Best for: Large organizations who want to connect UX metrics directly to business outcomes and prioritize by revenue impact.
Key strengths
- Business impact quantification for UX issues
- Anomaly detection that surfaces problems automatically
- Session replay at enterprise scale
- Cross-team dashboards for different stakeholders
Quantum Metric pricing
Custom enterprise pricing.
13. Gainsight PX

Gainsight PX combines product analytics with customer success workflows, making it popular with B2B SaaS companies focused on expansion revenue. The platform connects usage data to customer health scores and renewal predictions.
Best for: B2B SaaS teams who want product analytics integrated with customer success and expansion workflows.
Key strengths
- Product analytics with customer health scoring
- In-app engagement for onboarding and adoption
- AI-powered insights for churn prediction
- Customer success integration with Gainsight CS
Gainsight PX pricing
Custom pricing based on users and features.
How to choose the right product analytics platform
The right tool depends on your company's stage, technical resources, and primary use case. There's no universal best choice, only the best fit for your specific situation.
Define your primary tracking use case
Start by identifying what questions you most want to answer:
- Behavioral analysis at scale: Amplitude or Mixpanel for sophisticated cohort modeling
- Quick setup without event planning: Heap for auto-capture and retroactive analysis
- Analytics plus in-app guidance: Pendo for combined measurement and action
- Speed and simplicity: PostHog or Hotjar for fast-moving smaller teams
Check integration compatibility
Product analytics tools work best when connected to your existing stack. Evaluate native integrations with your CRM, marketing automation tools, data warehouse, and communication platforms.
Evaluate implementation requirements
Auto-capture tools like Heap require minimal engineering, while event-based platforms like Amplitude need upfront planning and developer involvement to define and implement tracking plans, especially for complex product workflows. Consider your team's technical resources and how much ongoing maintenance you can support.
Compare pricing at your expected scale
Pricing typically scales with tracked users or events. Free tiers work for early-stage products, but costs can surprise you as usage grows. Model your expected volume before committing.
Essential product analytics features
When evaluating tools, these capabilities matter most for understanding user behavior.
Event tracking and funnel analysis
Event tracking records specific user actions as structured data. Funnel analysis chains those events together to show conversion rates between steps. Together, they answer "what percentage of users who started X completed Y?" and reveal where users drop off.
User segmentation and cohort analysis
Segmentation groups users by attributes or behaviors for targeted analysis. Cohort analysis tracks how groups of users (often defined by signup date or first action) behave over time.
Session replay and heatmaps
Session replay shows video recordings of individual user sessions. Heatmaps aggregate interaction patterns across many users. Both provide qualitative context that explains the "why" behind quantitative metrics.
Retroactive data capture
Some tools (notably Heap) record all interactions automatically, letting you define events after the fact. This means you can answer questions about past behavior even if you didn't anticipate needing that data.
AI-powered product insights
Newer platforms use AI to surface anomalies, predict churn, and generate insights automatically. Mixpanel and Amplitude both offer AI features that reduce the manual work of finding patterns in data.
Why product analytics software matters for product teams
Product analytics transforms how teams make decisions by replacing assumptions with evidence:
- Data-driven roadmap decisions: Prioritize features based on actual usage, not loudest customer requests
- Reduced churn: Identify at-risk users before they leave by spotting engagement drops - even a 5% reduction can boost revenue 25-95%
- Faster time-to-value: Understand where users get stuck in onboarding and fix friction points
- Improved conversion: Optimize funnels with evidence rather than guesswork
- Cross-team alignment: Give product, marketing, and success teams shared visibility into user behavior
From demo analytics to product analytics
Traditional product analytics starts tracking after someone becomes a user. But buying decisions often happen earlier, during the evaluation phase when prospects explore your product through sandbox demos, trials, or marketing content.
This creates a visibility gap. You can see what users do after signup, but not what influenced their decision to sign up in the first place - whether through live demos, interactive experiences, or other evaluation methods. Demo analytics fills this gap by tracking how prospects interact with your product before they convert:
- Demo engagement data: See which features prospects explore in demo centers and interactive experiences, tracking where they spend time
- Buyer intent signals: Identify high-intent leads based on demo completion and interaction depth
- Handoff to product analytics: Connect pre-purchase demo behavior to post-purchase usage patterns
Combining demo analytics with product analytics gives you visibility across the entire journey, from first interaction through long-term retention.
Build your product analytics stack today
Start with one core product analytics tool that matches your primary use case and technical resources. Amplitude or Mixpanel for sophisticated analysis, Heap for quick setup, or PostHog for open-source flexibility. Layer in qualitative tools like FullStory or Hotjar for the "why" behind your numbers.
Consider adding demo analytics to understand the pre-purchase journey. When you can see how prospects engage with your product before becoming users, you connect marketing and sales efforts to actual product outcomes.
Start your journey with Guideflow today!