You're 40 minutes into an outage bridge. The dashboard says latency spiked. The app team blames the network. The network team blames the app. Nobody has proof. Everyone has a theory.
That gap between theory and proof is where packet capture software earns its keep. Flow records and metrics tell you something is wrong. Packets tell you exactly what happened on the wire: the retransmission, the reset, the failed handshake, the DNS timeout. It's the closest thing to ground truth network engineers, security analysts, and presales teams have when a screenshot or a graph isn't enough.
That ground truth is not a niche concern. The global packet sniffer and capture tool market is projected to reach USD 988.68M in 2026, on its way to USD 2.53B by 2035, according to Market Research Guru (2026). Teams keep investing here because packet-level evidence resolves the arguments that logs and averages can't.
For presales engineers specifically, a reliable packet analyzer is how you reproduce a customer's issue, validate product behavior during a POC, and answer a security team's question with data instead of assurances. The same tool that debugs an outage also backs your technical claims in an evaluation. If you're building out a broader evaluation stack, it's worth pairing capture tools with the ab testing tools and ai customer service software you already use to prove value.
The picks below are sorted by the job you're trying to do, not by brand loyalty. We looked at capture depth, filtering and protocol decoding, export support like pcap and pcapng, and how well each tool fits your actual environment.
What's inside
This guide compares 7 packet capture tools for 2026, chosen for teams doing network troubleshooting, security investigations, forensics, and technical validation during evaluations. We favored tools that are genuinely useful across those jobs rather than one-trick options.
Selection came down to four things: capture depth (how much of the traffic you can actually see and decode), interoperability (does it read and write standard formats like pcapng), usability (CLI power versus a full analysis GUI), and environment fit (Windows-native, cross-platform, open source, or enterprise observability). Each tool below is mapped to the specific job it handles best.
TL;DR
- Best overall for most users: Wireshark, the deep protocol analyzer nearly every engineer already knows.
- Best free and open-source option: Wireshark again, with Tcpdump as the CLI companion.
- Best Windows-native option: Pktmon, built into modern Windows and Windows Server.
- Best for enterprise monitoring and observability: SolarWinds Network Performance Monitor.
- Best for mixed packet and flow visibility: ManageEngine NetFlow Analyzer.
- Best cloud-based monitoring platform: Site24x7.
- Best for post-capture forensic analysis: Network Miner.
Short version: start with Wireshark and Tcpdump for hands-on analysis, add a Windows-native or enterprise layer based on your stack, and reach for Network Miner when an investigation turns forensic.
What is packet capture software?
Packet capture software records the raw network traffic crossing an interface so you can inspect, decode, and analyze it packet by packet. It's the tool category that turns invisible wire activity into readable sessions, protocols, and payloads.
A few related terms get used interchangeably, so it helps to separate them:
- Packet capture is the act of recording traffic off an interface, usually to a file.
- Packet analysis is what you do after: decoding protocols, following streams, and interpreting what the packets mean.
- Packet sniffing is the informal name for live capture, often used by a packet sniffer running in promiscuous or monitor mode.
- Packet monitoring usually means ongoing, higher-level observation of traffic patterns, closer to flow data than raw packets.
Good packet capture software should do the following well:
- Capture live traffic across wired and wireless interfaces
- Filter aggressively (capture filters and display filters) and decode hundreds of protocols
- Search, follow, and inspect individual sessions and streams
- Export to common formats so captures move between tools
- Support security and forensic workflows, from evidence collection to artifact extraction
On formats: pcap is the classic capture file format, and pcapng (pcap next generation) is the modern successor that adds metadata, multiple interfaces, and richer annotations. Most serious tools read and write both, which is why interoperability matters. If your Windows tool exports ETL, you'll want a clean path to convert it to pcapng so Wireshark can read it. When you're mapping out a full diagnostics workflow, the same interoperability logic applies to adjacent categories like ai governance tools and agentic ai platforms that need to share data cleanly.
When to use packet capture software
Packet capture isn't the first tool you reach for every day. It's the one you reach for when the summary data runs out. Here's when it earns the effort.
Troubleshoot latency, jitter, and retransmissions
Flow data and SNMP counters tell you that a link is slow or a service is degraded. They rarely tell you why. Packet-level visibility shows the actual TCP retransmissions, duplicate ACKs, zero-window events, and jitter between packets that explain a bad call quality report or a stalled transfer. When you need to prove whether latency lives in the network, the server, or the application, only the packets settle it. This is exactly the kind of root cause analysis that a packet analyzer does and a bandwidth graph cannot.
Investigate security events or compliance questions
Captures are evidence. During a security investigation, a saved pcap lets you reconstruct a session, confirm whether data left the building, and extract the exact artifacts an attacker touched. For compliance, packet captures validate that traffic is encrypted where policy requires it and that segmentation actually holds. Digital forensics teams lean on capture files because they're timestamped, verifiable, and hard to argue with.
Validate product behavior during technical evaluations
For presales engineers, packet capture is a quiet superpower. When a prospect's security team asks what your product actually sends over the wire, a capture answers it directly. When a POC hits a mysterious connectivity issue, capturing the traffic reproduces and isolates it fast, instead of stalling the evaluation. It's the same instinct behind giving buyers a hands-on interactive demo: show the real behavior instead of describing it. If you're assembling the rest of that evaluation toolkit, our roundups of ai content creation tools and affiliate marketing software cover adjacent stack decisions.
Comparison table
The table below maps each tool to its primary intent, core use case, verified pricing, and G2 rating where a current figure was available. Use it to shortlist two or three tools that match your environment before reading the full write-ups.
| # | Product | Intent | Key use case | Pricing | G2 rating |
|---|---|---|---|---|---|
| 1 | Wireshark | Deep packet analysis | Protocol decoding and troubleshooting | Free, open source | 4.7/5 |
| 2 | Tcpdump | Lightweight CLI capture | Remote and scripted capture | Free, open source | Not listed |
| 3 | Pktmon | Windows-native capture | Built-in Windows diagnostics | Included with Windows | Not listed |
| 4 | SolarWinds NPM | Enterprise observability | Network performance monitoring | Starts at $2,829 | 4.3/5 |
| 5 | ManageEngine NetFlow Analyzer | Flow and traffic analysis | Bandwidth monitoring | Starts at $172 | Not listed |
| 6 | Site24x7 | Cloud monitoring | Unified network and app monitoring | Starts at $9/mo | Not listed |
| 7 | Network Miner | Forensic analysis | Artifact extraction from captures | Free; Pro from $1,300 | Not listed |
1. Wireshark
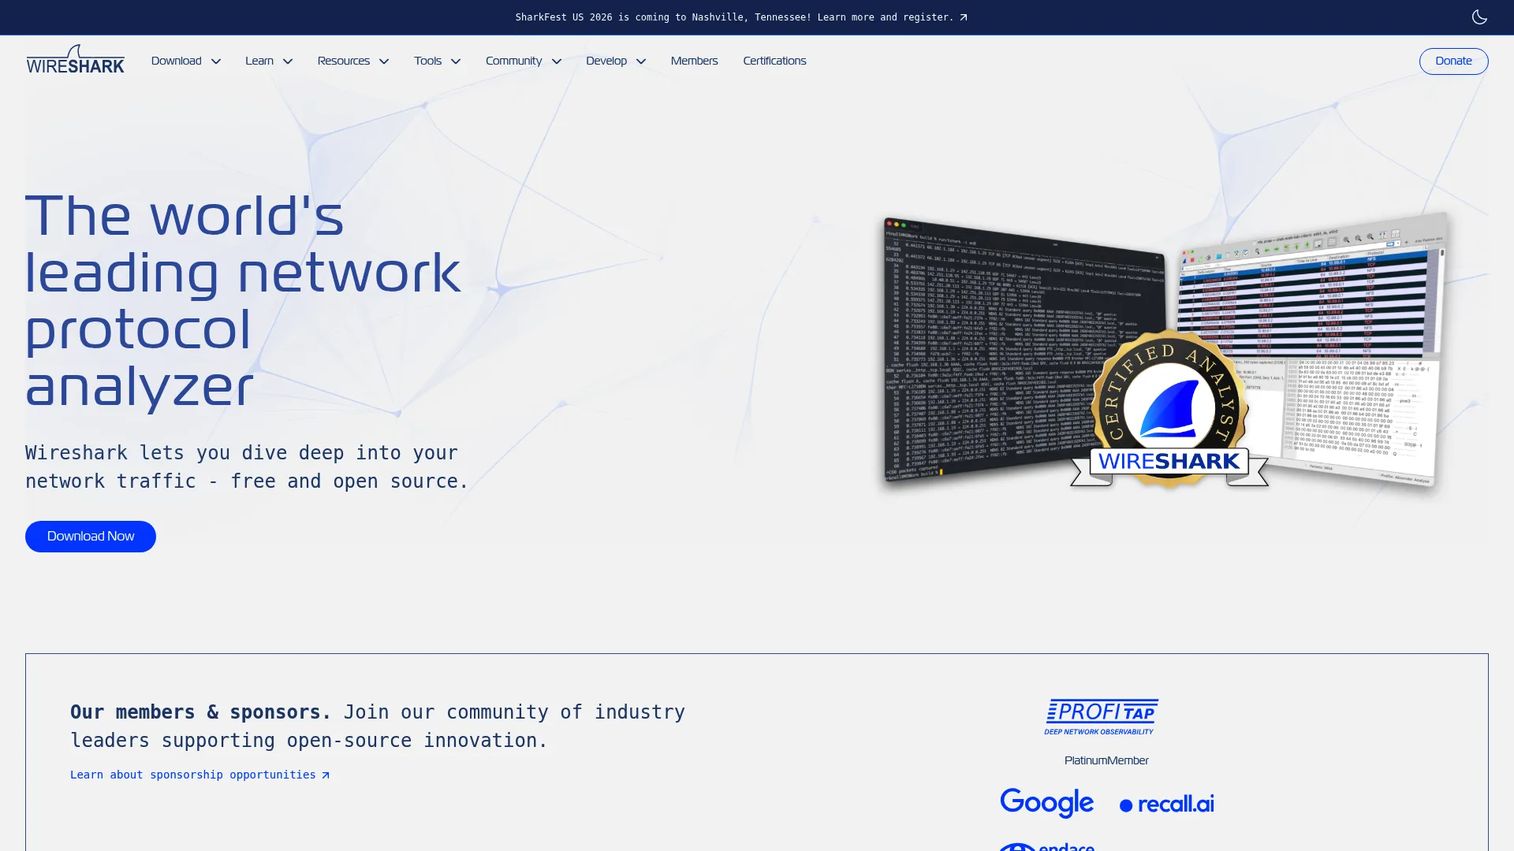
Wireshark is the default answer when someone asks which packet analyzer to learn. It's a free, open-source network protocol analyzer that captures live traffic and dissects offline captures with a depth few tools match. The three-pane packet browser, display filters, and dissection of hundreds of protocols make it the reference point everyone else gets compared to.
What keeps Wireshark on top is range. It captures on wired and wireless interfaces, decodes an enormous protocol library, follows TCP and UDP streams, and handles VoIP analysis when call quality is the problem. Display filters let you cut a million-packet capture down to the six packets that matter. It runs on Windows, macOS, and Linux, and it reads and writes both pcap and pcapng, so captures from almost any other tool open cleanly.
Best for: Network engineers and security teams who need packet-level troubleshooting and deep protocol analysis.
Key strengths
- Deep protocol decoding: Dissects hundreds of protocols so you can read exactly what's on the wire.
- Powerful display filters: Narrow massive captures to the exact packets, streams, or errors you care about.
- Cross-platform and open format: Runs everywhere and works natively with pcap and pcapng files.
Why choose Wireshark: If you only learn one packet capture tool, this is it. The skill transfers everywhere, the documentation and training ecosystem is enormous, and it's free. For presales engineers, it's the fastest way to prove what a product sends over the wire during a technical review.
Wireshark pricing: Wireshark is free and open source. There is no paid tier and no public pricing on the official site. It holds a 4.7/5 rating on G2.
2. Tcpdump
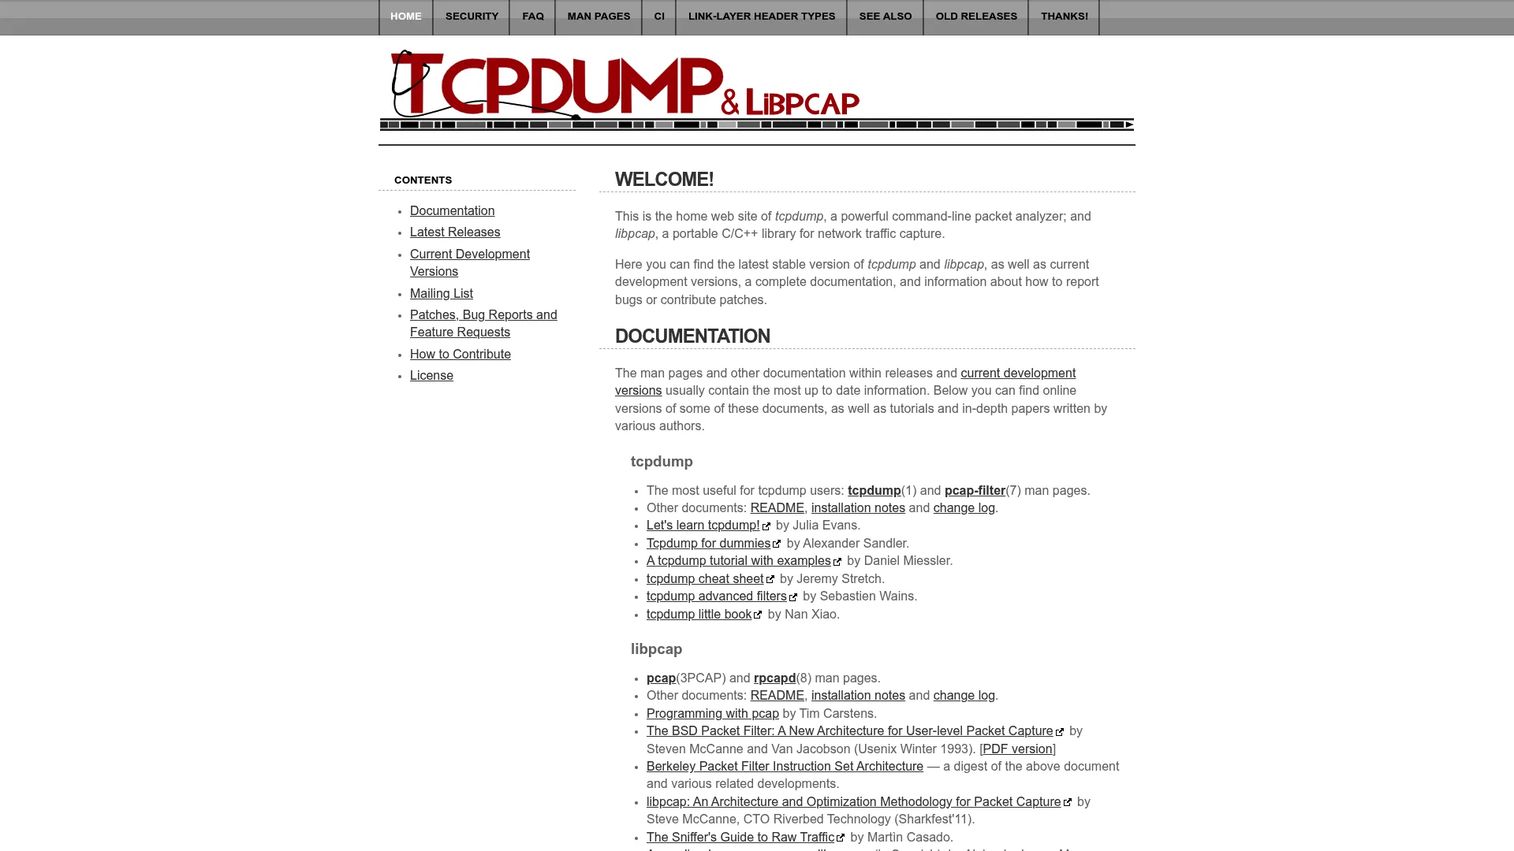
Tcpdump is the command-line packet sniffer that lives on nearly every Linux and Unix box. When you need to capture traffic on a remote server with no GUI, no desktop, and only an SSH session, Tcpdump is the answer. It captures, filters, and displays packets straight from the terminal, built on the same libpcap library that underpins much of the ecosystem.
Its value is speed and scriptability. You can grab a capture in one line, apply a tight capture filter to keep the file small, and pipe or copy the resulting pcap to a workstation for deep analysis in Wireshark. That handoff is the point: Tcpdump collects in places a GUI can't reach, and the standard pcap output means full interoperability with heavier analysis tools.
Best for: Network engineers and security practitioners who need low-level capture from the command line on remote or headless systems.
Key strengths
- Command-line capture: Grab traffic from any terminal, including headless servers and containers.
- Tight capture filters: Limit captures at collection time to keep files small and focused.
- pcap interoperability: Outputs standard capture files that open directly in Wireshark and other analyzers.
Why choose Tcpdump: Reach for it when the machine you need to capture on has no interface, or when you want to automate capture inside a script or a cron job. Experienced operators pair it with Wireshark constantly: capture with Tcpdump, analyze with Wireshark.
Tcpdump pricing: Tcpdump is free software distributed from the project website. There is no paid tier.
3. Pktmon
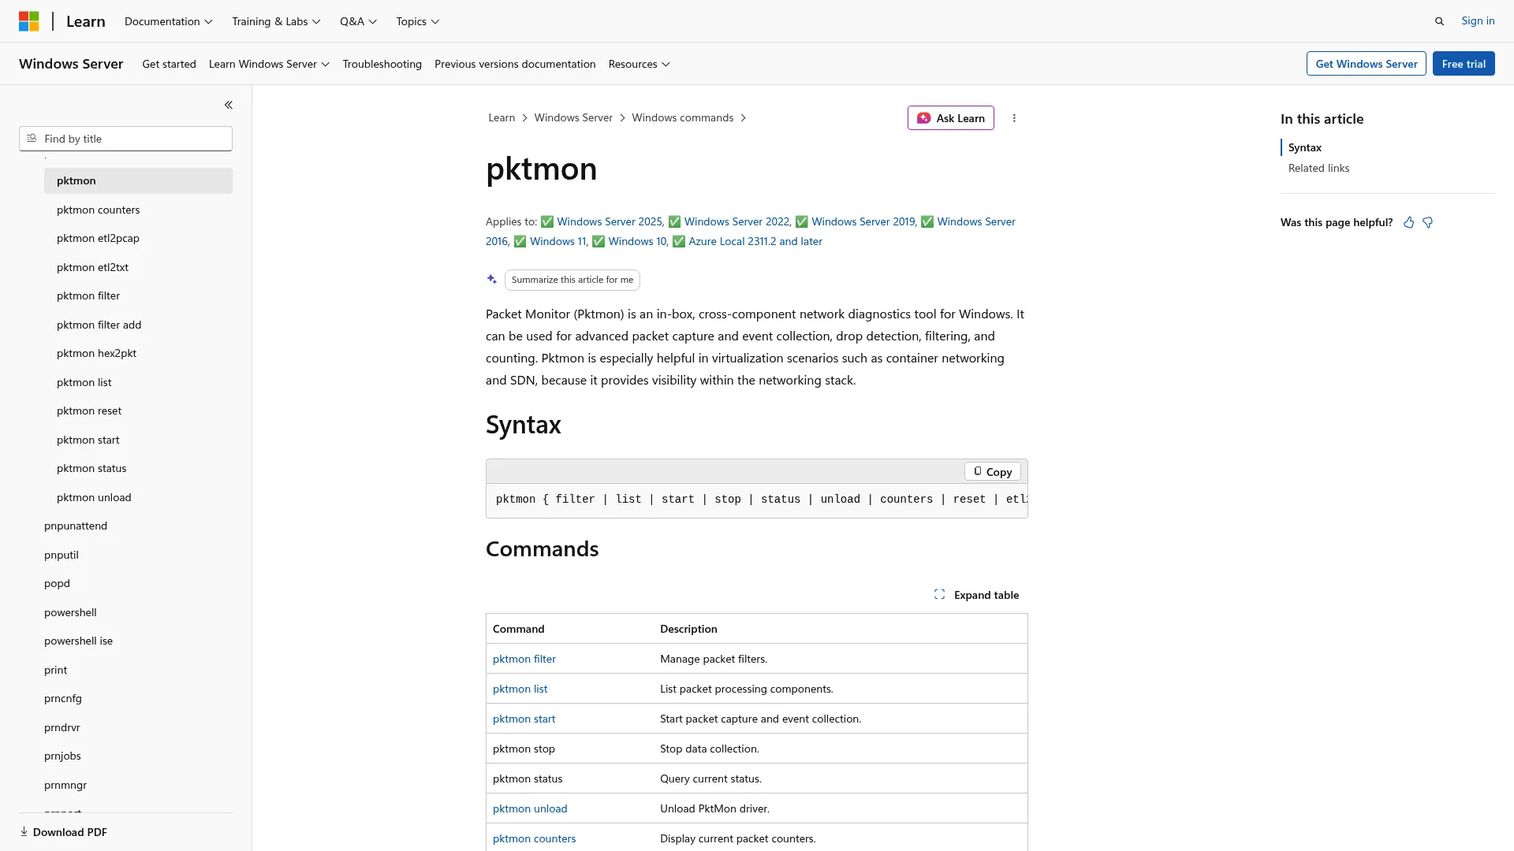
Pktmon is Microsoft's in-box network diagnostics tool, built into modern Windows and Windows Server. There's nothing to install. If you're already operating in a Microsoft environment, you have a capable Windows packet capture tool sitting on every machine, ready for capture, drop detection, filtering, and packet counting.
Where Pktmon shines is diagnosing traffic that never makes it out: it can detect where packets are being dropped along the stack, which is invaluable when a firewall rule or driver is silently eating traffic. It captures events, applies filters, counts packets, and converts its native log format to pcapng, so your Windows capture opens right up in Wireshark for deeper analysis. That ETL to pcapng conversion is the bridge that ties Windows-native capture to the broader tooling ecosystem.
Best for: Windows admins diagnosing network traffic and packet drops across Microsoft environments.
Key strengths
- Built into Windows: No install, no license, ready on every modern Windows and Windows Server host.
- Drop detection: Pinpoints where along the stack packets are being dropped.
- ETL to pcapng conversion: Turns native Windows captures into pcapng for analysis in Wireshark.
Why choose Pktmon: If your fleet is Windows-heavy and you want capture capability without deploying anything, Pktmon is the pragmatic choice. It replaces the older Netmon workflow and keeps everything native to the OS.
Pktmon pricing: Pktmon is included with Windows and Windows Server at no additional cost. There is no separate license or public price.
4. SolarWinds Network Performance Monitor
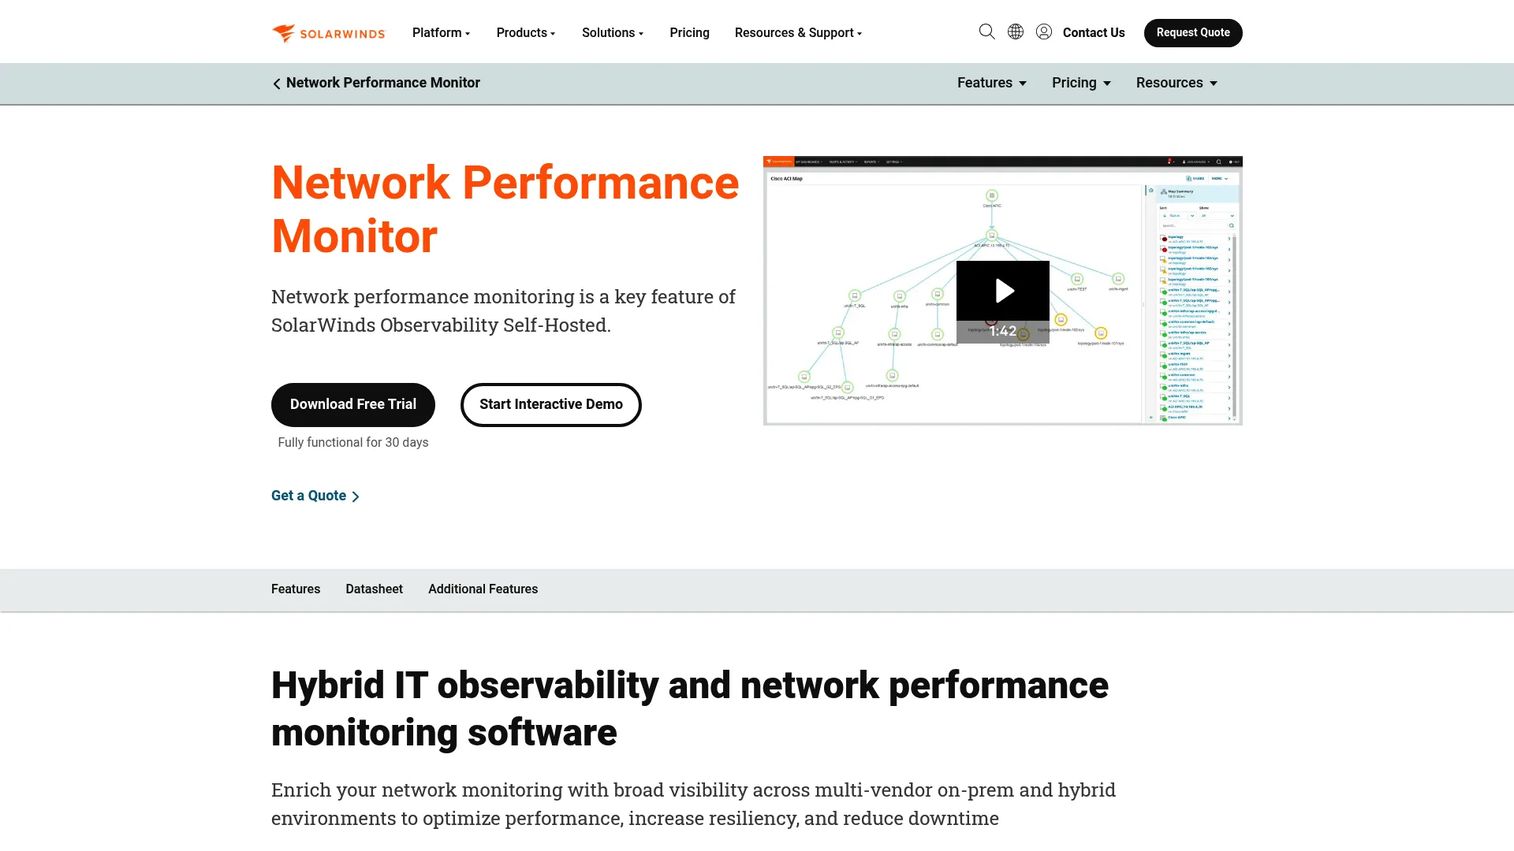
SolarWinds Network Performance Monitor sits in a different weight class than a standalone analyzer. It's network monitoring software for discovering, monitoring, and troubleshooting multi-vendor networks, with packet-aware troubleshooting layered into a broader observability platform. This is the tool for ops teams who need to watch the whole estate, not just decode one capture.
Its strengths are operational. Automatic device discovery maps your network, NetPath visualizes the actual path traffic takes hop by hop, and intelligent alerts flag performance problems before users open tickets. When something breaks, you drill from a high-level alert down toward the affected path and device, which shortens the time between symptom and root cause across a large network.
Best for: IT operations teams needing on-prem or hybrid network performance monitoring and troubleshooting at scale.
Key strengths
- Automatic device discovery: Maps and inventories multi-vendor networks without manual setup.
- NetPath visualization: Shows the real hop-by-hop path traffic takes across your network.
- Intelligent alerts: Surfaces performance degradation before it turns into a flood of tickets.
Why choose SolarWinds NPM: Choose it when your problem is fleet-wide visibility and alerting, not one-off packet decoding. Deep forensic specialists will still pair it with a dedicated analyzer, but for continuous network operations it's a strong central platform.
SolarWinds NPM pricing: Network Performance Monitor starts at $2,829 per the SolarWinds pricing page, with a quote flow for larger deployments. It holds a 4.3/5 rating on G2 for the closest primary SolarWinds observability product.
5. ManageEngine NetFlow Analyzer
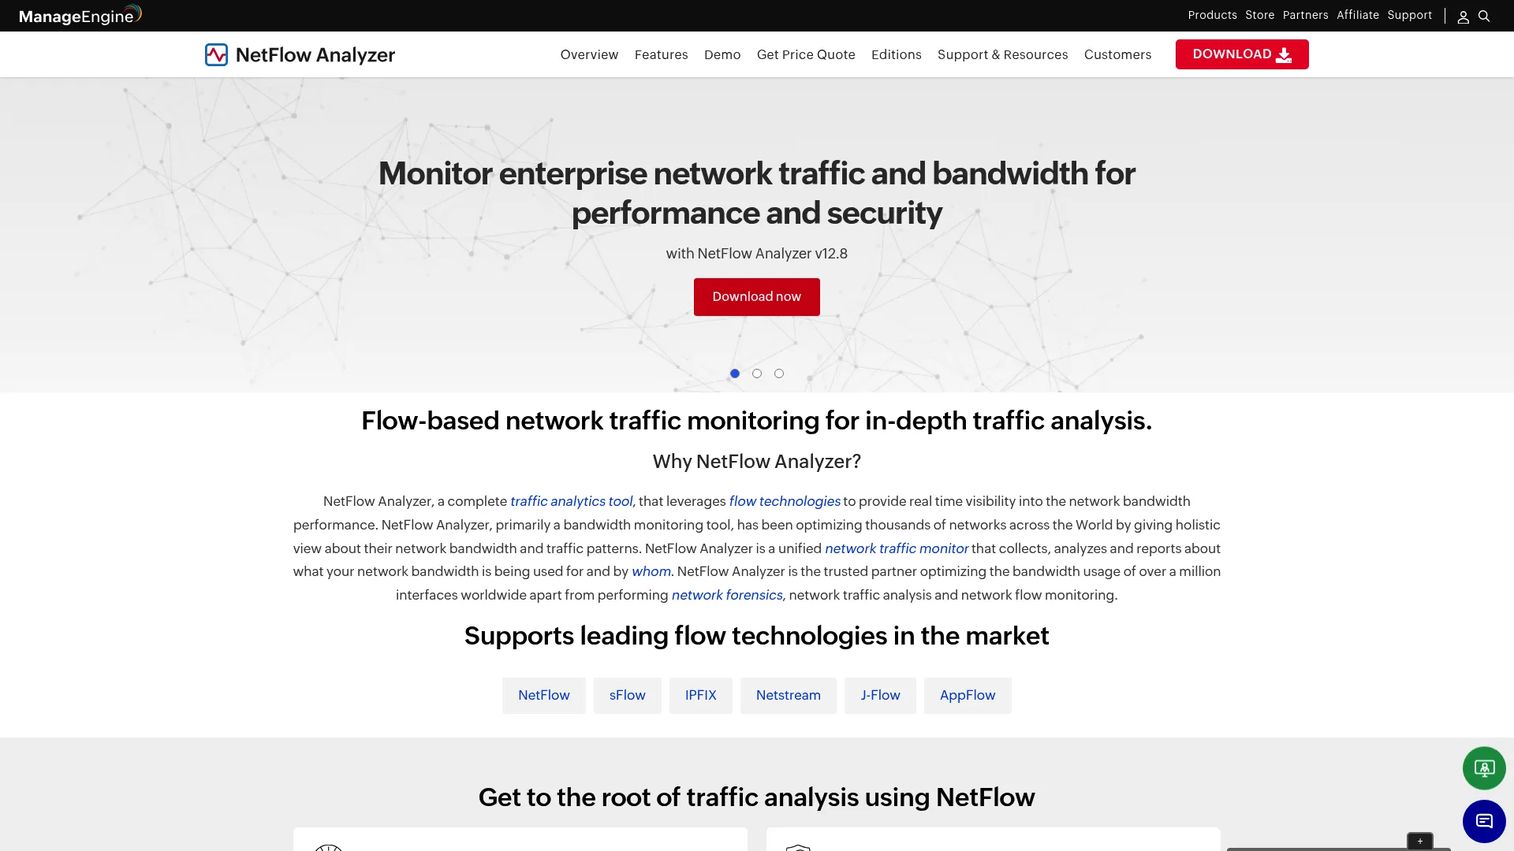
ManageEngine NetFlow Analyzer is web-based flow traffic analysis and bandwidth monitoring software. It's the answer to a different question than a raw packet analyzer: not "what's in this packet" but "what's consuming this link, and who's talking to whom over time." It reads flow exports like NetFlow, sFlow, IPFIX, J-Flow, NetStream, and AppFlow to build real-time traffic graphs and reports.
Where it helps most is correlation and trend. When a link saturates, NetFlow Analyzer shows you the top talkers, applications, and conversations driving the load, so you can troubleshoot performance without capturing every packet. It also handles capacity planning, billing, and security analytics. This is packet-adjacent visibility, and it's strongest when you pair flow-level context with packet capture for the deep-dive moments.
Best for: IT teams that need flow-based bandwidth monitoring and troubleshooting across distributed networks.
Key strengths
- Broad flow support: Reads NetFlow, sFlow, IPFIX, J-Flow, NetStream, and AppFlow from your existing gear.
- Real-time traffic graphs: Surfaces top talkers, applications, and conversations as they happen.
- Capacity and security analytics: Supports planning, billing, and traffic-based security monitoring.
Why choose ManageEngine NetFlow Analyzer: Choose it when summary-level, always-on visibility is what you need day to day, and reserve packet capture for the specific incidents that demand packet-by-packet detail. The two together give you both the pattern and the proof.
ManageEngine NetFlow Analyzer pricing: The Standard Edition starts at $172 for 10 interfaces, the Professional Edition at $245 for 10 interfaces, and the Enterprise Edition at $3,795 for 100 interfaces, per the ManageEngine pricing page. Enterprise also offers a personalized quote.
6. Site24x7
Site24x7 is a cloud-based monitoring and observability platform that spans website uptime, infrastructure, network, and application performance in one place. It's the option for teams that want broad operational coverage from a SaaS product rather than a dedicated packet analyzer they run themselves.
Its appeal is speed to deploy and unified visibility. You get network monitoring, log management, and AIOps-style anomaly detection through hosted dashboards and alerting, without standing up your own monitoring server. For teams troubleshooting performance across a distributed or cloud-heavy environment, that consolidated view helps you spot which layer is degraded before you decide whether a deeper packet-level look is warranted.
Best for: Teams needing unified website, infrastructure, network, and application monitoring from the cloud.
Key strengths
- Unified monitoring: One platform for website, infrastructure, network, and application health.
- Fast to deploy: Cloud-based, so there's no monitoring server to build and maintain.
- AIOps and log management: Anomaly detection and log analysis surface issues automatically.
Why choose Site24x7: Choose it when operational simplicity and breadth matter more than dedicated packet decoding. It's a monitoring platform first, so it works best alongside a purpose-built analyzer when an incident calls for packet-level detail.
Site24x7 pricing: Website monitoring starts at $9/month billed annually, with the Web Perf plan at $36/month and Enterprise Plus Web at $899/month. Infrastructure plans run from a $9/month Lite tier through Professional at $42/month and Enterprise starting at $625/month. A free forever plan and a 30-day trial are available, per the Site24x7 pricing page.
7. Network Miner
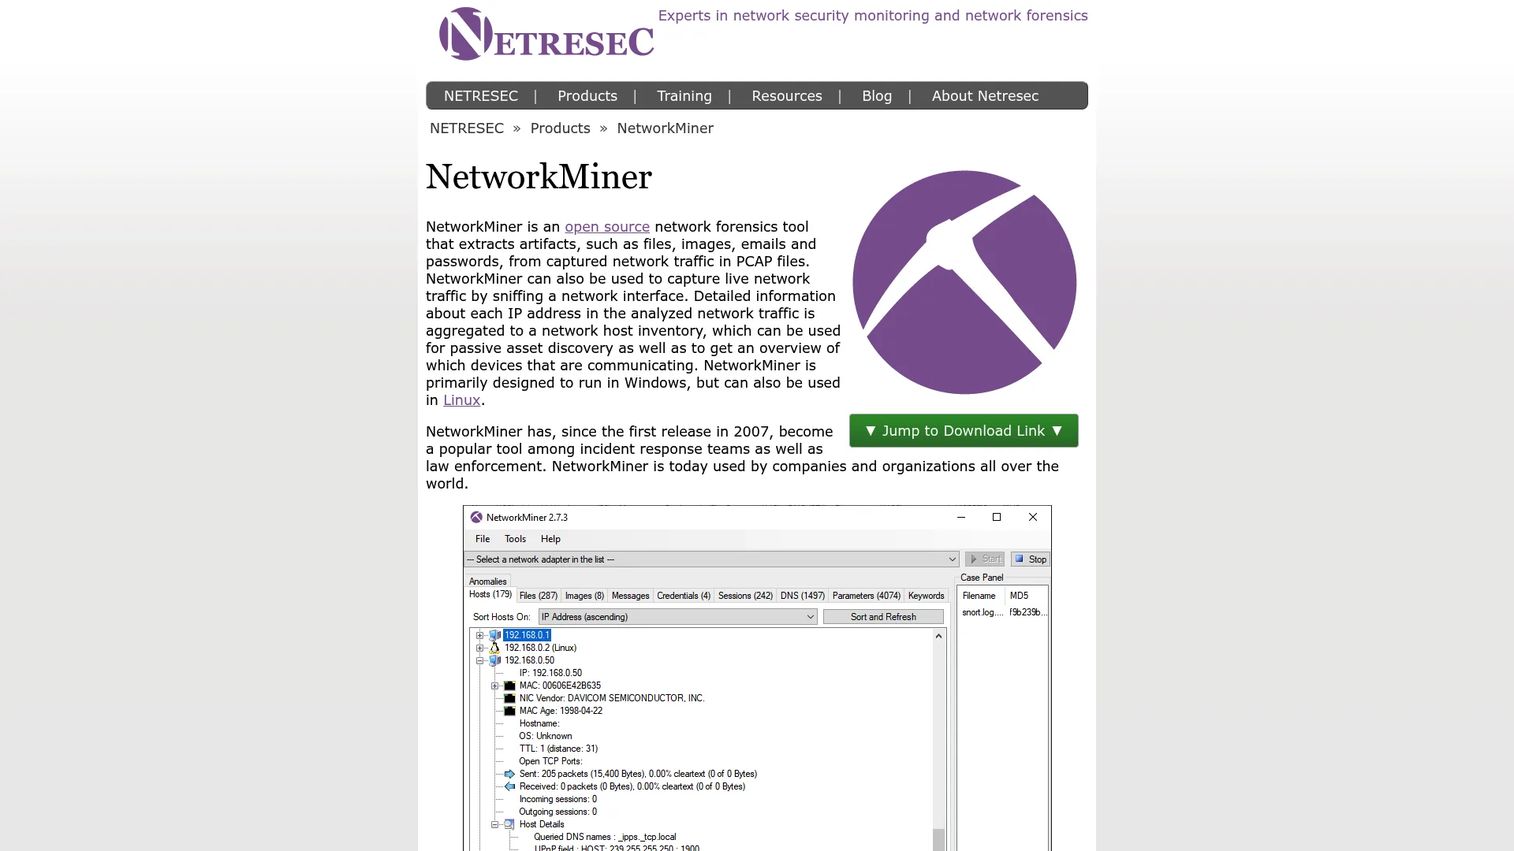
Network Miner is an open-source network forensics tool that works differently from the analyzers above. Instead of showing you a live packet stream, it reads capture files passively and extracts the artifacts inside them: files, emails, images, certificates, passwords, and more. It's built for the investigation that starts after the capture is already saved.
That passive, artifact-first approach is exactly what incident response and forensics teams want. Point it at a pcap, pcapng, or even an ETL file and it reconstructs the files transferred, inventories the hosts involved, fingerprints operating systems, and surfaces credentials or certificates that crossed the wire. It runs on Windows and Linux, and because it never touches live traffic during analysis, it fits cleanly into evidence-handling workflows.
Best for: Incident response and network forensics teams extracting artifacts from packet captures offline.
Key strengths
- Artifact extraction: Pulls files, images, emails, certificates, and credentials out of captured traffic.
- Broad format parsing: Reads pcap, pcapng, and ETL, plus optional live sniffing.
- Host inventory and OS fingerprinting: Builds a picture of who was on the wire and what they ran.
Why choose Network Miner: Choose it when the job is forensic reconstruction, not live troubleshooting. It complements Wireshark rather than replacing it: Wireshark tells you what happened packet by packet, Network Miner tells you what was carried across the wire. It's less suited to real-time latency debugging.
Network Miner pricing: A free edition is available. The Professional single-user license is $1,300 per license and the Corporate license is $6,500, per the Netresec pricing page.
Considerations before you choose
Pricing and ratings narrow the field. These criteria decide the winner for your environment.
Capture depth and protocol decoding
The whole point of packet capture is seeing what summary tools miss. Check how many protocols a tool decodes and how well it follows streams and reassembles sessions. For deep analysis, Wireshark and Omnipeek lead; for flow-level context, NetFlow Analyzer covers the pattern side.
Environment fit
Match the tool to where you actually work. A Windows-heavy fleet gets immediate value from Pktmon with no install. Headless Linux servers call for Tcpdump. Cross-platform analysis workstations run Wireshark. Don't force a GUI tool onto a machine that only has a shell.
Interoperability and export
Captures rarely stay in one tool. Confirm the tool reads and writes pcap and pcapng, and that any native format (like Windows ETL) converts cleanly. Interoperability is what lets you capture in one place and analyze in another without losing fidelity.
Security and forensics support
If investigations are part of the job, weigh evidence handling and artifact extraction. Network Miner is purpose-built for offline forensic reconstruction, while Wireshark covers live investigation and session inspection. Many teams keep both.
Scale and operations
A single analyzer solves incidents. A monitoring platform prevents them. If you need continuous, fleet-wide visibility and alerting, SolarWinds NPM or Site24x7 fit that operational layer, with a dedicated analyzer reserved for the deep dives.
Conclusion
There's no single best packet capture software, only the right tool for the job in front of you. For deep, hands-on analysis, Wireshark is the default and Tcpdump is its command-line partner for remote capture. On Windows, Pktmon gives you native capture with nothing to install. When the need shifts from one capture to fleet-wide visibility, SolarWinds NPM, ManageEngine NetFlow Analyzer, and Site24x7 cover the monitoring and observability layer. For enterprise deep-packet investigation, Omnipeek adds visualization and reporting. And when an incident turns forensic, Network Miner extracts the artifacts a live analyzer won't.
Pick your next step by environment. If you're just getting hands-on, install Wireshark and pair it with Tcpdump today. If you live in Windows, start with Pktmon. If you need always-on monitoring across a large network, evaluate an observability platform and keep an analyzer nearby for the moments packets are the only thing that will settle the argument.
FAQs
Packet capture software records raw network traffic so you can inspect, decode, and analyze it packet by packet. Teams use it to troubleshoot latency and connectivity issues, investigate security events, perform digital forensics, validate product behavior, and confirm compliance. It provides the ground-truth evidence that flow data and metrics can't.
Wireshark is the most widely used packet analyzer and the best starting point for most people, thanks to its deep protocol decoding, powerful display filters, cross-platform support, and free open-source license. Whether it's the best for you depends on the job. For remote CLI capture, Tcpdump fits better; for offline forensic artifact extraction, Network Miner is purpose-built.
Packet capture records the full contents of traffic, so you can read exactly what crossed the wire. Flow monitoring records summaries, who talked to whom, how much, and over which protocol, without storing the full payload. Flow data is lighter and better for always-on trend analysis, while packet capture is essential when you need packet-by-packet detail for root cause analysis or forensics. Many teams use both together.
Yes. Pktmon is built into modern Windows and Windows Server, so you have native packet capture with nothing to install, and it converts its logs to pcapng for analysis in Wireshark. Wireshark itself runs on Windows too, and Network Miner offers a Windows build for forensic analysis.
Very. A saved capture lets analysts reconstruct sessions, confirm whether data left the network, and extract the exact artifacts involved in an incident. Because capture files are timestamped and verifiable, they hold up as evidence in digital forensics and support compliance validation like confirming traffic is encrypted where policy requires.
At minimum, look for pcap and pcapng. Pcap is the classic capture format, and pcapng adds metadata, multiple interfaces, and richer annotations. On Windows, ETL support with clean conversion to pcapng matters so captures open in cross-platform tools. Strong format support is what makes interoperability possible, letting you capture in one tool and analyze in another.
Yes, and it's often the only thing that can settle where the delay lives. Packet-level analysis reveals TCP retransmissions, duplicate ACKs, zero-window events, and the precise timing between packets that cause jitter. When a dashboard says a service is slow but not why, capturing the traffic shows whether the problem sits in the network, the server, or the application.