A release ships on Thursday. By Friday afternoon, activation is down four points. Your team has three theories and two dashboards that contradict each other. Engineering says instrumentation is fine. Growth says the onboarding funnel looks different than last week. Nobody agrees on which event name maps to which step.
The problem is not that mobile analytics exists. The problem is that the tool you picked answers a different question than the one your product is actually asking. Application analytics now accounts for nearly 35% of the mobile analytics market, according to Mordor Intelligence (2026), and the category spans product analytics, attribution, UX behavior, crash monitoring, subscription revenue, and experimentation. Each sub-category runs on different data models and answers different questions.
Choosing the wrong layer means your next release ships with the same blind spots. Choosing the right one means your team can answer "which onboarding event predicts activation?" or "which cohort reached first value fastest?" without another engineering request.
This guide maps 20 mobile analytics software tools to the specific product decisions they support, so you can build a stack that actually fits your instrumentation, your team, and your operating constraints.
What's inside
This guide is for Product Managers, Senior PMs, and Heads of Product evaluating mobile analytics infrastructure. Tools were selected based on:
- Category coverage: Product analytics, attribution, UX behavior, performance monitoring, subscription analytics, ASO, and experimentation
- Mobile support: Verified iOS and Android SDK coverage
- Decision value: Each tool maps to a specific PM question, not a generic feature checklist
- Pricing transparency: Free tiers, usage drivers, and verified plan structures
TL;DR
- Best overall product analytics: Mixpanel or Amplitude, depending on team maturity and depth of behavioral analysis needed
- Best for open source and self-hosted deployment: PostHog, with product analytics, feature flags, and session replay in one platform
- Best for mobile attribution: AppsFlyer or Adjust, covering install attribution, SKAdNetwork, and fraud prevention
- Best for mobile UX research: UXCam, with session replay, heatmaps, and rage tap detection
- Best for privacy-first analytics: TelemetryDeck for cookieless anonymous measurement; Matomo for teams needing full deployment control
- Best free mobile event analytics: Firebase Analytics, available at no cost on both Spark and Blaze plans
What is mobile analytics software?
Mobile analytics software collects, processes, and visualizes data from mobile apps to help teams understand user behavior, app performance, acquisition, retention, and revenue.
Mobile analytics differs from web analytics in several important ways. Apps run across iOS and Android versions simultaneously. They support offline behavior and queue events for delayed delivery. They depend on SDK instrumentation baked into shipped builds, which means broken events require a new release to fix. Apple's App Tracking Transparency framework and Android's evolving privacy model limit identifier access and restrict how attribution data flows. Add crash monitoring, session quality, and in-app purchase tracking, and you're looking at a measurement problem with at least four distinct layers.
Core categories of mobile analytics software
- Product analytics: Events, funnels, cohorts, retention curves, feature adoption, and user paths
- Mobile attribution: Campaign source, install measurement, re-engagement, and marketing performance
- UX analytics: Session replay, heatmaps, gesture tracking, rage taps, and friction signals
- Performance monitoring: Crashes, errors, latency, ANRs, and release health
- Subscription analytics: Trials, renewals, cancellations, entitlements, and in-app purchase revenue
- Experimentation: Feature flags, controlled rollouts, A/B tests, and statistical analysis
- Privacy-first analytics: Anonymous measurement, data minimization, self-hosted deployment, and residency controls
Key capabilities to evaluate
- iOS and Android SDK coverage
- Event taxonomy and governance
- Funnels, cohort analysis, and retention reporting
- User segmentation and path analysis
- Session replay and heatmaps
- Crash and error visibility
- Attribution and campaign measurement
- Warehouse export and integrations
- Privacy controls and data residency
- Free tier limits and event volume drivers
No single tool wins every category. Start with the product question, then find the platform that answers it most directly. For deeper reading on specific layers, see the guides on product analytics, mobile attribution, and session replay.
When to use mobile analytics software
Diagnose activation and onboarding drop-off
You shipped a new onboarding flow and activation dropped. Without funnels and cohort analysis, you're guessing which step is the problem. Product analytics tools let you break the funnel by segment, compare release cohorts, and identify whether the drop-off is happening at a specific screen or event. The output is a roadmap decision, not a dashboard.
Measure feature adoption and retention
Event tracking and behavioral cohorts show whether users discover a feature, return to it, and build a habit around it. Retention curves reveal which segments are churning early and which reach long-term value. Attribution tools connect that behavior back to the acquisition source, so you know whether a retained user came from paid search or organic referral.
Connect acquisition to product outcomes
Attribution tools answer a different question than product analytics. They trace installs and re-engagements back to campaigns, channels, and creative. Teams that stop at install data miss the signal that matters: Which source produced users who actually activate and retain. Many teams run both a product analytics platform and an attribution tool in parallel, feeding data into a warehouse for cross-source analysis.
Mobile analytics software comparison
The table below compares tools by primary job, not by a universal score. Pricing and G2 ratings were verified from each vendor's pricing page and G2 listing as of September 2026.
| # | Product | Best for | Key differentiator | Pricing | G2 rating |
|---|---|---|---|---|---|
| 1 | Mixpanel | Product analytics teams | Event-based funnels, cohorts, and retention | Free tier available | 4.5/5 |
| 2 | PostHog | Engineering-led product teams | Analytics, flags, experiments, and replay in one platform | Free tier available | 4.5/5 |
| 3 | AppsFlyer | Mobile attribution | Campaign measurement, SKAdNetwork, and fraud prevention | Free tier available | 4.5/5 |
| 4 | UXCam | Mobile UX research | Session replay, heatmaps, and rage tap detection | Free tier available | 4.6/5 |
| 5 | Amplitude | Mature product analytics programs | Behavioral analytics, journeys, and experimentation depth | Free tier available | 4.5/5 |
| 6 | Firebase Analytics | Teams already on Google's mobile stack | Mobile analytics connected to Firebase and Google tooling | Free | 4.5/5 |
| 7 | TelemetryDeck | Privacy-focused app analytics | Anonymous, cookieless measurement | Contact for pricing | 4.6/5 |
| 8 | Matomo | Deployment control and privacy | Hosted or self-hosted analytics with full data ownership | Free (self-hosted) | 4.2/5 |
| 9 | Countly | Self-hosted product analytics | Product, marketing, and mobile analytics in one deployment | From $175/mo | 4.1/5 |
| 10 | Adjust | Marketing attribution teams | Mobile measurement, TrueLink deep linking, and fraud prevention | Free tier available | 4.7/5 |
| 11 | Application Insights | Azure and Microsoft environments | Application performance monitoring inside Azure Monitor | Usage-based | N/A |
| 12 | Userpilot | Product adoption workflows | In-app guidance, adoption analytics, and mobile engagement | From $299/mo | 4.6/5 |
| 13 | RevenueCat | Subscription app teams | In-app purchase and subscription revenue analytics | Free up to $2,500 MRR | 4.8/5 |
| 14 | AppFollow | App store and ASO teams | Reviews, ratings, ASO, and sentiment analysis | Free tier available | 4.6/5 |
| 15 | Sentry | Engineering and product teams | Crash and error monitoring with release health | From $29/mo | 4.5/5 |
| 16 | Optimizely | Experimentation programs | Mobile experimentation, feature flags, and rollout controls | Custom pricing | 4.2/5 |
| 17 | Google Analytics for mobile | Teams using Google reporting workflows | Mobile measurement connected to Google marketing products | Free | 4.5/5 |
| 18 | Firebase | Developers building on Google's mobile stack | Broad mobile backend including analytics, Crashlytics, and Remote Config | Free (Spark) | 4.5/5 |
| 19 | BigQuery | Data teams centralizing mobile events | Scalable warehouse analysis and custom modeling | From $6.25/TiB | 4.5/5 |
Pricing and ratings verified September 2026 from each vendor's pricing page and G2 listing.
19 best mobile analytics software tools for product teams in 2026
1. Mixpanel
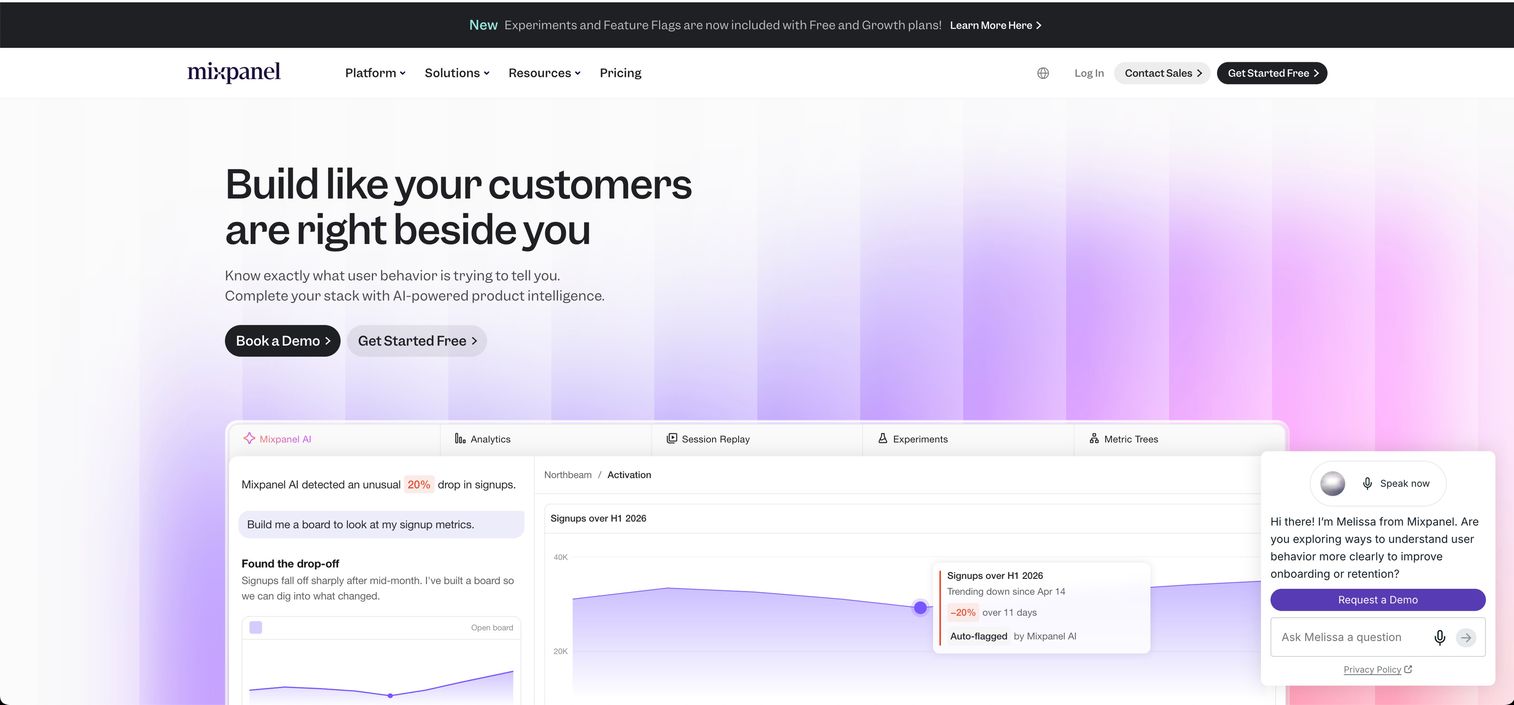
Mixpanel is a unified product intelligence platform covering analytics, experimentation, session replay, and data governance. It centers on an event-based model: Every action a user takes becomes a queryable event, and those events power funnels, retention curves, cohort comparisons, and segmentation. Mobile SDKs for iOS and Android are well-documented and actively maintained.
Best for: Product, engineering, and growth teams that need self-serve behavioral analytics without writing custom SQL.
Key features
- Event-based funnels, cohort analysis, and retention reporting
- Session replay and heatmaps for qualitative context
- Experiments and feature flags
- Metric Trees for connecting events to business outcomes
- AI-assisted analytics and data governance controls
Why choose Mixpanel: Mixpanel fits teams where the PM is the primary analyst. The interface is built for exploration without requiring a data team to run queries. If your biggest question is "where do users drop out of the activation flow?" Mixpanel answers it without engineering overhead.
Mixpanel pricing: Free forever for up to 1M events per month. The Growth plan adds up to 20M events per month and starts at $0 with usage-based volume pricing. Enterprise covers up to 1T events monthly at custom pricing.
G2 rating: 4.5/5
2. PostHog
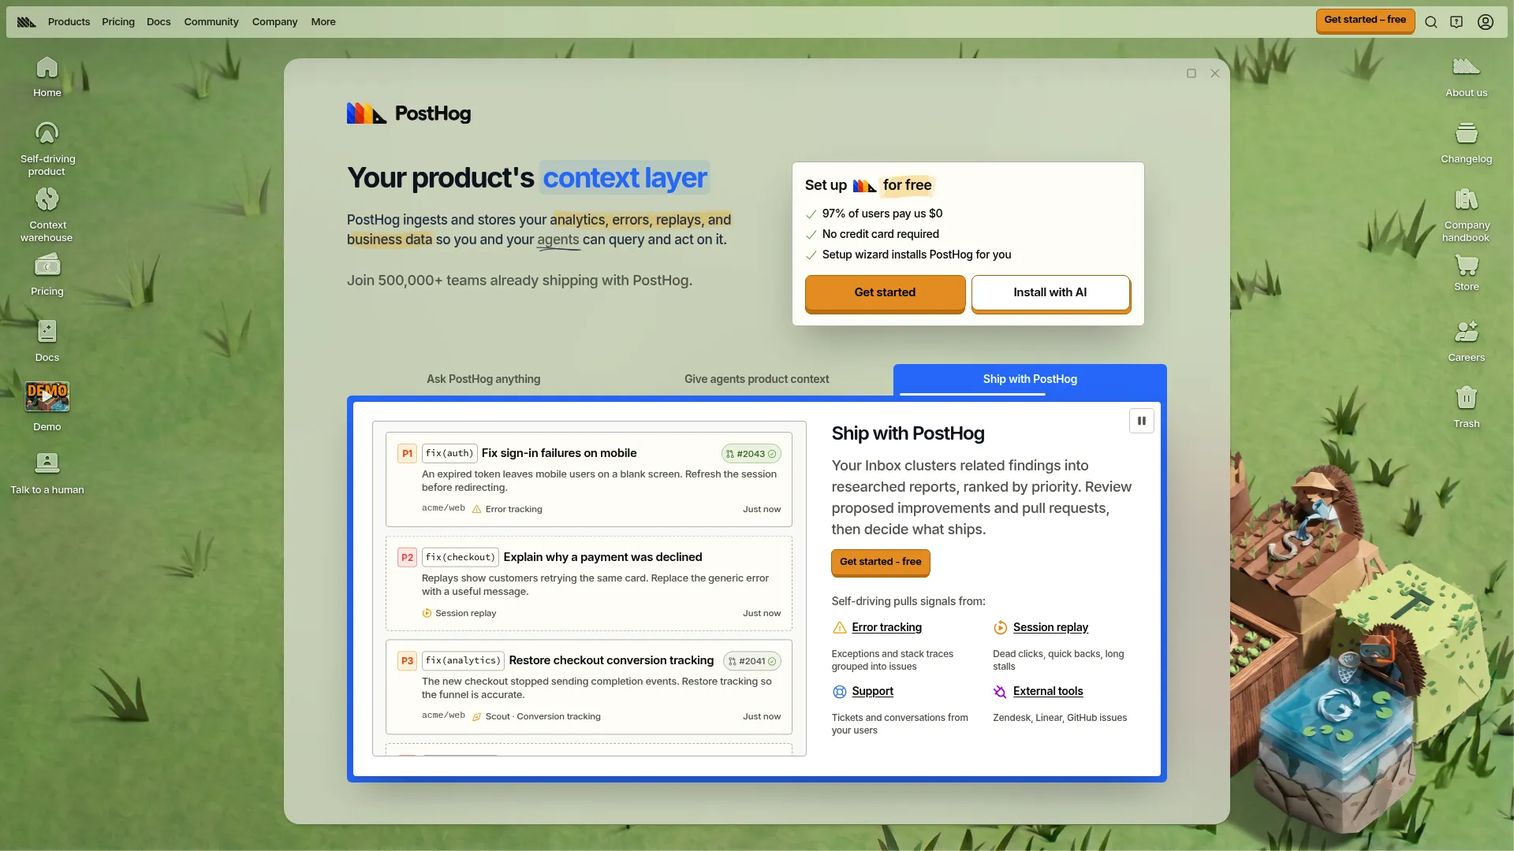
PostHog is an all-in-one product and data platform built for engineering-led teams. It combines product analytics, session replay, feature flags, experiments, surveys, error tracking, and data pipelines in one deployment. Self-hosting is available for teams that need full data control, and a cloud option removes operational overhead.
Best for: Engineering-led product teams that want to reduce tool sprawl and keep product data inside a single platform.
Key features
- Product analytics with funnels, paths, and retention
- Session replay and heatmaps
- Feature flags and A/B experiments
- Surveys and in-app feedback
- Data warehouse connectors and pipeline tools
Why choose PostHog: The appeal is consolidation. Instead of paying separately for analytics, session replay, and feature flags, PostHog covers all three at usage-based rates that scale from early-stage to mid-market. For cohort analysis and experiment-driven PM workflows, it removes the round-trip between tools.
PostHog pricing: The Free plan includes monthly allowances across every product. Pay-as-you-go pricing applies beyond those limits, billed per product per month. No flat seat fee.
G2 rating: 4.5/5
3. AppsFlyer
AppsFlyer is a mobile marketing cloud built around privacy-first attribution. It measures installs, re-engagements, and campaign performance across paid and owned channels, with native SKAdNetwork support for iOS and deep linking via OneLink. Fraud prevention runs through Protect360, which sits alongside the attribution layer rather than requiring a separate integration.
Best for: App marketers and growth teams that need to connect campaign spend to installs and downstream retention.
Key features
- Mobile attribution and real-time measurement
- SKAdNetwork and privacy-first iOS measurement
- Deep linking and OneLink short links
- Audience segmentation and activation
- Fraud prevention with Protect360
Why choose AppsFlyer: AppsFlyer is an attribution platform, not a product analytics tool. The right comparison is whether you need to know which campaign produced retained users, not which screen produced drop-off. Teams that already have a product analytics platform often add AppsFlyer to close the acquisition-to-retention loop. See also the guide on best mobile attribution platforms.
AppsFlyer pricing: The Zero plan is free for owned-media engagement. The Growth plan covers paid campaigns and includes 12,000 free conversions in the first year, then charges $0.07 per conversion. Enterprise pricing is custom.
G2 rating: 4.5/5
4. UXCam
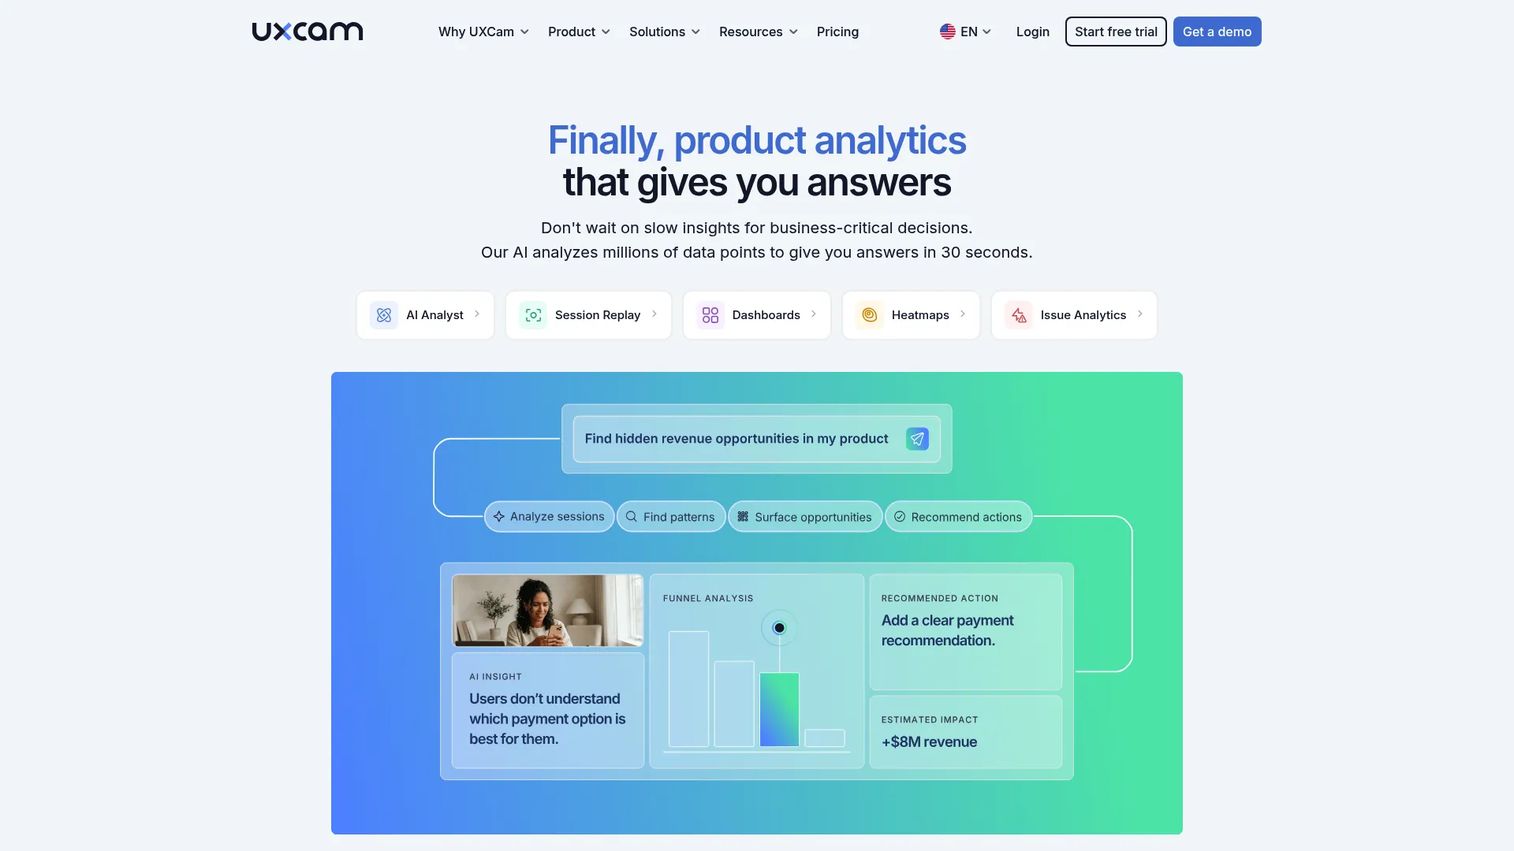
UXCam is a product analytics platform with an integrated AI analyst, built specifically for mobile apps. Session recordings capture taps, swipes, and navigation flows. Heatmaps aggregate touch interactions across screens. Frustration signals flag rage taps, dead clicks, UI freezes, and crash-adjacent sessions automatically, without requiring manual event setup for each friction point.
Best for: Product teams analyzing usability problems, confusing navigation, and conversion friction across mobile app screens.
Key features
- Session recording and replay with full mobile gesture capture
- Touch heatmaps and screen interaction analysis
- Frustration signals: Rage taps, dead clicks, and UI freezes
- Funnel analysis and user journey flows
- Event analytics and user segmentation
Why choose UXCam: Behavioral event analytics tells you what happened. Session replay shows you why. UXCam earns its place when your funnel data points to a drop-off but the event log doesn't explain the cause. It's particularly useful for diagnosing onboarding screens where user intent and interface behavior diverge.
UXCam pricing: The free plan covers 3,000 monthly sessions with no