


Your retention chart is trending down. You know that much. What you don't know is which group of users started leaving, when they signed up, or what changed in the product right before they went quiet.
Aggregate dashboards hide all of that. A single retention number averages your best week-one cohort against your worst, then hands you a line that tells you nothing you can act on. You cannot ship a fix against an average.
That gap is why cohort analysis exists. Grouping users by signup date, plan, channel, or behavior lets you see the exact cohort that changed and tie it back to a product decision. According to Market Growth Reports (2024), 69% of U.S. SaaS companies use product analytics software specifically for cohort analysis, ahead of the 63% who use it for funnel visualization. Cohort work is now the default way product teams connect onboarding, activation, and retention to what they build next.
This guide compares eight cohort analysis tools for product, growth, and analytics teams. The focus is practical: which platform surfaces the drop-off, which fits your data maturity, and which one your team will actually open on a Monday.
What's inside
This guide is for product managers, growth leads, and analysts who need to run customer cohort analysis and choose a platform for it. Each tool was evaluated against the criteria that decide real adoption, not feature-sheet length.
- Cohort flexibility: acquisition, behavioral, and predictive cohorts, not just date-based grouping
- Retention visualization: readable curves, heatmaps, and cohort tables non-analysts can interpret
- Integrations: CDP, warehouse, CRM, and product data source fit
- Ease of use and measurement depth: speed to insight versus how much analyst time it demands
TL;DR
- Best for product analytics: Mixpanel and Amplitude for event-based cohort retention analysis and behavioral cohorts.
- Best for BI and executive reporting: Looker for warehouse-native modeling, Abacum for finance-led cohorts.
- Best for lighter web and acquisition analysis: Google Analytics 4 (GA4).
- Best for autocapture and less manual instrumentation: Heap.
- Best for classic retention and privacy-first analysis: Kissmetrics and Matomo.
- Best for broad cohort plus funnel visibility: Mixpanel remains the safe default for most product teams.
What is cohort analysis software?
Cohort analysis software groups users into cohorts based on shared traits or timing, then tracks how each group behaves over time to reveal retention, churn, and engagement patterns that aggregate reporting hides.
Instead of one blended retention number, you see how the January signups retain versus March, or how users who hit an activation event retain versus those who didn't. That difference is where product decisions live.
Most tools support three cohort types:
- Acquisition cohorts: group users by when they joined or which channel brought them in, useful for comparing signup weeks or paid versus organic retention.
- Behavioral cohorts: group users by an action they took, like completing onboarding or using a key feature, the core of behavioral cohort analysis.
- Predictive cohorts: use AI or forecasting to project which users are likely to retain or churn, so you intervene before the drop-off.
Cohort reporting differs from aggregate reporting because it preserves the time and event dimension. It also differs from static segmentation, which takes a snapshot of a group at one moment. A segment tells you who your power users are today. A cohort tells you whether last quarter's onboarding change made them power users at all. Cohort modeling is what turns that grouping into a repeatable retention view.
Features to expect from a strong platform:
- Retention curves and cohort heatmaps for cohort visualization
- Behavioral and acquisition cohort builders
- Segmentation by persona, plan, channel, and lifecycle stage
- Data connectors to your warehouse, CDP, and CRM
- Real-time dashboards and exportable cohort tables
- Churn rate, CLV, and ARPU tracking at the cohort level
When to use cohort analysis software
Improve onboarding and activation
Reach for cohort analysis when you need to compare first-week behavior across signup dates, plans, or personas. If your D7 activation dips, a cohort view shows whether it dropped for everyone or only for a specific plan tier. That is how you tie a change in time to first value back to a specific onboarding step, not a vague hunch.
Reduce churn and improve retention
Retention curves make the drop-off visible. You see exactly which week users leave, and behavioral cohorts tell you what the retained users did differently. That timing is your intervention window. If churn spikes at week three, you build the nudge for week two, not month two.
Prove product changes worked
After a launch or an onboarding rework, compare the before-and-after cohorts. If the post-change cohort retains better at the same interval, you have evidence the change moved the metric, not a coincidence. This is the difference between "we think it helped" and a roadmap decision you can defend in a review.
Comparison table
The tools below are sorted by relevance to product-team cohort work, not alphabetically. Pricing and G2 ratings reflect verified current values where publicly available. Use this as a shortlist, then read the sections for fit against your stack.
| # | Product | Best for | Key differentiator | Pricing | G2 rating |
|---|---|---|---|---|---|
| 1 | Mixpanel | Self-serve product cohort analysis | Event-based funnels, retention, and cohorts | Free tier; Growth starts at $0 usage-based | 4.5/5 |
| 2 | Amplitude | Behavioral and predictive product analytics | Analytics with experimentation and session replay | Free tier; Growth and Enterprise custom | 4.5/5 |
| 3 | Google Analytics 4 (GA4) | Web and acquisition cohort reporting | Free analytics with Google ecosystem integration | Free for small business | 4.5/5 |
| 4 | Looker | Warehouse-native BI and executive dashboards | Semantic modeling for custom cohort logic | Call sales | 4.4/5 |
| 5 | Abacum | Finance-led cohort and forecasting | AI-native FP&A for LTV, ARPU, and churn | Custom pricing | 4.7/5 |
| 6 | Heap | Autocapture behavioral cohorts | Automatic event capture, retroactive analysis | Free tier; paid contact sales | 4.4/5 |
| 7 | Kissmetrics | Person-level retention analysis | Person-level tracking with revenue attribution | From $99/month | 4.1/5 |
| 8 | Matomo | Privacy-first cohort reporting | Self-hosted option with full data ownership | Free Community; Team from €275/mo | 4.2/5 |
Best 8 cohort analysis software for 2026
1. Mixpanel
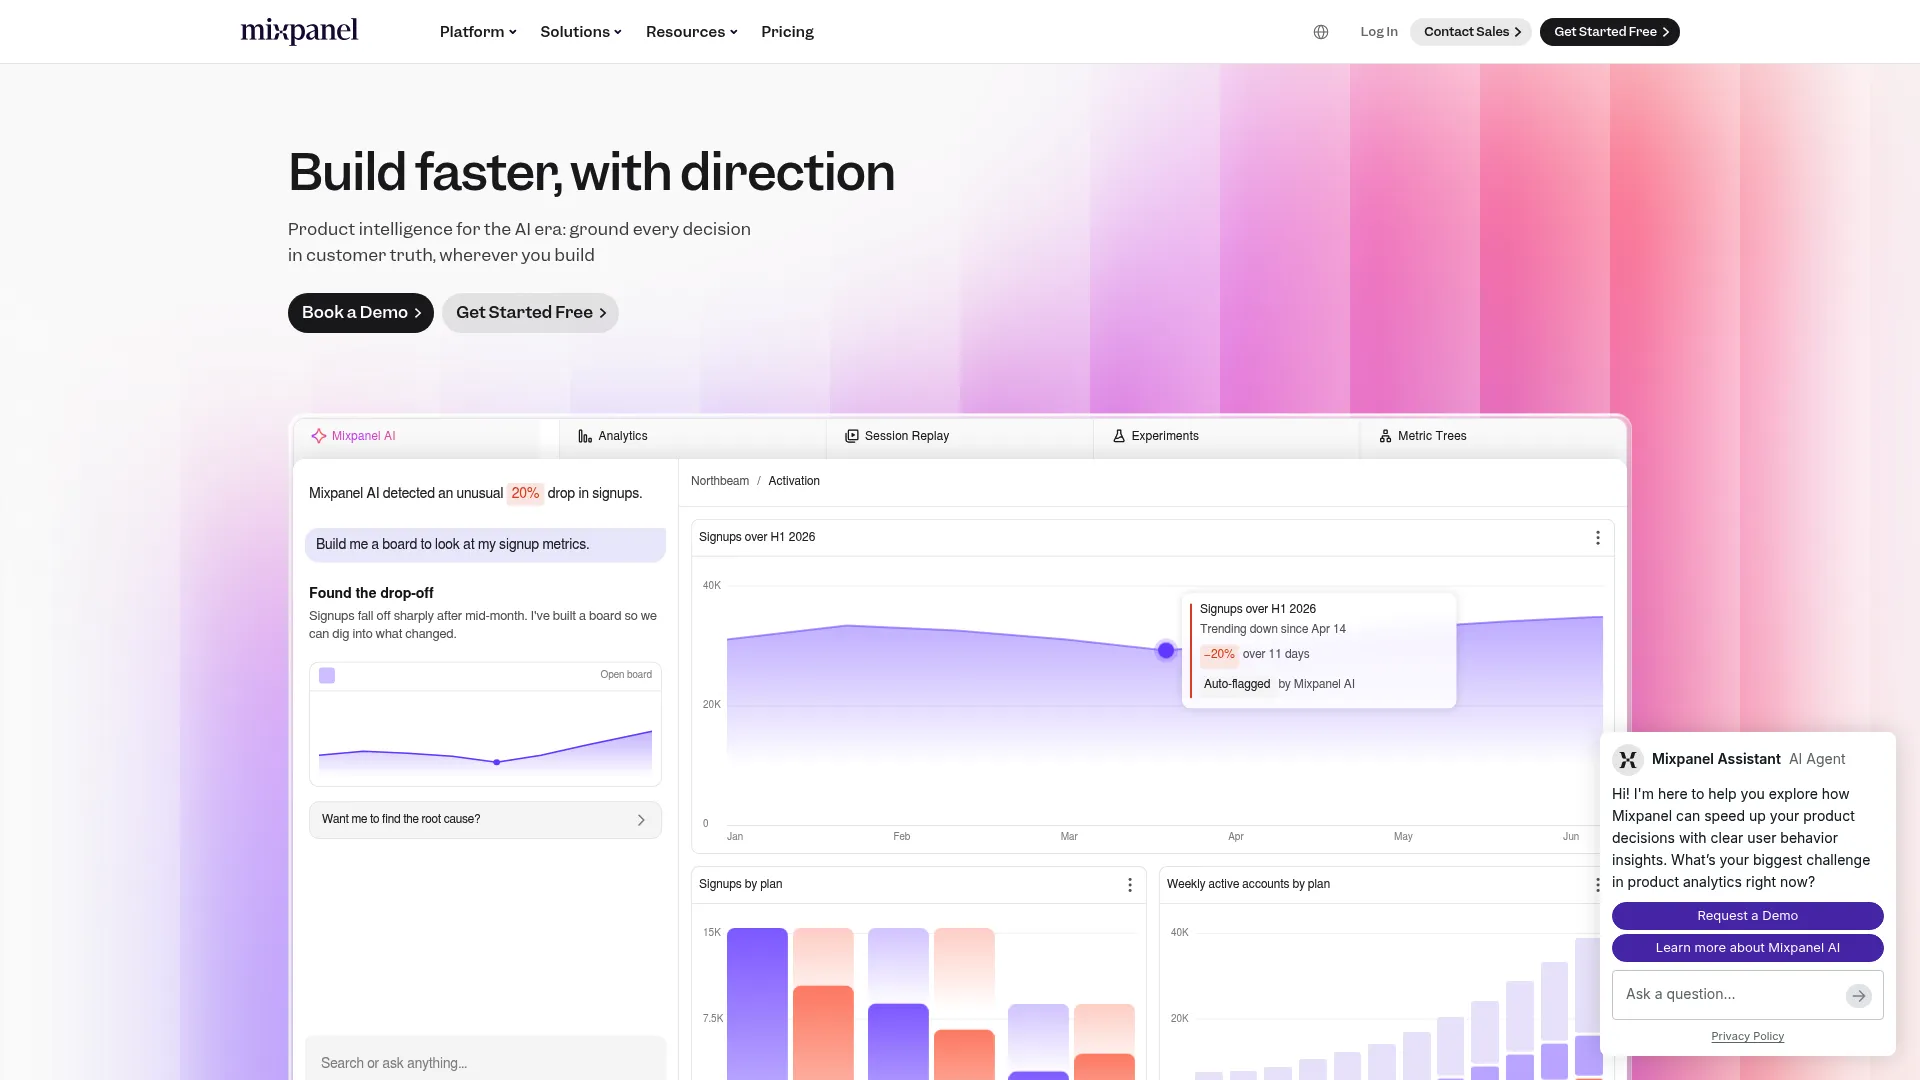
Mixpanel is a product analytics platform built for understanding user behavior and optimizing product growth. It leans on event-based tracking, so cohort retention analysis, funnels, and behavioral cohorts sit in the same self-serve workflow. For a PM, that means you can build a cohort of users who completed onboarding and watch their retention curve without filing a data request.
The self-serve exploration is why product teams keep it as a default. You define an activation event, split by plan or channel, and read the heatmap in minutes. Session replay and AI-powered analytics add context to the where and the why behind a drop-off.
Best for: Product and growth teams that want fast, self-serve cohort and funnel analysis without heavy analyst dependency.
Key strengths
- Event-based product analytics
- Funnels, retention, cohorts, and flows
- Session replay and AI-powered analytics
Why choose Mixpanel: If your team wants to answer retention questions in the moment rather than wait on a warehouse query, Mixpanel fits. It rewards clean event instrumentation with fast behavioral cohort analysis.
Mixpanel pricing: Free plan available forever. The Growth plan starts at $0 with usage-based pricing after the first million monthly events. Enterprise is custom, contact sales.
2. Amplitude
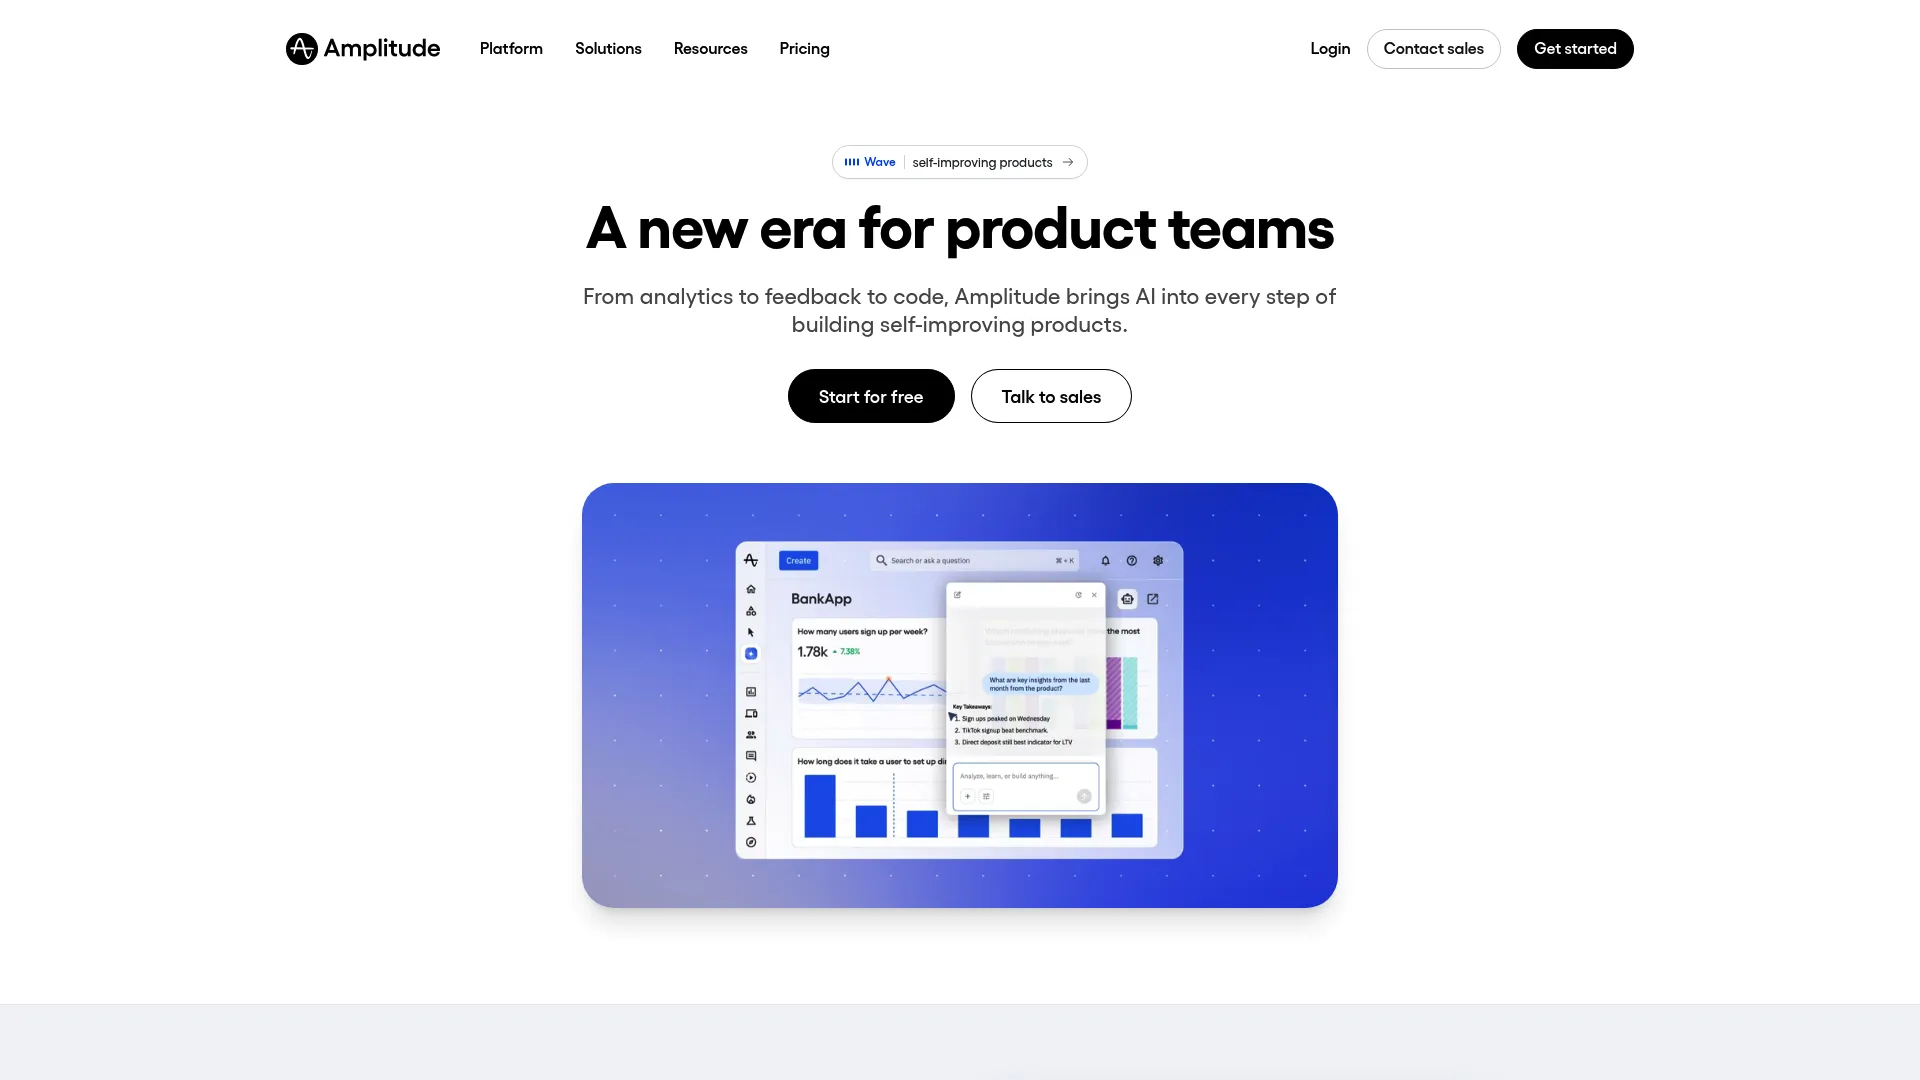
Amplitude is an AI analytics platform for product, web, and customer behavior insights. It goes deep on retention cohorts and behavioral analysis, and it pairs analytics with experimentation, so you can test a change and read the cohort impact in the same system. That loop matters when you need to prove a product change moved retention.
Amplitude leans into predictive cohort analysis, surfacing which users are likely to retain or churn. For product-led growth teams tracking activation across segments, that forward-looking view helps you intervene earlier rather than react to a dead cohort.
Best for: Product and growth teams needing deep behavioral analysis, experimentation, and product-led growth visibility.
Key strengths
- Product analytics
- Session replay
- Experimentation and feature flags
Why choose Amplitude: Choose Amplitude when experimentation and cohort measurement need to live together. The tie between a feature flag and its retention cohort is the payoff for teams running frequent tests.
Amplitude pricing: Free plan is completely free with no credit card and no time limit. The Plus plan starts at $0 and scales with event volume. Growth and Enterprise are custom-priced.
3. Google Analytics 4 (GA4)

Google Analytics 4 (GA4) is Google's web and app analytics product for understanding user behavior and marketing performance. It handles acquisition cohorts and traffic-source analysis well, with built-in retention views that suit teams already living in the Google ecosystem. If your cohort questions are mostly about which channel retains, GA4 answers them at no cost.
Its predictive capabilities and cross-platform attribution reporting extend the basic cohort views. GA4 performs best for web-focused retention cohorts and acquisition analysis rather than deep in-product behavioral cohorts, which is why many teams pair it with a dedicated product analytics tool.
Best for: Teams needing free website and app analytics with tight Google ecosystem integration.
Key strengths
- Real-time reporting
- Predictive capabilities
- Cross-platform attribution reporting
Why choose GA4: If budget is tight and your priority is acquisition cohorts and channel retention, GA4 covers it for free. It fits web-first teams more than deep product instrumentation.
GA4 pricing: Google Analytics is free for small businesses. Analytics 360 is available for larger organizations with pricing handled directly by Google.
4. Looker
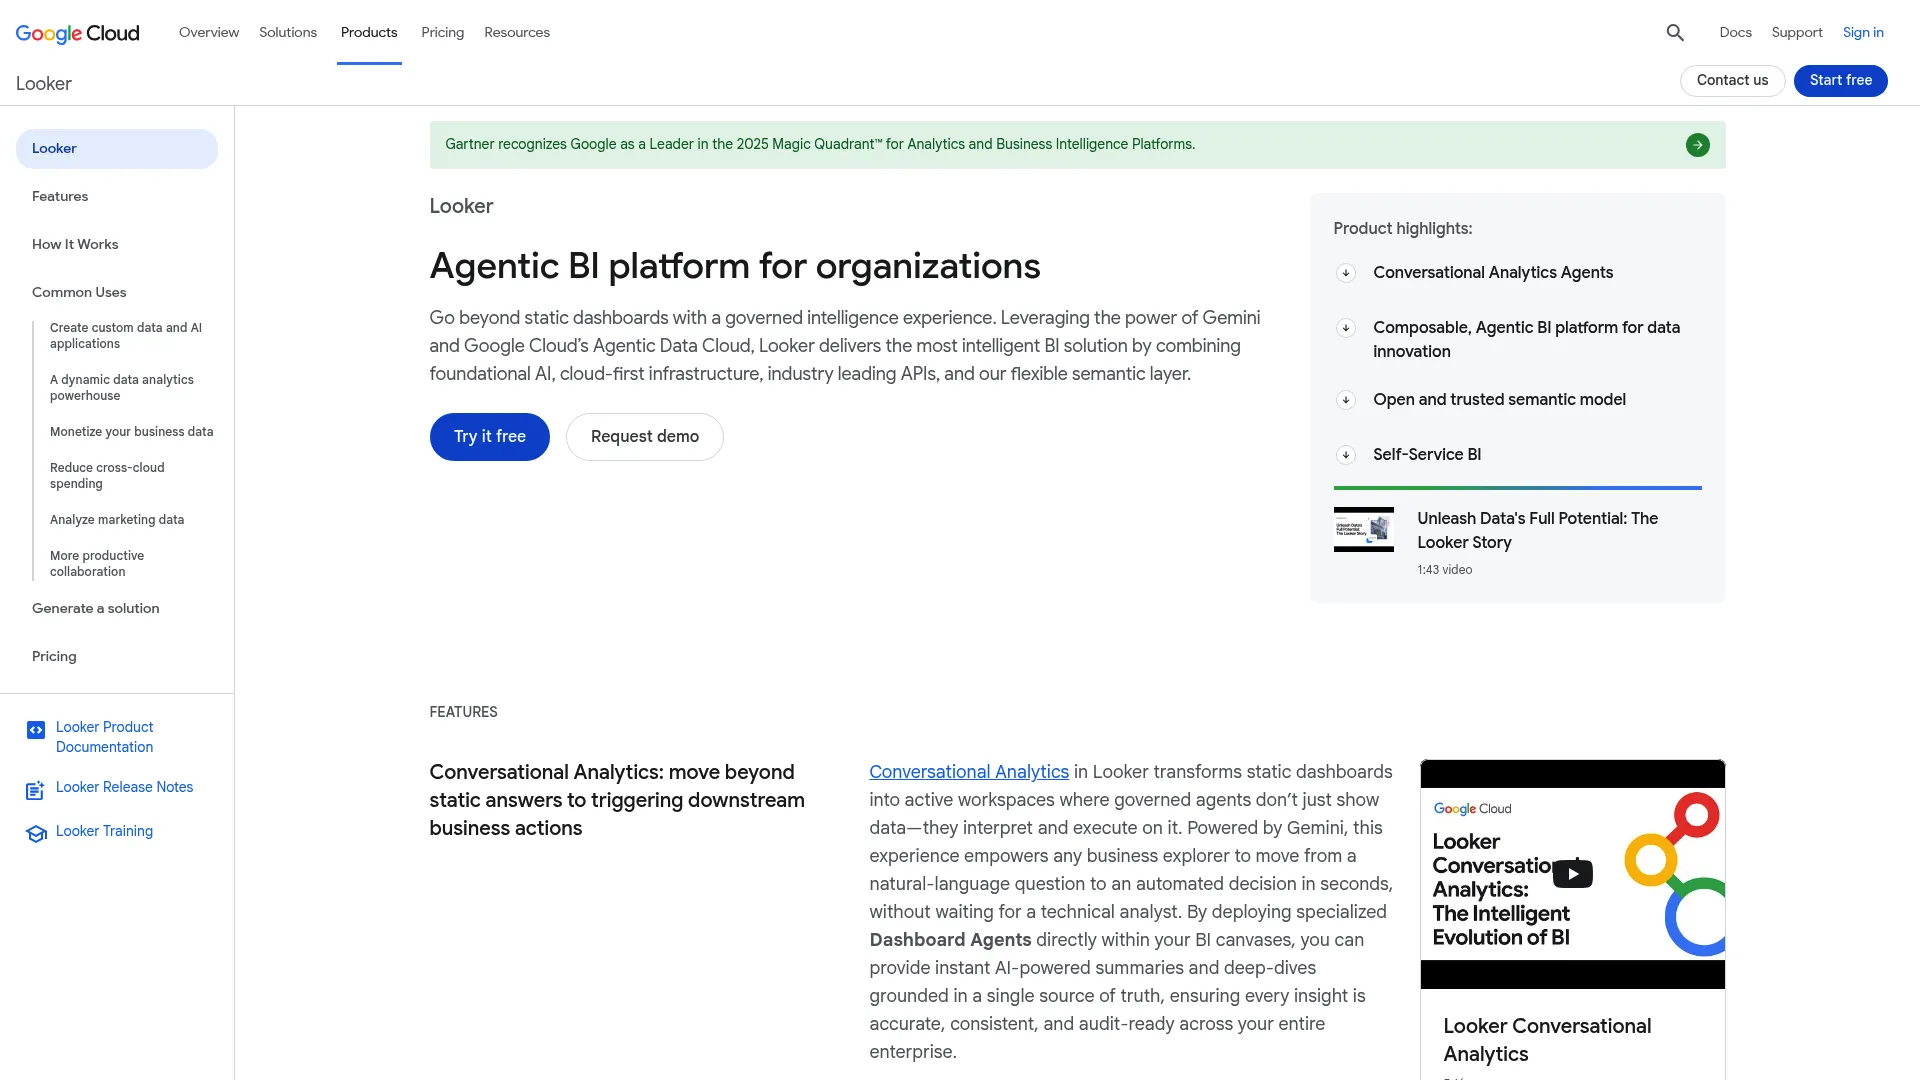
Looker is a business intelligence and analytics platform from Google Cloud. When your cohort logic lives in the warehouse, Looker lets a data team model it once in the semantic layer and serve governed, executive-ready dashboards to everyone else. That is warehouse-native analytics done properly, with a single source of truth for how a cohort is defined.
For analytics-heavy orgs, this is the point. Custom cohort modeling that a PM cannot easily replicate in a self-serve tool becomes a maintained metric. Embedded analytics also let you push those cohort views into other internal apps.
Best for: Data and product teams whose cohort definitions live in the warehouse and need governed, consistent reporting.
Key strengths
- Self-service and governed BI
- Semantic modeling and metrics
- Embedded analytics and custom applications
Why choose Looker: Pick Looker when consistency of cohort logic across the org matters more than instant self-serve exploration. It rewards teams with warehouse discipline and a data function to maintain models.
Looker pricing: Looker uses separate platform and user pricing. Public editions are listed as call sales on the Google Cloud pricing page, billed on annual commitment.
5. Abacum

Abacum is an AI-native FP&A platform for financial planning, forecasting, reporting, and analytics. It fits teams that connect product cohorts to financial planning, translating retention curves into LTV, CAC, ARPU, and churn that a finance lead can forecast against. When cohort analysis needs to inform a budget, Abacum is where those numbers land.
Its self-service integrations and ETL pull data together for scenario planning. For a founder or head of product working with finance, Abacum turns cohort behavior into a forward-looking model rather than a retrospective chart.
Best for: Mid-market finance teams connecting product cohort behavior to LTV, ARPU, and forecasting.
Key strengths
- AI-native FP&A workflows
- Self-service integrations and ETL
- Budgeting, forecasting, and scenario planning
Why choose Abacum: Choose Abacum when cohort insight has to feed financial planning. It is the bridge between a retention cohort and a revenue forecast, not a product-instrumentation tool.
Abacum pricing: Pricing is tailored and quoted on request, based on entities, users, and modules. No public numeric pricing is published.
6. Heap

Heap is product analytics software that automatically captures user behavior, then helps teams analyze journeys, conversions, and retention. The autocapture model is the draw: you don't have to define every event in advance, so you can build behavioral cohorts retroactively against data you already collected. For teams tired of manual instrumentation, that removes a real bottleneck.
That retroactive analysis means when a PM asks a new cohort question next quarter, the data is already there. Session replay adds the qualitative layer behind a cohort's drop-off.
Best for: Teams that want autocapture-based product analytics with retroactive cohort analysis and less manual instrumentation.
Key strengths
- Automatic capture of user interactions
- Session replay
- Integrations across the stack
Why choose Heap: Pick Heap when you want to ask cohort questions you didn't plan for at instrumentation time. Autocapture means the data is waiting when the question arrives.
Heap pricing: Free plan available at $0. Growth, Pro, and Premier tiers are quoted by contacting sales, with add-ons for experience analytics, data history, and more.
7. Kissmetrics
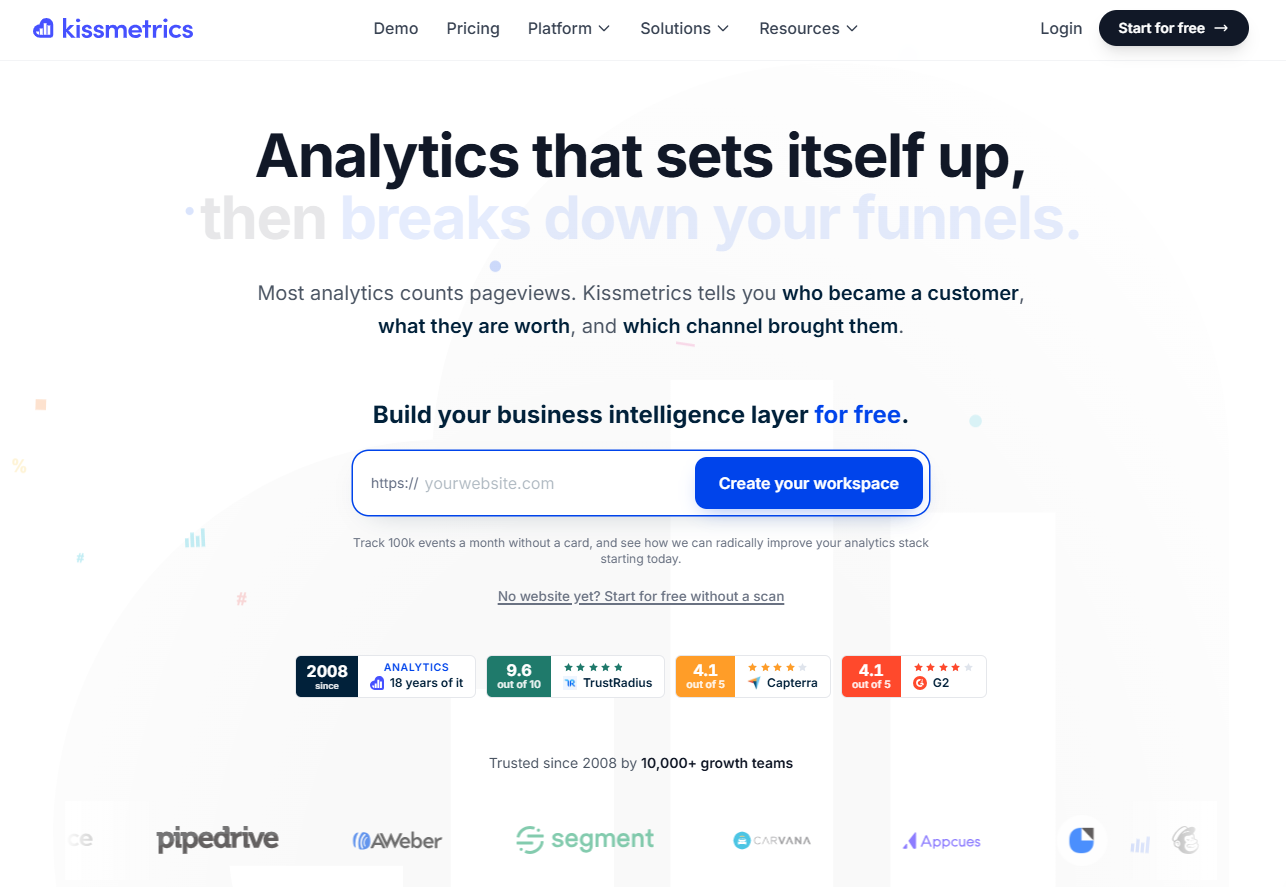
Kissmetrics is a person-level digital analytics platform for tracking users, funnels, cohorts, campaigns, and revenue attribution. Its person-level model links funnel behavior to cohort retention and revenue, which suits classic SaaS retention and lifecycle analysis. If you want to know which cohort actually paid and stayed, Kissmetrics ties the behavior to the dollars.
The funnel-to-cohort link is its practical strength. You follow a user from first touch through activation to revenue, then group and compare cohorts on that full path.
Best for: Teams needing person-level behavioral analytics with funnel, cohort, and revenue attribution in one view.
Key strengths
- Person-level tracking
- Funnels and cohort reporting
- Behavioral email campaigns and workflows
Why choose Kissmetrics: Choose Kissmetrics for straightforward cohort tracking tied to revenue. Its person-level view fits lifecycle analysis where you care about who converted, not just page-level events.
Kissmetrics pricing: The Self-Serve plan starts at $99/month and includes 500,000 events plus a 7-day free trial. Accelerator and Custom plans are quoted by sales.
8. Matomo
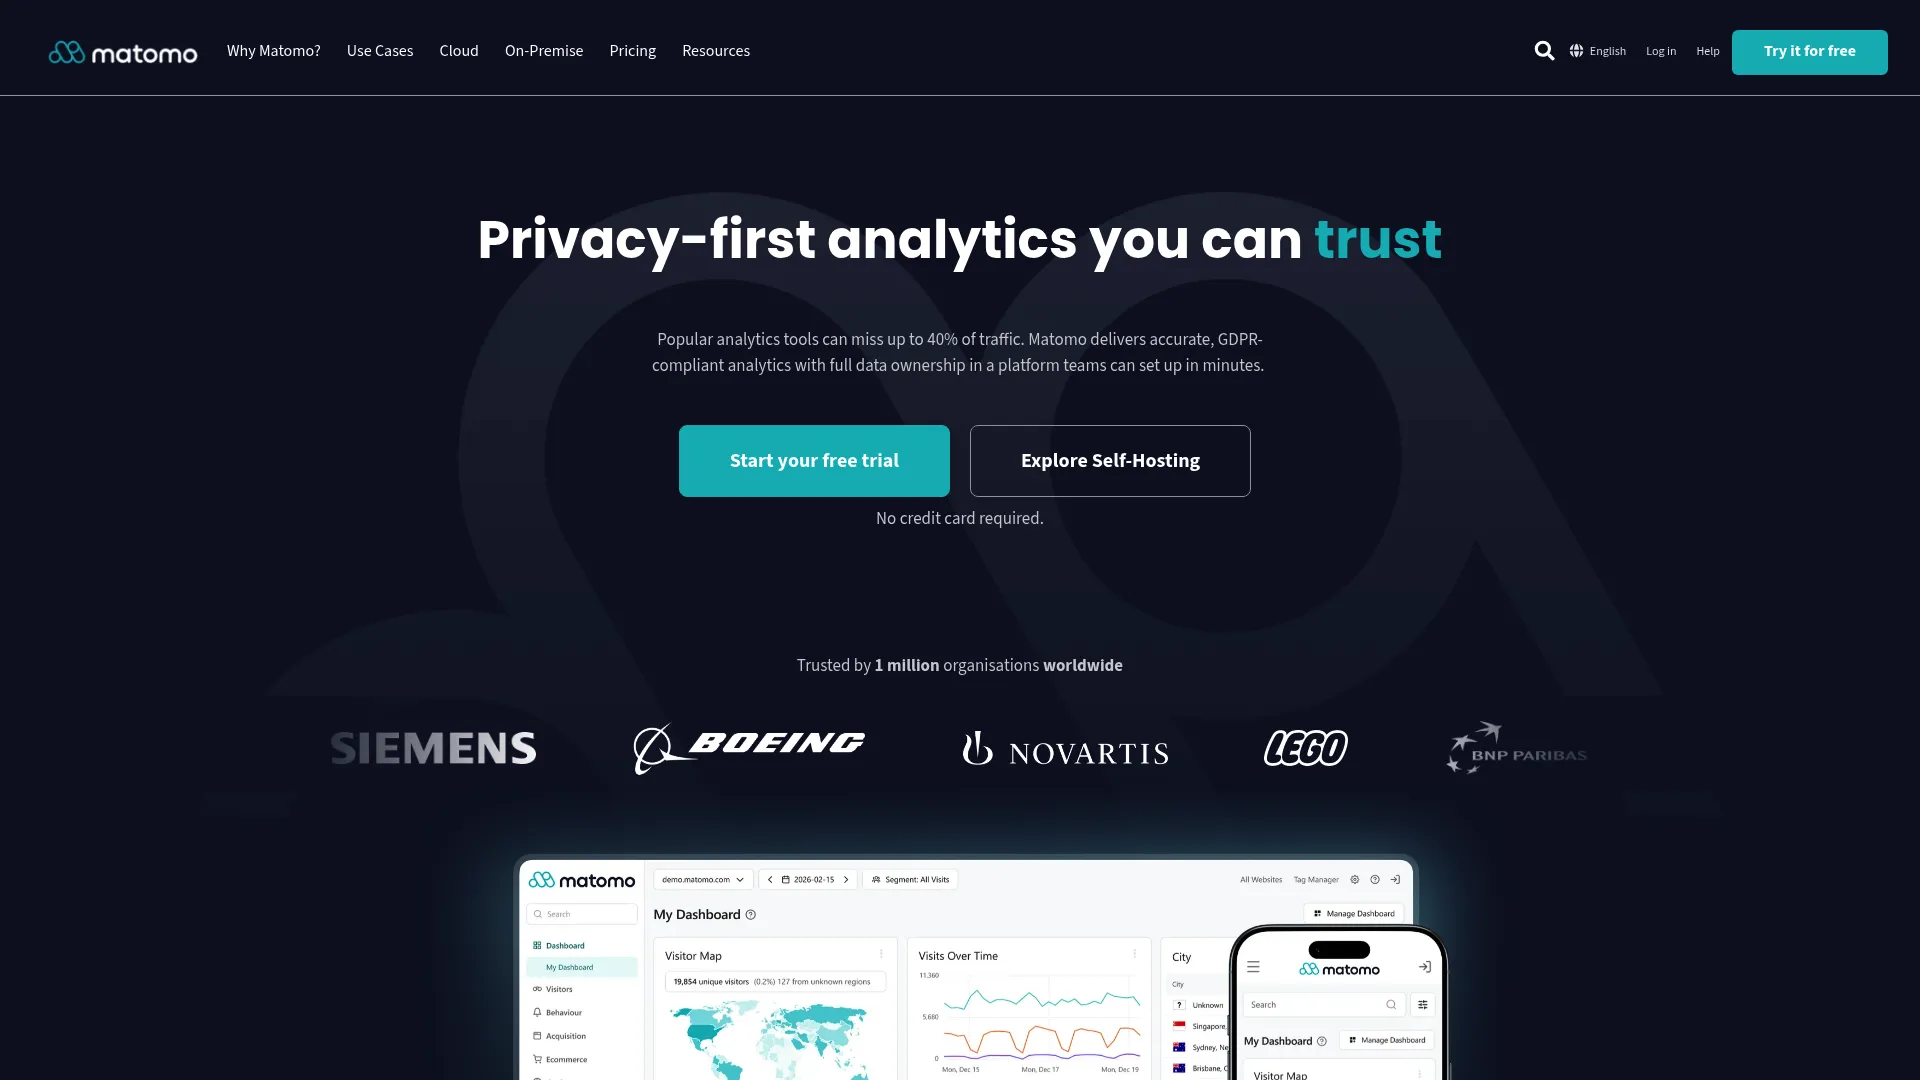
Matomo is a privacy-focused web analytics platform with cloud and self-hosted options. For teams that need control over data ownership, the self-hosted deployment keeps every record on your own infrastructure while still giving you cohort-style retention reporting. When compliance or data residency drives the decision, Matomo is the answer that keeps you in control.
It also imports Google Analytics data and includes heatmaps and session recordings, so a privacy-conscious team gets behavioral context alongside cohort reporting without handing data to a third party.
Best for: Teams wanting privacy-friendly analytics with full data ownership through cloud or self-hosted deployment.
Key strengths
- Web analytics and reporting
- Heatmaps and session recordings
- Google Analytics import and tag manager
Why choose Matomo: Pick Matomo when data ownership and privacy are non-negotiable. Self-hosting trades convenience for control, which is exactly what regulated or privacy-first teams need.
Matomo pricing: The Community plan is free forever and self-hosted. Paid On-Premise bundles include Team at €275/month, Business at €1,450/month, Enterprise at €3,400/month, and a custom-priced VIP tier.
Considerations
Data freshness and instrumentation
Cohort insights are only as good as the tracking behind them. Inconsistent events, broken identity resolution, or a shifting source of truth will produce cohorts that lie to you. Before you trust a retention curve, confirm your event naming is consistent and users are stitched to a single identity across sessions and devices.
Segmentation flexibility
The tool has to split cohorts the way you actually think about users: by persona, plan, channel, and lifecycle stage. If you cannot isolate the enterprise trial cohort from the SMB self-serve one, you cannot tie an onboarding change to the segment it affected. Check that segmentation goes as deep as your activation questions demand.
Visualization and interpretation
A cohort table is useless if only the analyst can read it. Look for retention curves, heatmaps, and clear cohort tables that a PM or CS lead can interpret without a walkthrough. Readable cohort visualization is what turns a chart into a shared decision.
Integrations and stack fit
The platform must connect to your CDP, warehouse, BI, CRM, and product data sources. A cohort tool that cannot pull from where your data already lives becomes a silo, and a silo is where analysis goes to die. Confirm the data connectors match your existing analytics stack before you commit.
Operational overhead
Some tools deliver cohorts self-serve; others need analyst time and engineering support to maintain. Weigh how much ongoing effort each demands against your team's capacity. The best tool is worthless if maintaining it competes with shipping features, so match the operational cost to the bandwidth you honestly have.
Conclusion
For most product teams, Mixpanel or Amplitude covers the core of customer retention analysis: event-based cohorts, readable retention curves, and behavioral analysis that ties a change to a metric. Amplitude edges ahead when experimentation and predictive cohorts matter; Mixpanel wins on fast self-serve exploration.
If your work is web and acquisition focused, GA4 handles acquisition cohorts and channel retention for free. For data-heavy orgs, Looker gives you governed cohort modeling in the warehouse, and Abacum connects those cohorts to financial forecasting. Heap suits teams that want autocapture and retroactive cohorts, while Kissmetrics and Matomo cover person-level retention and privacy-first deployment respectively.
The best cohort analysis software is the one your team will open consistently and trust. Match the tool to your data maturity and workflow, confirm your instrumentation is clean, and start with the platform that answers your most pressing retention question first.
FAQs
It groups users into cohorts and tracks how each group behaves over time to reveal retention, churn, activation, and engagement patterns that aggregate reporting hides. Teams use it to see exactly which cohort dropped off and tie that change to a product or onboarding decision.
Segmentation takes a static snapshot of a group at one moment, like your current power users. Cohort analysis is time-based or event-based, tracking the same group forward to show how behavior evolves. A segment tells you who someone is today; a cohort tells you whether a past change made them that way.
Product analytics-first tools like Mixpanel and Amplitude tend to fit PMs best because they support self-serve behavioral cohorts and retention curves without heavy analyst dependency. BI-first tools like Looker suit teams whose cohort logic lives in the warehouse and needs governed, consistent definitions across the org.
Yes. Retention curves show the exact week or period where users drop off, and behavioral cohorts reveal what the retained users did differently. That timing gives you a clear intervention window, so you can build a fix before the drop-off rather than after users have already left.
Track retention rate, activation rate, churn rate, and time to first value at the cohort level. For revenue-linked analysis, add CLV and ARPU so you can compare which cohorts pay and stay, not just which ones stay active.
Not always. Standalone product analytics platforms like Mixpanel, Amplitude, and Heap run cohort analysis without a warehouse. Warehouse-native tools like Looker help when cohort logic is complex, must be governed centrally, or needs to join data across many sources your product analytics tool cannot reach alone.
Predictive cohort analysis uses AI or forecasting to project which users are likely to retain or churn based on early behavior. Instead of waiting for a cohort to decay, you get a forward-looking signal that lets you intervene while the cohort is still active.
Choose GA4 for free web and acquisition cohorts if you live in the Google ecosystem. Choose Mixpanel for fast self-serve product cohort and funnel analysis. Choose Amplitude when you need deep behavioral analysis, experimentation, and predictive cohorts tied together. Your stack maturity and how much in-product instrumentation you have usually decide it.