Production breaks at 2 a.m. The first place your on-call engineer looks is the logs. But between microservices, containers, cloud regions, and third-party APIs, those logs are scattered across a dozen sources, in five formats, with no shared timestamp. The signal is in there somewhere. Finding it before the SLA burns is the hard part.
That is the real problem log analysis software solves. Not "storing logs" but turning a flood of machine-generated text into the specific line that explains why a request failed, a deploy regressed, or an account got compromised. As systems get more distributed and log volume climbs, the gap between "we have the data" and "we found the answer" is where MTTR quietly balloons.
The market reflects the pressure. The global log analysis software market is projected to grow from USD 0.88 billion in 2025 to USD 1.81 billion by 2033, a 9.5% CAGR, according to Business Research Insights (2024). The closely related log management market was forecast to reach USD 4.1 billion by 2026 at an 11.9% CAGR, per MarketsandMarkets (2021), driven largely by rising cyberattack sophistication and compliance requirements.
For product managers, this is not just an infra concern. Logs are the fastest path from a user complaint to a root cause, and often the only evidence of whether a release caused a regression, a support spike, or a conversion drop. Choosing the right log analysis tools affects release confidence, support deflection, and how quickly your team stops shipping blind. If you also evaluate adjacent governance tooling, guides like audit management software and best AI security posture management tools cover the compliance and security side that often sits next to logging.
What's inside
This guide compares seven log analysis software tools for teams that need faster troubleshooting, real-time alerting, centralized visibility, and security or compliance support. We evaluated each tool against five criteria: log collection and parsing, search and visualization, alerting and anomaly detection, scale and retention, and how well it integrates into the broader observability or security stack. The list is aimed at product managers and technical buyers who need to reduce MTTR and improve release confidence, not just define the category. Every tool here is a serious contender, so the real question is which one matches your volume, retention, and incident workflow.
TL;DR
- Best overall for broad log analysis and observability: Splunk, for mature search and enterprise security workflows.
- Best for logs tied to metrics and traces: Datadog, when you want one observability control plane.
- Best for open, flexible log pipelines: Elastic Stack, for teams that want control over collection and indexing.
- Best for simpler centralized log management: Graylog, for straightforward centralized logging and SIEM.
- Best for log data optimization and routing: Cribl, to reduce noise and control cost before storage.
- Best for cloud-native log analytics: Logz.io, for managed infrastructure and fast setup.
- Best for a balanced, easy-to-deploy platform: Sumo Logic, for cloud SIEM plus log analytics in one place.
What is log analysis software?
Log analysis software is a category of log management software that collects, parses, indexes, searches, visualizes, and alerts on machine-generated log data so teams can troubleshoot issues, monitor systems, and meet security or compliance requirements. It turns raw log lines from applications, servers, containers, and network devices into searchable, structured signal.
Most log analytics tools follow the same core pipeline: collect, parse, index, search, visualize, alert, and investigate. Understanding that pipeline is the fastest way to compare tools, because every product on this list emphasizes a different stage.
Here are the core capabilities to know:
- Log collection: Ingesting logs from many sources (apps, infrastructure, cloud services, agents) into one place. This is the foundation of centralized logging.
- Log parsing and normalization: Turning unstructured text into structured fields so different log formats become comparable and queryable.
- Indexing and search: Building an index so you can run fast queries and filtering across huge volumes during an active incident.
- Dashboards and visualization: Rendering trends, spikes, and correlations so patterns are visible at a glance rather than buried in text.
- Real-time alerting: Notifying teams the moment a threshold, error rate, or pattern crosses a defined line.
- Anomaly detection: Surfacing unusual behavior automatically, often with machine learning, before it becomes an outage or breach.
- Retention and compliance: Storing logs for defined periods to support audit trails, compliance reporting, and forensic root cause analysis.
The strongest tools blend logs with observability (metrics and traces) and, increasingly, with security monitoring. That convergence is why the category and the SIEM space keep overlapping.
When to use log analysis software
Log analysis matters most in three recurring situations. Pattern-match your own reality against these before you shortlist.
Troubleshoot production incidents faster
When a service degrades, logs tell you which request, which service version, and which release caused it. Instead of guessing, your team filters to the failing transaction, reads the stack trace, and confirms the culprit. This is the direct lever on MTTR. It is also how PMs prove whether a specific deploy triggered a regression, which turns a vague "something broke" into a concrete, fixable root cause and better release confidence.
Detect security issues and compliance gaps
Logs are the evidence layer for security. Log analysis supports threat detection, audit trails, access reviews, and the retention windows that compliance reporting demands. Many teams run their logging platform alongside or inside a SIEM, so log data feeds detection rules and investigations. If your organization faces SOC 2, ISO 27001, GDPR, or similar obligations, the tool's retention, access controls, and SIEM integration move from nice-to-have to mandatory.
Reduce noise in high-volume, distributed systems
Cloud-native environments generate enormous, noisy log volume. Without filtering, correlation, and retention controls, teams drown, and alert fatigue sets in fast. The right tool improves signal quality by routing, enriching, and correlating logs before they hit storage or your on-call rotation. Better signal means fewer false pages and faster log monitoring across cloud and hybrid environments.
Comparison table
This table is built to help you narrow the field quickly. Scan the intent and key differentiation columns first to find the two or three tools worth a deeper look, then read their full sections below. Pricing and ratings reflect verified public sources at time of writing.
| # | Product | Intent | Key differentiation | Pricing | G2 rating |
|---|---|---|---|---|---|
| 1 | Splunk | Enterprise log analysis, security, and observability at scale | Mature SPL search, deep security and IT ops workflows | Multiple models (Workload, Ingest, Entity); contact sales | 4.3/5 |
| 2 | Datadog | Logs correlated with metrics and traces in one platform | Unified observability with live tail and fast triage | Logs from $0.10 per ingested GB; free tier available | 4.4/5 |
| 3 | Elastic Stack | Open, flexible log pipelines and search | Elasticsearch, Logstash, Kibana with full pipeline control | Free Basic tier; Platinum and Enterprise contact sales | 4.5/5 |
| 4 | Graylog | Centralized log management and SIEM | Straightforward log collection, search, and detections | Open is free; Enterprise from $15,000/yr | 4.4/5 |
| 5 | Cribl | Log data optimization and routing before storage | Pipeline to reduce, enrich, and route telemetry | Free up to 1TB/day; usage-based above | 4.3/5 |
| 6 | Logz.io | Cloud-native, managed log analytics | AI-assisted insights on open-source foundations | Log management from $0.92 per ingested GB/day | 4.5/5 |
| 7 | Sumo Logic | Cloud SIEM plus log analytics in one SaaS | Balanced platform with Flex usage-based pricing | Flex with $0 ingest; 30-day free trial | Not listed |
1. Splunk

Splunk is the platform most teams benchmark everything else against. It searches, monitors, and analyzes machine-generated data across security, observability, and IT operations, with its Search Processing Language (SPL) at the center. When teams need to correlate logs across dozens of sources during a live incident or a security investigation, Splunk's depth is the reason it keeps winning enterprise evaluations.
Best for: Enterprise teams that need mature search, security, and observability workflows on logs at scale.
Key strengths
- SPL search and correlation: Query and pivot across machine data with a language built for deep root cause analysis.
- Real-time dashboards and alerts: Monitor trends and fire real-time alerting the moment thresholds or patterns break.
- Enterprise integrations and SSO: Cloud Platform integrations and SAML single sign-on that fit governed environments.
Why choose Splunk: Splunk fits when your requirements lean heavy on security monitoring, forensic investigation, and cross-source correlation, and when you have the volume to justify a mature platform. It can feel heavyweight for a small team running a handful of services, but for large, distributed estates with strict compliance reporting needs, its search maturity and ecosystem are hard to match.
Splunk pricing: Splunk publishes several pricing models, Workload, Ingest, Entity, and Activity-based, on its pricing page, but does not list public numeric starting prices. You get an estimate or a quote by contacting Splunk directly. Budget for enterprise-tier spend, especially at high ingest volumes, and price the model that matches your usage pattern.
2. Datadog
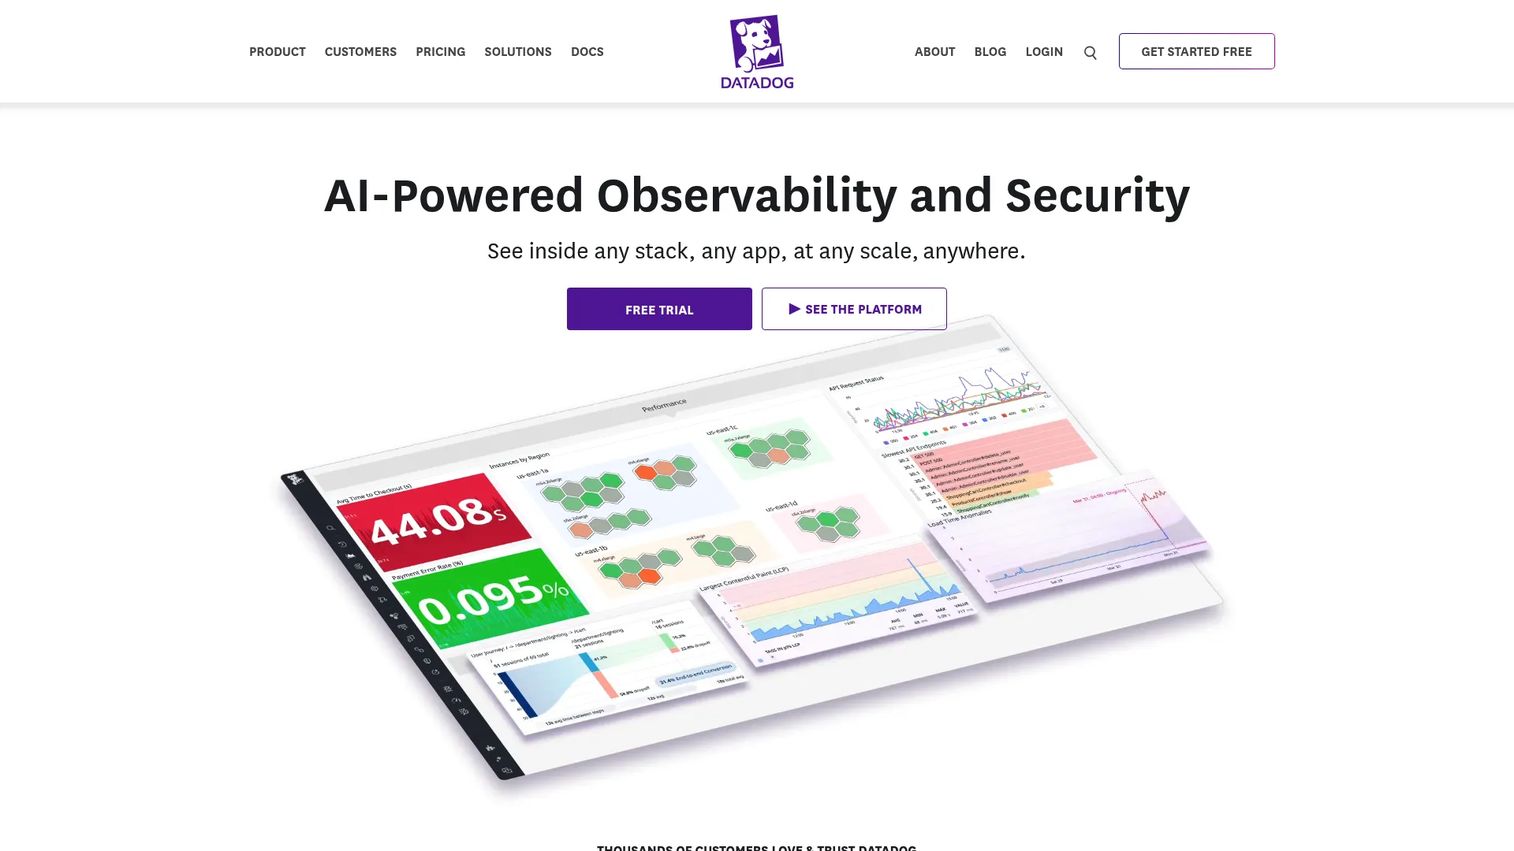
Datadog is the tool to reach for when you want logs sitting right next to metrics and traces in a single observability platform. Its differentiator is correlation: from a spiking latency graph, you jump straight to the related logs and the trace that explains the slowdown. That tight loop is why triage moves fast for teams already living in Datadog.
Best for: Teams that want one control plane for observability and security across cloud infrastructure and applications.
Key strengths
- Unified observability: Infrastructure monitoring, APM, and logs in one place so context never gets lost between tools.
- Live tail and fast triage: Stream logs in real time and pivot to correlated metrics and traces during an incident.
- Logs and security monitoring: Detection and analytics layered on the same log data you already ingest.
Why choose Datadog: Datadog excels when correlation speed matters more than anything, and when your team already uses it for metrics and traces. The single-pane workflow cuts the tool-switching that slows down root cause analysis. Its usage-based model rewards teams that tune what they ingest and retain, so plan your log volume deliberately.
Datadog pricing: Datadog uses usage-based, product-specific pricing with a free trial. Log ingestion starts at $0.10 per ingested GB per month (billed annually). Infrastructure monitoring starts at $15 per host per month on the Pro tier, $23 on Enterprise, and APM at $31 per APM host per month. A free tier is available. Because logging is priced on ingestion, model your volume and retention before committing.
3. Elastic Stack
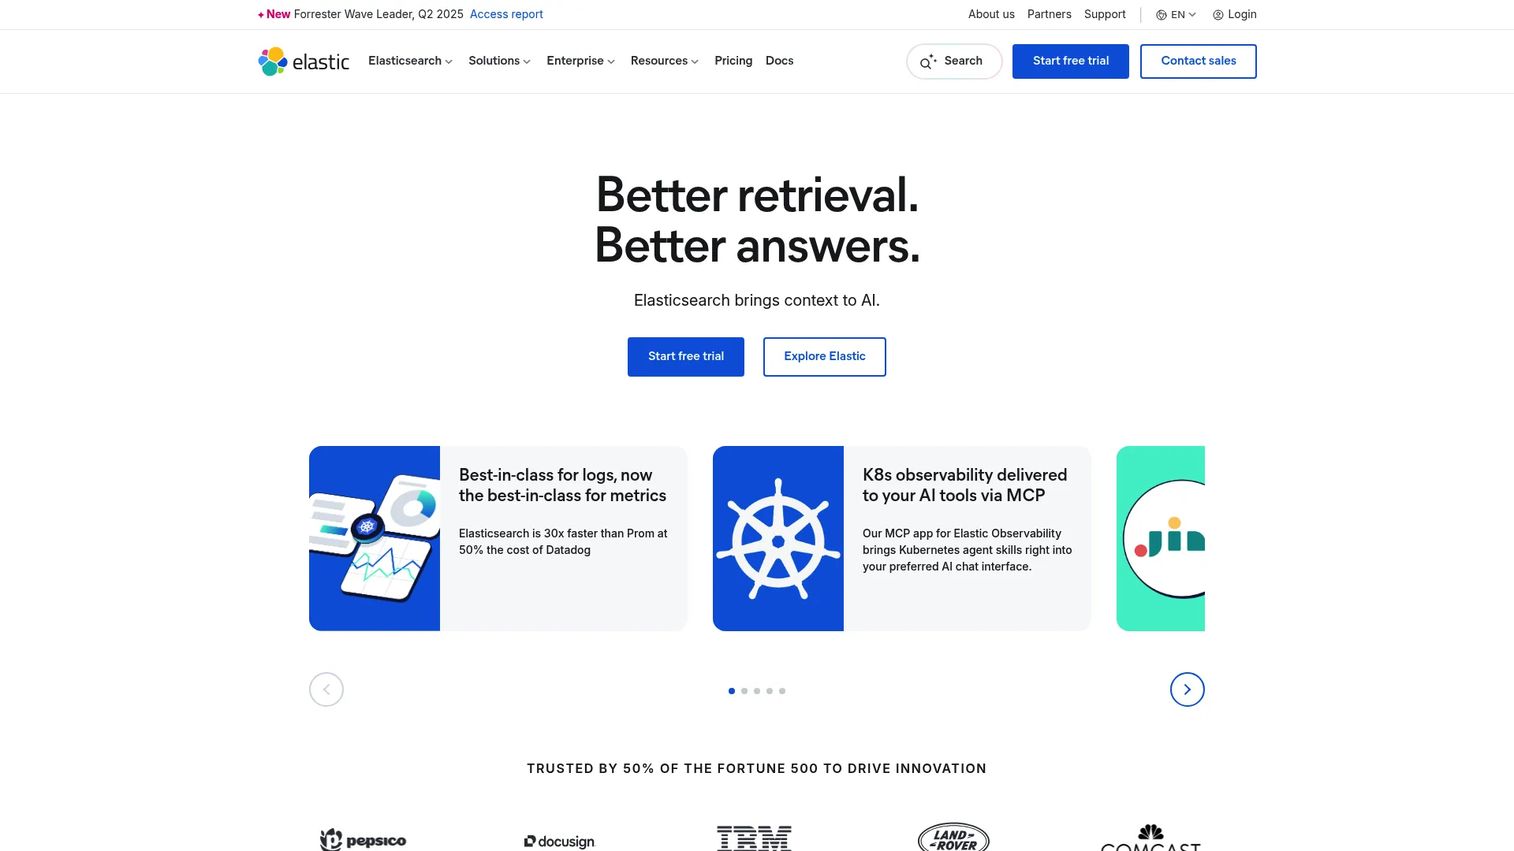
Elastic Stack is the choice for teams that want control over every stage of the log pipeline. Built around Elasticsearch, Logstash, and Kibana, it lets you shape collection, indexing, and analysis to your exact needs. If you want to own how logs are parsed, stored, and queried rather than accept a vendor's defaults, this is the flexible, open foundation for it.
Best for: Teams that need scalable search, observability, and security on one customizable platform.
Key strengths
- Search and analytics at scale: Elasticsearch handles huge log volumes with fast search and filtering.
- Log, metrics, and trace observability: One platform spanning logs and the rest of your observability data.
- Security, alerting, and dashboarding: Detections, alerts, and Kibana dashboards on the same indexed data.
Why choose Elastic Stack: Elastic Stack fits teams that value flexibility and want to tune the pipeline, whether self-managed or on Elastic Cloud. The open Basic tier lets you start without a contract, and you grow into paid features as needs mature. It rewards teams with the appetite to configure their own collection and indexing strategy for cloud and hybrid environments.
Elastic Stack pricing: Elastic offers a free Basic tier for self-managed deployments, with paid Platinum and Enterprise tiers that add advanced features. Paid pricing is not listed publicly, so Platinum and Enterprise require contacting sales. The free tier makes Elastic Stack an accessible starting point for teams testing the waters before committing budget.
4. Graylog
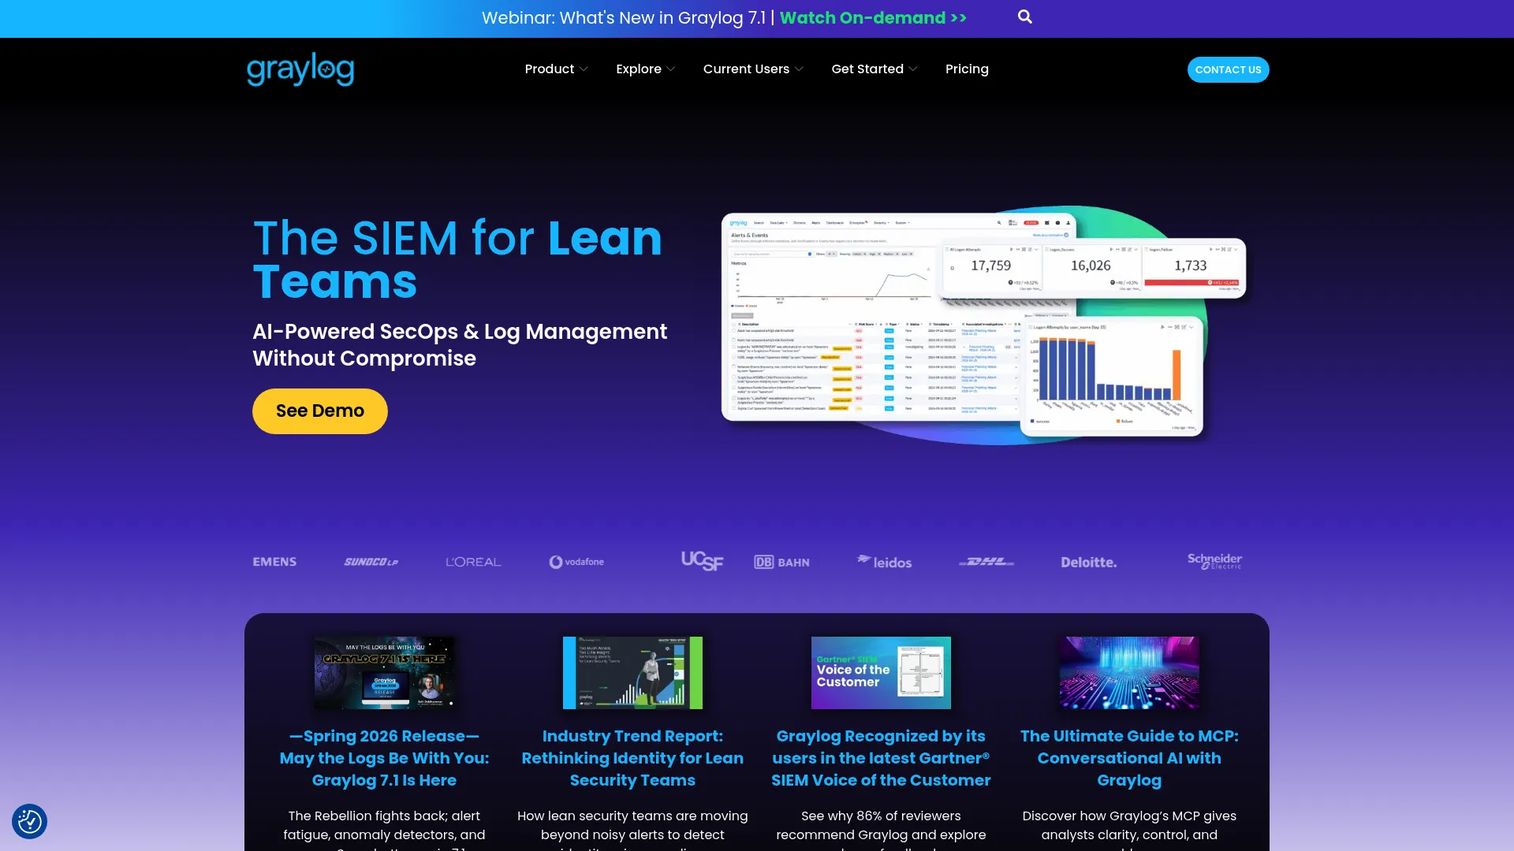
Graylog focuses on straightforward centralized log management, with SIEM and API security layered on top. It collects and searches logs across many source types, then adds pipelines, streams, dashboards, and alerting without demanding a heavy learning curve. For teams that want centralized visibility and clean operational workflows over maximum configurability, Graylog hits a practical middle ground.
Best for: Teams that need centralized log management and SIEM with self-managed, hybrid, or cloud deployment options.
Key strengths
- Broad log collection and search: Ingest and query logs across many source types from one place.
- Pipelines, streams, and alerting: Route, transform, and alert on logs with dashboards for at-a-glance monitoring.
- Security and compliance: Detections, investigations, and compliance reporting built in for security teams.
Why choose Graylog: Graylog excels when you want operational simplicity and centralized logging without assembling a pipeline from scratch. Its detections and compliance reporting make it a fit for teams that need security monitoring alongside day-to-day log analysis. Flexible deployment (self-managed, hybrid, or cloud) suits teams with specific data residency needs.
Graylog pricing: Graylog Open is free and source-available. Graylog Enterprise starts at $15,000 per year, and Graylog Security starts at $18,000 per year, both billed annually. The free Open tier lets smaller teams start centralizing logs immediately, while the paid tiers add enterprise support, security detections, and compliance features.
5. Cribl
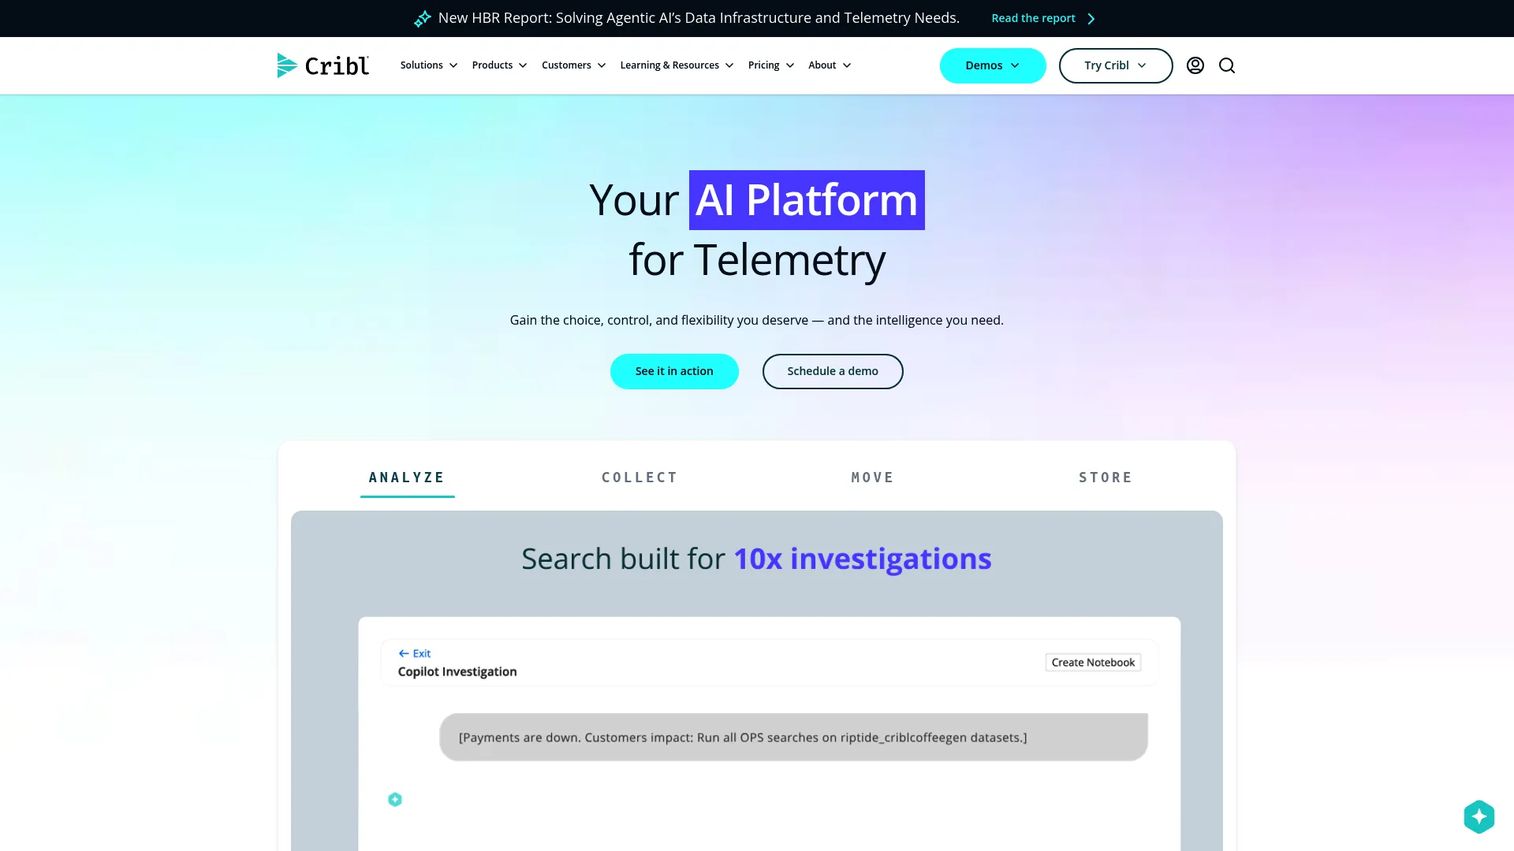
Cribl solves a different part of the problem: what happens to log data before it reaches storage or your SIEM. It collects, reduces, enriches, and routes telemetry so you send the right data to the right destination at the right cost. For teams fighting noisy logs and exploding storage bills, Cribl is the pipeline layer that improves downstream value while cutting spend.
Best for: Security and observability teams managing high-volume telemetry pipelines.
Key strengths
- Collect, reduce, enrich, route: Shape telemetry in flight to trim noise before it ever hits storage.
- Cribl Stream: An observability pipeline that decouples sources from destinations for full data control.
- Cribl Edge: Endpoint telemetry collection and processing at the source.
Why choose Cribl: Cribl often complements the other tools on this list rather than replacing them. It sits upstream of your log analysis platform, filtering and routing so you index only what matters. Teams drowning in high-volume, noisy logs use it to reduce ingestion cost and improve signal quality across their observability and security stack.
Cribl pricing: Cribl publicly lists Free, Standard, and Enterprise editions. The Free edition covers up to 1TB per day. Standard covers up to 5TB per day and Enterprise is unlimited, both billed on usage (credits utilized at ingest). Exact dollar figures are not shown publicly, so Standard and Enterprise pricing come from contacting sales.
6. Logz.io
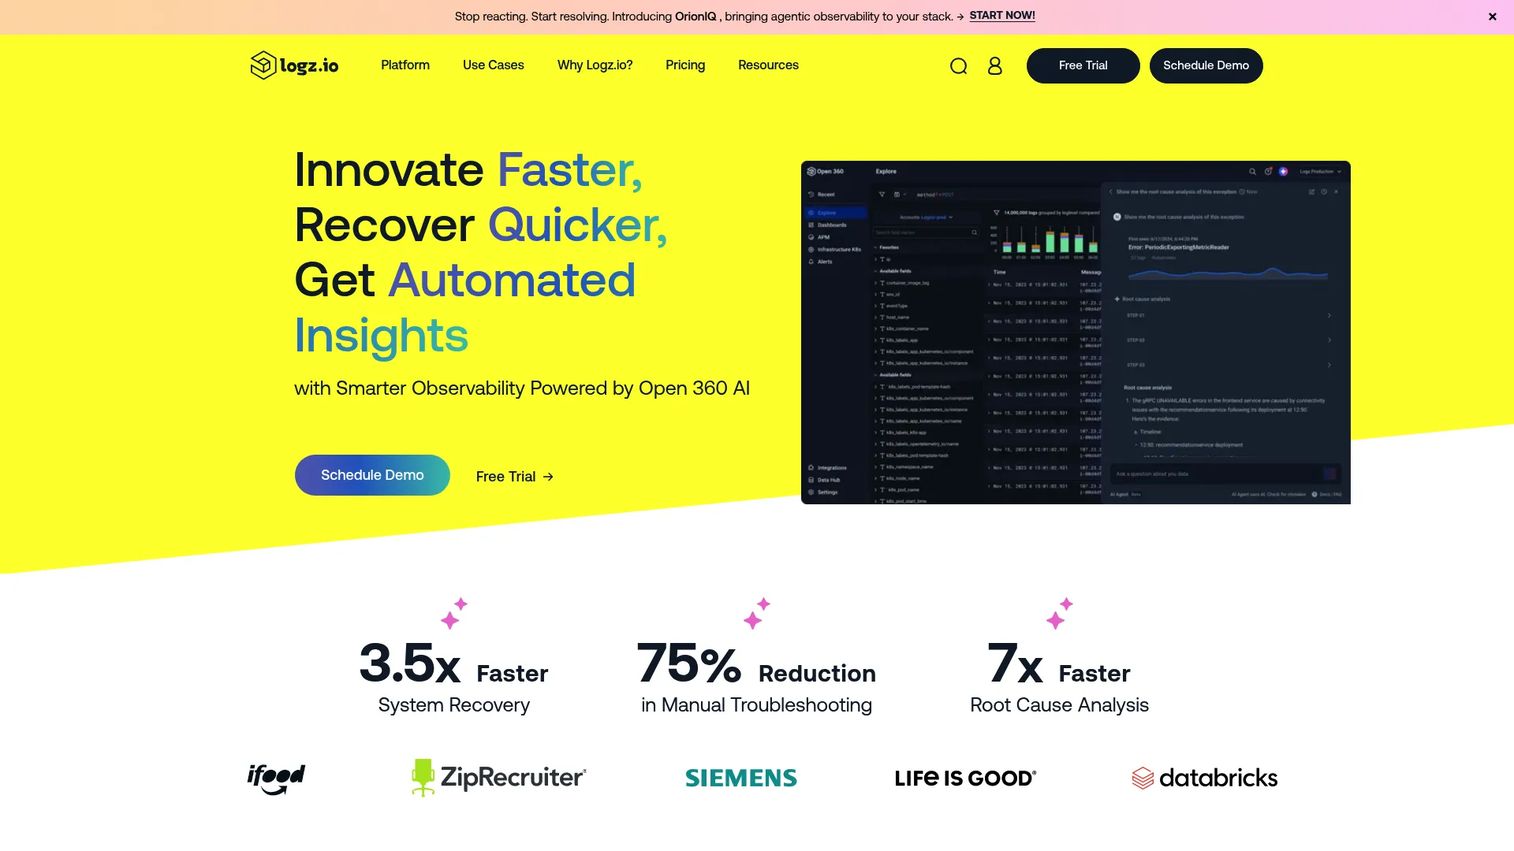
Logz.io is a cloud-native observability and security platform with AI-assisted log management built on open-source foundations. It handles log analytics, search, visualization, and alerting as a managed service, so you skip the work of running the infrastructure yourself. For teams that want fast setup and open-source familiarity without operating a cluster, Logz.io is a strong fit.
Best for: Teams that want a managed observability platform with open-source foundations and usage-based pricing.
Key strengths
- AI-assisted insights: An AI Agent surfaces patterns and speeds up root cause analysis on your logs.
- Managed log management: Search, visualization, and alerting without operating the underlying stack.
- Infrastructure monitoring and tracing: Logs alongside metrics and distributed traces for full observability.
Why choose Logz.io: Logz.io excels for teams that like the open-source model but do not want to manage clusters, indexing, or scaling. The managed infrastructure and cloud-native design mean faster time to value in cloud and hybrid environments. Usage-based pricing keeps entry costs low and scales with actual volume.
Logz.io pricing: Logz.io uses consumption-based pricing with a 14-day free trial. Log management is $0.92 per ingested GB per day. Infrastructure monitoring is $0.40 per 1,000 time series metrics per day, and distributed tracing is $0.16 per 1 million spans per day. Enterprise plans are quote-based. The per-GB model makes it easy to start small and grow.
7. Sumo Logic
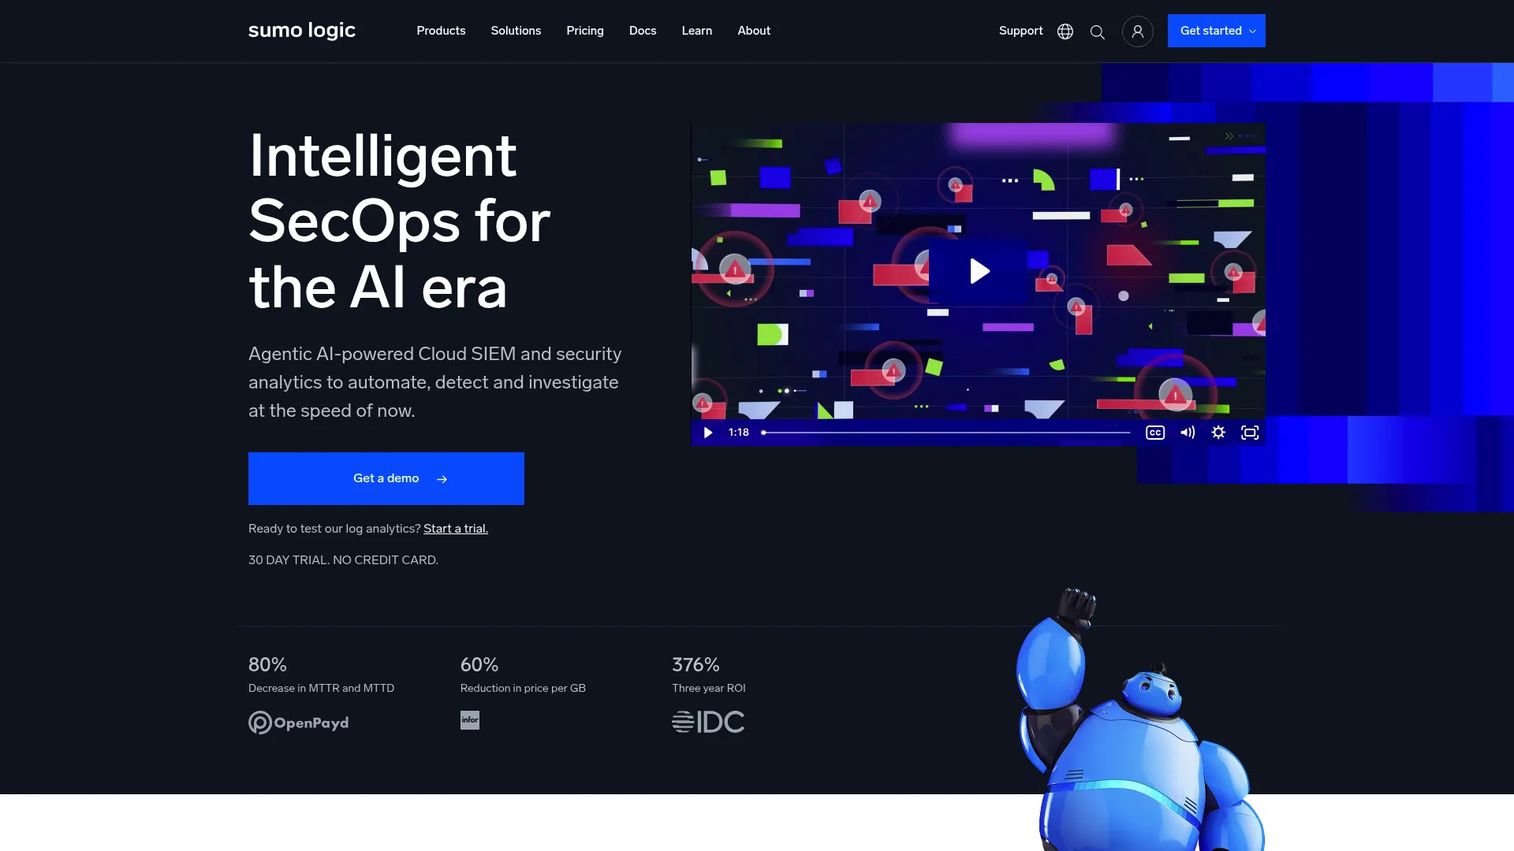
Sumo Logic is a cloud-native platform combining SIEM, log management, and observability in one SaaS product. It covers log analytics, machine data analysis, dashboards, and alerting with broad operational reach. For teams that want centralized visibility and security analytics without building a log pipeline from scratch, Sumo Logic offers a balanced, ready-to-deploy option.
Best for: Teams needing cloud SIEM plus log analytics in one SaaS platform.
Key strengths
- Cloud SIEM and security analytics: Security detections and analytics on the same platform as your logs.
- Log management and search: Fast search and filtering across machine data for root cause analysis.
- Observability for apps and Kubernetes: Monitoring across applications, infrastructure, and containers.
Why choose Sumo Logic: Sumo Logic fits teams that want one SaaS platform spanning log analytics and security without managing infrastructure. Its balanced coverage suits organizations that need centralized visibility and compliance support across cloud and hybrid environments. The Flex model, starting at $0 ingest, gives a low-friction entry point.
Sumo Logic pricing: Sumo Logic offers a 30-day free trial and Flex pricing with $0 ingest, plus Essentials and Enterprise Flex tiers on annual contracts. Public figures visible are the $0 ingest Flex model and the free trial; Essentials and Enterprise Flex pricing are quote-based. The usage-based Flex approach lets teams start without heavy upfront commitment.
Considerations before you buy
Every tool above is capable. The right pick comes down to how these criteria map to your reality. Governance-heavy buyers may also want to review best contract lifecycle management software and best loyalty management software as adjacent stack decisions, but for logging specifically, weigh the five factors below.
Log volume and retention
Estimate current ingestion and where it will be in a year. Distributed systems generate log volume faster than teams expect, and usage-based pricing can climb quickly. Confirm the platform handles your peak volume and your required data retention windows without runaway cost.
Search speed and query flexibility
During an incident, the metric that matters is how fast you go from symptom to root cause. Test search speed on realistic volumes and check whether the query language supports the correlation and filtering your team actually does. Slow search directly raises MTTR.
Security and compliance needs
If you carry compliance obligations, verify audit trails, access controls, retention policies, and SIEM integration up front. Many teams run their log platform as part of their security monitoring, so check that detections and reporting meet your framework requirements rather than assuming they do.
Integration with observability and incident response
Logs are most useful connected to metrics, traces, paging, and ticketing. Check how cleanly the tool feeds your incident response workflow, and whether it correlates across signals or leaves you switching tabs mid-incident.
Cost controls
Understand exactly what drives your bill: ingestion, indexing, storage, or archived data. Tools like a routing and filtering layer can cut noisy logs before they hit storage, easing both cost and alert fatigue. Model the pricing against your real usage, not a vendor's example.
Conclusion
The best log analysis software is the one that matches your volume, retention, and incident workflow, not the one with the longest feature list. If you need mature enterprise search and deep security investigation, Splunk sets the bar. If you want logs correlated with metrics and traces in one place, Datadog wins on triage speed. For teams that want to own the pipeline, Elastic Stack offers open flexibility, while Graylog delivers simpler centralized log management with SIEM built in.
If your challenge is noisy logs and storage cost, Cribl optimizes and routes data before it lands. For a managed, cloud-native experience, Logz.io removes the operational overhead, and Sumo Logic balances cloud SIEM with log analytics in a single SaaS platform.
Start with the tool that fits your current volume, retention needs, and how your team actually runs incidents. Run a trial on realistic data, measure search speed and MTTR impact, and confirm the pricing model holds up at your projected scale before you commit.
FAQs
Log analysis software is used to collect, parse, search, visualize, and alert on log data so teams can troubleshoot production issues, monitor system health, and support security and compliance. It turns raw log file analysis into structured signal, powering faster root cause analysis, threat detection, audit trails, and observability across distributed systems.
The core features are log collection across many sources, parsing and normalization, fast search and filtering, dashboards and visualization, real-time alerting, and anomaly detection. Data retention for compliance reporting and integrations with your observability and incident response stack round out what separates a capable tool from a basic one.
They overlap but are not identical. Log analysis software focuses broadly on collecting and analyzing logs for troubleshooting, monitoring, and observability. A SIEM specializes in security use cases: correlation rules, threat detection, and compliance reporting. Many platforms here, including Graylog, Sumo Logic, and Logz.io, offer SIEM capabilities on top of log analytics, which is why the categories keep converging.
Log analysis reduces mean time to resolution by letting teams jump from an alert straight to the specific logs that explain a failure. Centralized search, correlation with metrics and traces, and real-time alerting cut the time spent hunting across scattered sources. Faster root cause analysis means faster fixes and shorter outages.
For cloud and hybrid environments, prioritize scale, usage-based cost controls, flexible retention, and native integration with cloud services and container platforms. Managed options like Logz.io and Sumo Logic reduce operational overhead, while filtering and routing tools help control the log volume that cloud-native systems generate.
There is no single best; it depends on governance, scale, and your existing stack. Splunk leads for mature security and search at scale. Datadog wins when observability correlation is the priority. Elastic Stack fits teams that want pipeline control, and Sumo Logic or Graylog suit those wanting cloud SIEM and centralized logging with less infrastructure to run.
Tools handle noisy logs through filtering, enrichment, routing, and correlation. A dedicated pipeline layer like Cribl reduces and enriches telemetry before it reaches storage, so you index only what matters. Combined with anomaly detection and well-tuned alerting, this improves signal quality and reduces alert fatigue for on-call teams.