You already have alerts. The problem is that half of them do not deserve a human, and the few that do arrive without enough context.
According to Splunk's State of Observability 2025, 43% of IT and engineering professionals say they spend too much time responding to alerts, and 52% cite false alerts as an active challenge. A separate Cisco finding from the same year puts deliberate alert suppression in the picture: Teams stop paying attention, and then the one alert that mattered gets ignored.
The real gap is not notification volume. It is routing quality, escalation logic, and the ability to put the right information in front of the right person before the situation gets worse. Choosing IT alerting software is actually three decisions at once: Which tool detects the problem, which tool routes the right human, and which tool helps the team resolve, document, and improve.
This guide covers all three, across 20 tools spanning incident response, observability, ITSM, MSP operations, and uptime monitoring.
What's inside
This guide is for IT operations leaders, DevOps engineers, SREs, MSP operators, and presales teams evaluating alerting tools for technical validation. Tools were selected based on four criteria:
- Alert routing and escalation: On-call scheduling, escalation policies, and fallback logic
- Noise reduction: Deduplication, suppression, correlation, and threshold controls
- Integrations: Monitoring, ITSM, chat, cloud, and ticketing systems
- Pricing and reporting: Verified current pricing, G2 ratings, and MTTA/MTTR visibility
TL;DR
- Best overall for incident response: PagerDuty leads for mature on-call workflows, escalation policies, and MTTA/MTTR reporting
- Best for Atlassian-heavy teams: Opsgenie (note: Sales ended June 2025) or Jira Service Management for active purchase
- Best for enterprise ITSM: ServiceNow ties alerting to ITIL processes, CMDB, and enterprise governance
- Best for observability-led alerting: Datadog and New Relic for teams whose alert quality depends on telemetry depth
- Best for MSPs: ConnectWise RMM, Atera, and SuperOps each connect RMM alerts to ticketing and client workflows
- Best for uptime monitoring: Better Stack and UptimeRobot for availability-focused teams that also need status pages
What is IT alerting software?
IT alerting software detects, routes, escalates, and tracks alerts from infrastructure, applications, networks, cloud services, security tools, and business systems so the right team can respond before an issue becomes a larger incident.
The category sits between monitoring (which identifies that something is wrong) and incident management (which coordinates the response). Some tools focus primarily on one side. Others cover the full lifecycle from detection to postmortem.
Alert quality matters more than alert volume. A well-configured alerting tool sends fewer interruptions because it deduplicates, suppresses noise, applies severity rules, and maps alerts to service owners before anyone gets paged.
The business case is straightforward: Faster mean time to acknowledge (MTTA), lower mean time to resolve (MTTR), fewer missed escalations, and less on-call burnout.
Key features to look for
- Real-time alert ingestion from monitoring, cloud, and security sources
- Alert deduplication and grouping
- Severity classification and threshold rules
- Escalation policies with time-based fallback
- On-call scheduling with overrides and holiday coverage
- Multi-channel notifications: Email, SMS, voice, push, chat
- Ticket creation and ITSM workflow integration
- Runbook automation and guided response
- Incident timelines and postmortem exports
- MTTA and MTTR reporting
- Service ownership mapping
- Heartbeat monitoring
- ChatOps integrations with Slack, Teams, and similar tools
Common alert sources
- Infrastructure monitoring (servers, VMs, cloud instances)
- Application performance monitoring (APM)
- Network monitoring (switches, routers, devices)
- Cloud services (AWS, Azure, GCP events)
- Security tools (SIEM, EDR, vulnerability scanners)
- Uptime checks (website, API, certificate)
- Log management systems
- ITSM and help desk tickets
- RMM platforms
- Business-critical workflow failures
When to use IT alerting software
Reduce alert fatigue before it burns out your team
Alert fatigue sets in when responders face too many low-priority pages. Deduplication collapses duplicate events into one incident. Suppression silences known maintenance windows. Severity rules ensure only actionable issues page a human. If your team regularly ignores alerts or delays acknowledgement, the routing logic needs fixing before the notification volume does. Application performance monitoring tools and API monitoring tools feed directly into this problem, so the alerting layer needs to handle their output intelligently.
Route incidents to the right on-call owner
Good on-call scheduling goes beyond a rotation. It covers escalation chains, fallback responders, business-hour logic, after-hours coverage, and override handling. A strong tool shows who received the page, when they acknowledged, and where escalation stopped. That audit trail is essential for post-incident review and for validating that the routing logic actually worked.
Turn monitoring alerts into incident response
The best alerting workflows connect detection to action. That means automatic ticket creation, runbook links inside the alert, ChatOps threads for coordination, and postmortem data collection built into the incident lifecycle. Teams that treat alerting as notification delivery miss the compounding gains from structured incident response.
IT alerting software comparison
The 20 tools below are sorted by relevance to IT alerting, incident response, on-call management, and alert management use cases. Pricing and G2 ratings were verified against vendor pricing pages and live G2 listings.
| # | Product | Best for | Key differentiator | Pricing | G2 rating |
|---|---|---|---|---|---|
| 1 | PagerDuty | Incident response and on-call teams | Mature escalation and incident response workflows | Free; paid from $21/user/mo | 4.5/5 |
| 2 | Opsgenie | Atlassian-centric on-call teams | Deep alert routing for Atlassian workflows | Free; paid from $9.45/user/mo | 4.2/5 |
| 3 | ServiceNow | Enterprise ITSM teams | Alerting tied to IT service workflows | Custom pricing | 4.4/5 |
| 4 | Datadog | Observability-led engineering teams | Alerting built into infrastructure and APM data | Free; APM from $31/host/mo | 4.4/5 |
| 5 | Freshservice | IT service desk teams | ITSM and alerting in one help desk workflow | From $19/agent/mo | N/A |
| 6 | AlertOps | Incident response teams | Escalation, routing, and workflow automation | Free; paid from $8/user/mo | 4.7/5 |
| 7 | xMatters | Large incident response programs | Event management and automated response orchestration | Free; paid from $15/user/mo | 4.5/5 |
| 8 | OnPage | Critical alert delivery | Persistent mobile, SMS, voice, and escalation alerts | From $13.99/user/mo | 4.3/5 |
| 9 | BigPanda | AIOps and event correlation | Alert correlation and noise reduction at scale | Custom pricing | 4.5/5 |
| 10 | Better Stack | Uptime and incident communication | Monitoring, alerting, status pages, and logs | Free; paid from $29/license/mo | 4.8/5 |
| 11 | UptimeRobot | Simple uptime alerts | Website and service uptime notifications | Free; paid from €9/mo | 4.7/5 |
| 12 | New Relic | Full-stack observability | Alerting across telemetry and application performance | Free; paid from $10/user/mo | 4.4/5 |
| 13 | Dynatrace | Enterprise observability | AI-assisted detection and root-cause context | Free trial; from $0.01/host/hr | 4.5/5 |
| 14 | Checkmk | Infrastructure monitoring | Agent-based and agentless infrastructure alerts | Free community edition | 4.7/5 |
| 15 | Atera | MSP and IT department monitoring | RMM alerting with ticketing workflows | Custom pricing | 4.6/5 |
| 16 | SuperOps | MSP operations | PSA and RMM alert management for MSPs | From $1.50/endpoint/mo | 4.4/5 |
| 17 | ManageEngine OpManager | Network operations | Network device monitoring and threshold alerts | From $95 (10 devices) | 4.5/5 |
| 18 | Jira Service Management | ITSM incident workflows | Alerting tied to service management and tickets | Free; paid from $21.50/agent/mo | 4.3/5 |
| 19 | ConnectWise RMM | MSP monitoring | RMM alerts, remediation, and managed operations | Custom pricing | 4.1/5 |
| 20 | Amazon Simple Notification Service | Cloud-native notification delivery | Event-driven notifications across AWS services | Free tier; from $0.50/1M requests | 4.3/5 |
Best 20 IT alerting software tools for 2026
1. PagerDuty
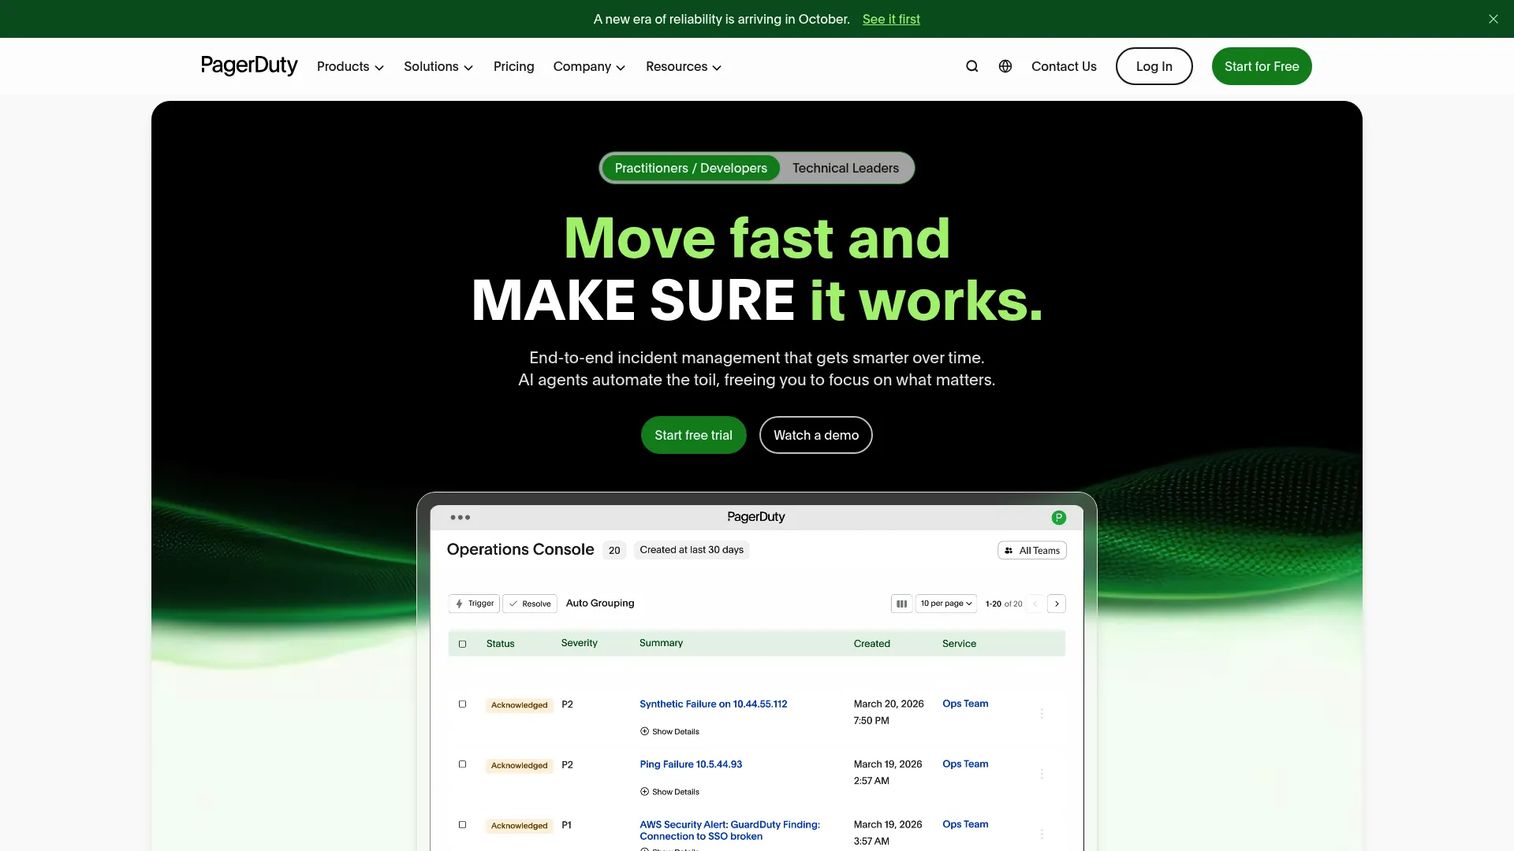
PagerDuty is the most established incident response and on-call management platform in this category. It ingests events from monitoring, cloud, and security tools, applies routing rules and escalation policies, and coordinates response across technical teams. Its Signal Intelligence layer reduces noise through alert correlation and event enrichment before a human ever gets paged.
Best for: SRE, DevOps, and IT operations teams running formal incident response with MTTA and MTTR tracking.
Key features
- On-call schedules with overrides and holiday coverage
- Escalation policies with time-based fallback logic
- AIOps and Signal Intelligence for alert correlation
- Incident workflows and runbook automation
- Service ownership mapping and MTTA/MTTR dashboards
Why choose PagerDuty: If your team needs a structured incident command process with full audit trails, escalation logging, and postmortem exports, PagerDuty is the default shortlist entry. It scales from small DevOps teams to enterprise SRE programs.
PagerDuty pricing: Free plan supports up to 5 users. Professional plans start at $21 per user per month billed annually ($25 monthly). Business plans are $41 per user per month annually. Annual platform plans start at $2,800 per year with included seats and AI actions.
G2 rating: 4.5/5
2. Opsgenie
Opsgenie is Atlassian's on-call management and alert routing platform. It handles escalation policies, on-call schedules, alert enrichment, and routing rules, with native connections to Jira and other Atlassian tools. One critical note: Atlassian ended new sales and signups for Opsgenie on June 4, 2025. Existing customers can continue using it until end of support on April 5, 2027. New buyers should evaluate Jira Service Management instead.
Best for: Atlassian-heavy IT and DevOps teams already invested in Jira workflows.
Key features
- Alert routing rules with priority and filtering
- On-call schedules with escalation and override support
- Alert enrichment and deduplication
- Jira incident and ticket integration
- Advanced analytics on alert and on-call activity
Why choose Opsgenie: If your team is already on Opsgenie and within the support window, the Jira integration and routing depth make it worth maintaining. New purchases should route to Jira Service Management, which now includes on-call and alerting features.
Opsgenie pricing: Legacy pricing shows a free plan, Essentials at $9.45 per user per month annually, Standard at $19.95 annually, and Enterprise at $31.90 annually. These plans are no longer available for new purchase.
G2 rating: 4.2/5
3. ServiceNow
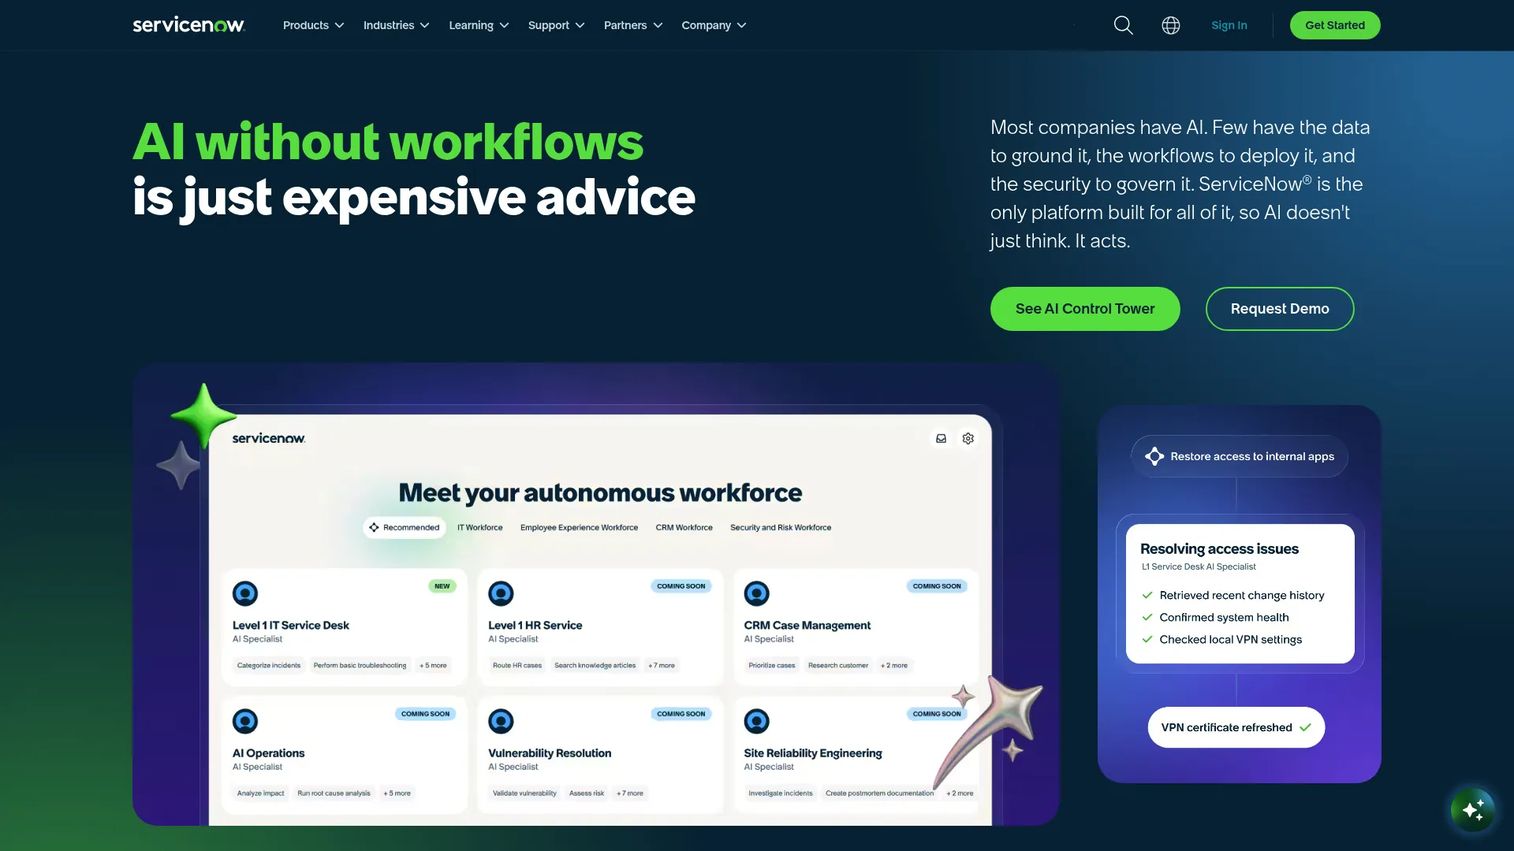
ServiceNow is an enterprise IT management platform that connects alerting to ITSM workflows, CMDB data, and service ownership models. Its event management module ingests alerts from monitoring tools and correlates them against service topology before creating incidents. For organizations running ITIL processes, ServiceNow keeps alerting inside the same governance model as change, problem, and service management.
Best for: Large enterprise IT organizations that need alert handling tied to formal ITIL processes, approvals, and service ownership.
Key features
- Event management with alert ingestion and correlation
- Incident, problem, and change management integration
- CMDB service topology context for alerts
- Workflow automation and approval routing
- Enterprise reporting and compliance dashboards
Why choose ServiceNow: Choose this when alerting must connect to procurement governance, change windows, and enterprise reporting. It is not a lightweight on-call tool; the value is in depth of integration with IT service workflows.
ServiceNow pricing: All pricing is custom quote. Cost drivers include modules selected, user count, workflow scope, and implementation requirements. Contact ServiceNow directly for a quote.
G2 rating: 4.4/5
4. Datadog
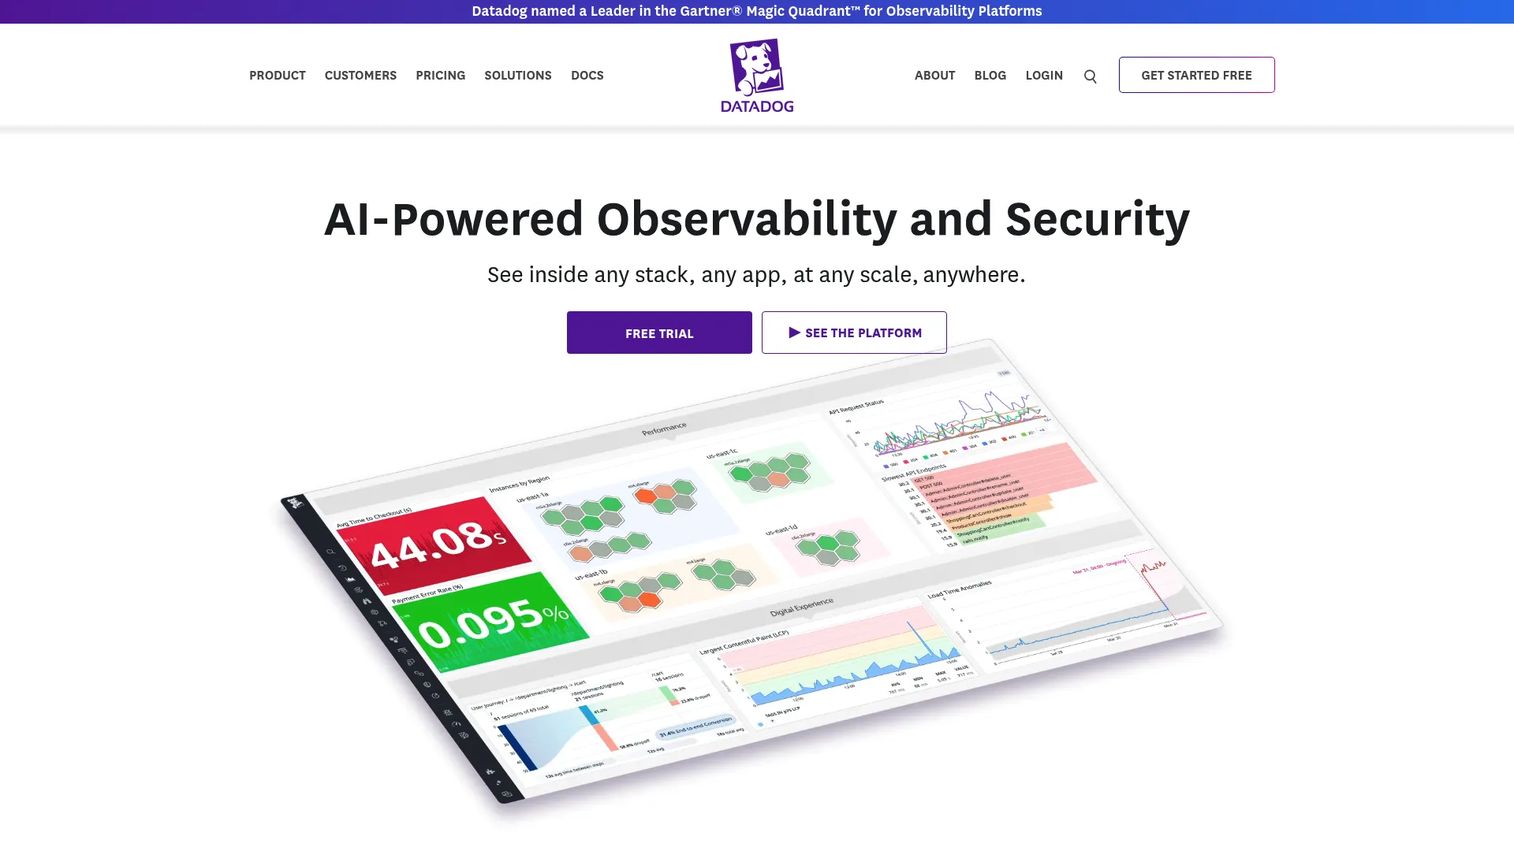
Datadog is an observability platform with alerting built across infrastructure, APM, logs, synthetics, and security telemetry. Teams that already use Datadog for monitoring can create alert policies directly against the metrics, traces, and logs they collect, without routing data to a separate alerting tool. The alert quality is only as good as the underlying telemetry, which makes Datadog a strong choice for engineering teams with mature observability practices.
Best for: DevOps and SRE teams whose alert quality depends on correlating infrastructure, application, and log signals.
Key features
- Infrastructure monitors with threshold and anomaly detection
- APM trace-based alerts and service health monitors
- Log-based alert conditions and queries
- Synthetic uptime and transaction monitors
- Built-in incident management with timelines
Why choose Datadog: If your team already pays for Datadog observability, alert creation on existing telemetry adds significant value without a separate tool. For teams without existing Datadog coverage, the cost model scales by module and host count.
Datadog pricing: Free tier available. APM monitoring starts at $31 per host per month billed annually ($36 on-demand). Infrastructure monitoring is priced separately by host. Total cost grows with the number of products and data volume.
G2 rating: 4.4/5
5. Freshservice
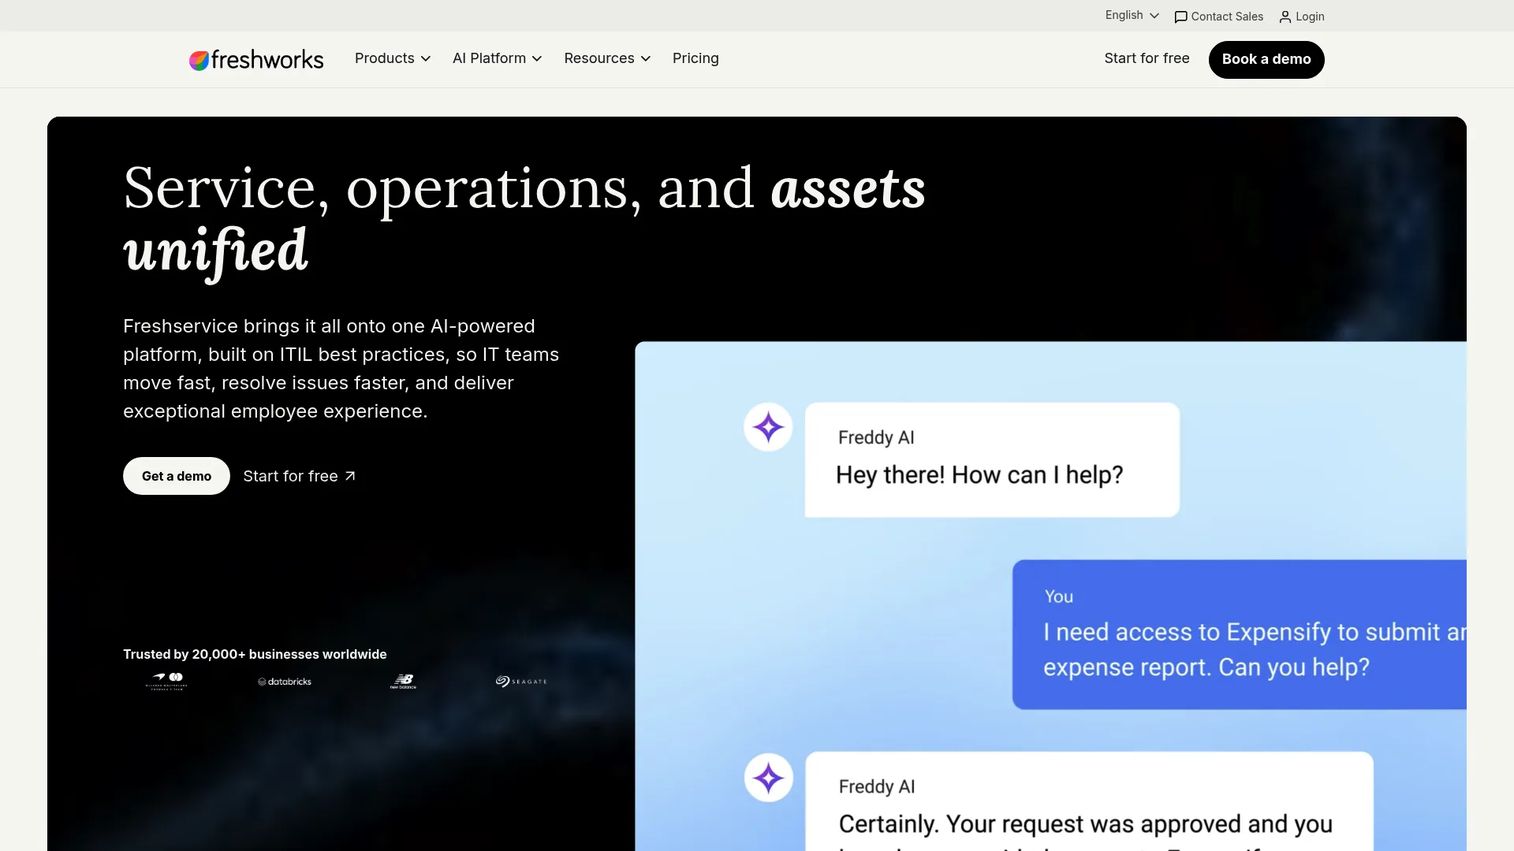
Freshservice is an IT service management platform from Freshworks. It handles alert management through its incident management module, converting incoming alerts into ticketed incidents with SLA tracking, asset context, and workflow automation. Teams that want alerting to produce managed tickets rather than on-call pages will find it a practical fit, particularly when the service desk is already running on Freshservice.
Best for: IT service desks that want alerts converted into managed incidents with SLA ownership and asset context.
Key features
- Alert management with incident ticket creation
- Workflow automation and intelligent routing
- Asset context and CMDB integration
- SLA tracking and escalation rules
- Freddy AI Copilot for assisted resolution
Why choose Freshservice: The right fit for teams where the primary goal is structured ticket management rather than real-time on-call response. It connects alerting to the IT help desk workflow rather than to an SRE on-call rotation.
Freshservice pricing: Starter plans begin at $19 per agent per month billed annually. Growth plans are $49 per agent per month annually. Pro plans reach $99 per agent per month annually, and Enterprise pricing is custom.
6. AlertOps
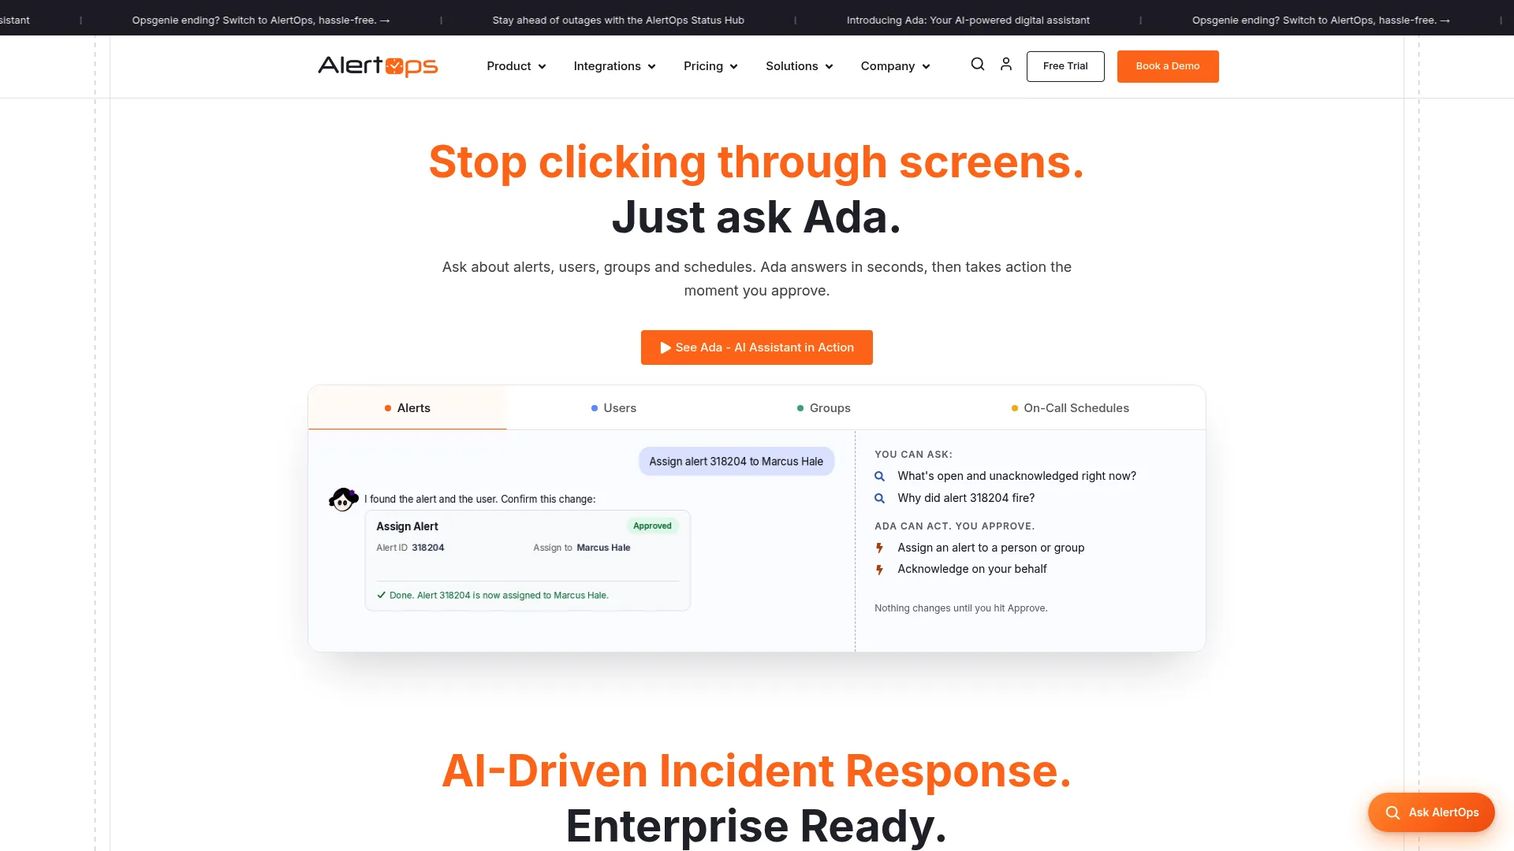
AlertOps is an AI-powered incident alerting and response automation platform focused on routing, escalation, and workflow orchestration. It supports over 200 integrations with monitoring, ticketing, and communication tools, making it practical as a coordination layer between your detection stack and your responders. On-call scheduling, live call routing, and alert suppression are all core capabilities.
Best for: IT operations and DevOps teams managing complex escalation rules across multiple response groups.
Key features
- On-call scheduling with team and rotation support
- Automated escalation policies with acknowledgement tracking
- Multi-channel alert delivery: SMS, voice, push, and email
- Alert suppression and deduplication
- Workflow automation with over 200 integrations
Why choose AlertOps: A practical choice when the primary pain is coordination across monitoring tools, ticketing systems, and responders. Particularly useful for teams with after-hours support requirements and severity-based routing.
AlertOps pricing: Free plan supports up to 5 users. Standard plans are $8 per user per month billed annually ($10 monthly). Premium is $18 per user per month annually, and Enterprise is $28 per user per month annually.
G2 rating: 4.7/5
7. xMatters
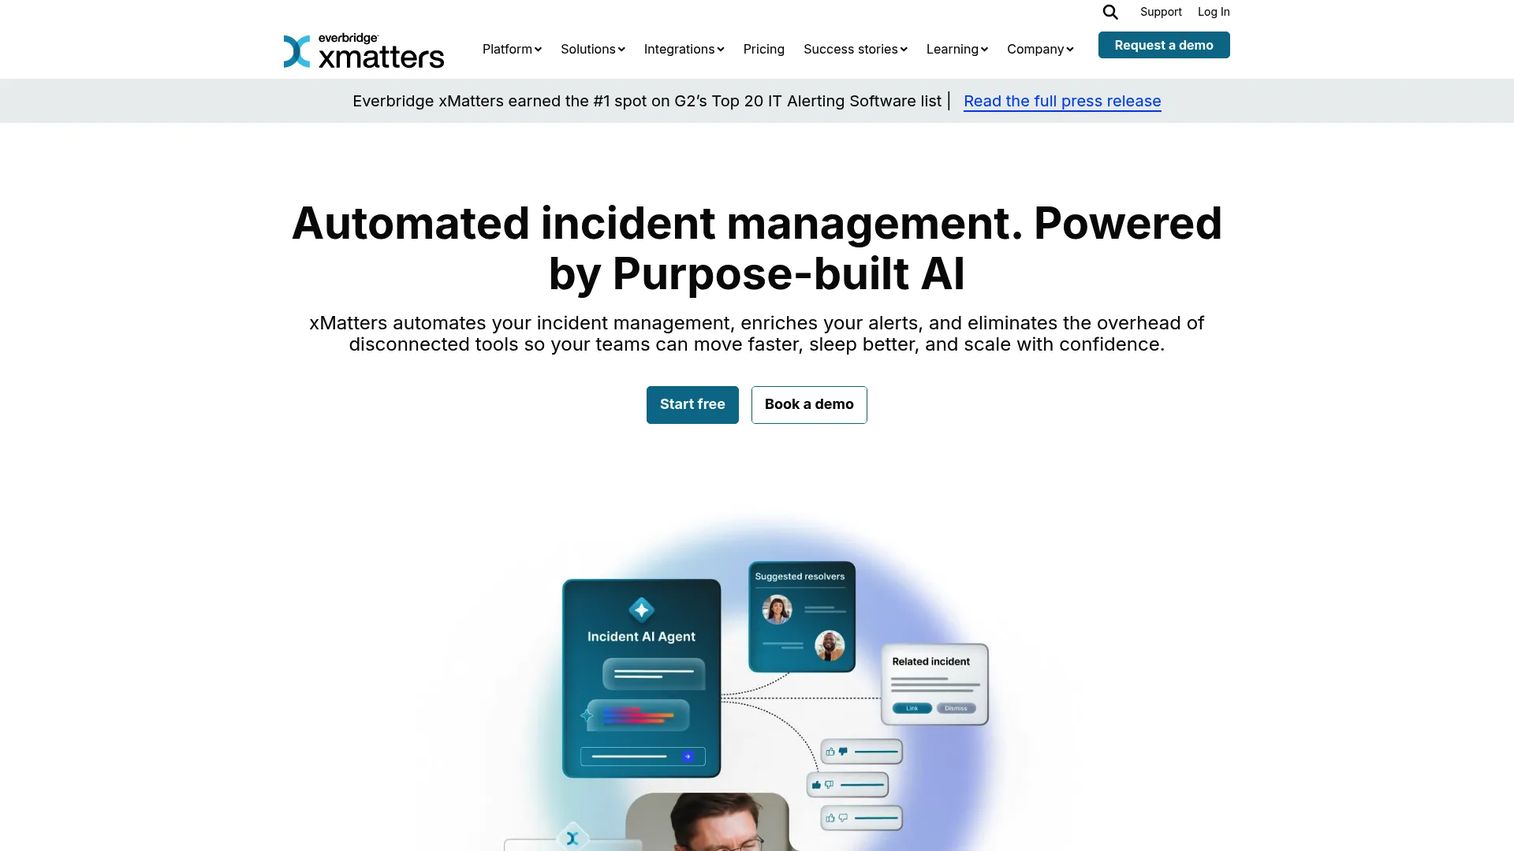
xMatters is a service reliability and incident management platform built for enterprise-scale event automation and response orchestration. Its Flow Designer allows code-free workflow construction across monitoring, ticketing, and communication tools. When incidents span multiple systems and require coordinated notifications across technical and business stakeholders, xMatters handles the orchestration layer.
Best for: Enterprise teams coordinating high-severity incidents across systems, tools, and stakeholder groups.
Key features
- Code-free workflow automation with Flow Designer
- Adaptive incident management and collaborative response
- Alert filtering, suppression, correlation, and intelligent routing
- Pre-built integrations with over 200 tools
- Incident analytics, timelines, and post-incident reporting
Why choose xMatters: Choose xMatters when incidents need coordinated notification across engineering, operations, and business leadership simultaneously. The strength is orchestration, not just alert delivery.
xMatters pricing: Free plan available (note: The pricing page shows conflicting limits of 5 and 10 users; confirm directly). Starter plans are $15 per user per month for up to 25 users. Base plans are $39 per user per month. Advanced pricing requires contacting sales.
G2 rating: 4.5/5
8. OnPage
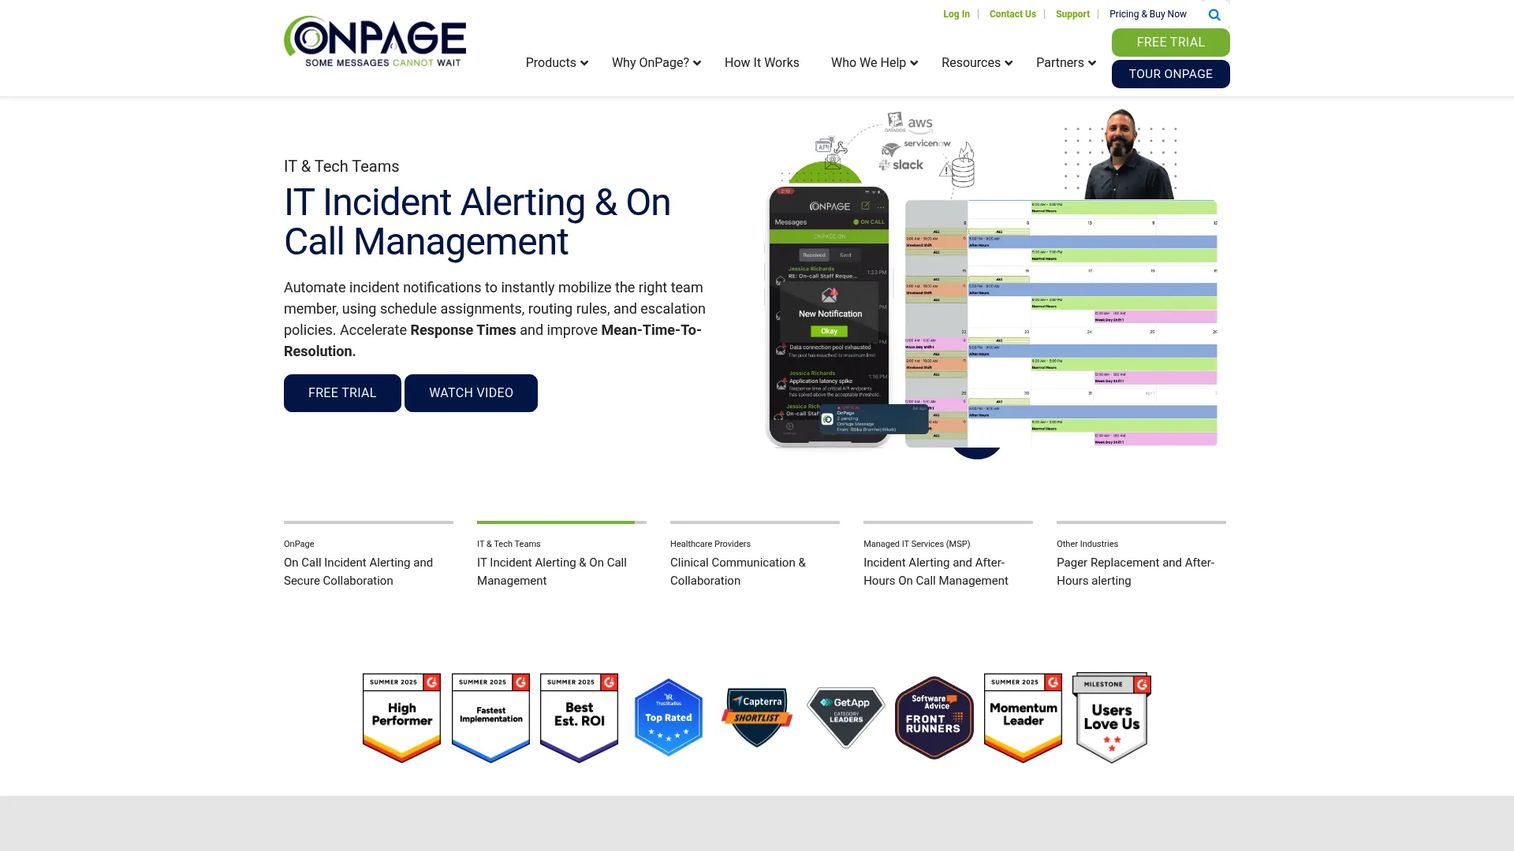
OnPage is a critical alerting platform built around one guarantee: Alerts persist until someone acknowledges them, for up to eight hours. SMS, voice calls, iOS, and Android push notifications all support persistent delivery and escalation chains. The platform also includes secure two-way messaging and audit trails, making it practical for healthcare, MSP, and IT operations environments where missed alerts carry real consequences.
Best for: Teams where acknowledgement failure is not acceptable and persistent escalation is a core requirement.
Key features
- Persistent mobile alerts lasting up to 8 hours
- SMS, voice call, and push notification delivery
- Escalation chains with fallback responder logic
- Secure two-way messaging with audit trails
- On-call scheduling and real-time incident reporting
Why choose OnPage: When the primary concern is ensuring critical alerts reach a human regardless of what happens to the first attempt, OnPage's persistence model handles the edge cases that standard notification tools drop.
OnPage pricing: Plans start at $13.99 per user per month billed annually. Quarterly billing is $16.99 per user per month. Enterprise Silver is $22.99 and Enterprise Gold is $28.99 per user per month, both billed annually.
G2 rating: 4.3/5
9. BigPanda
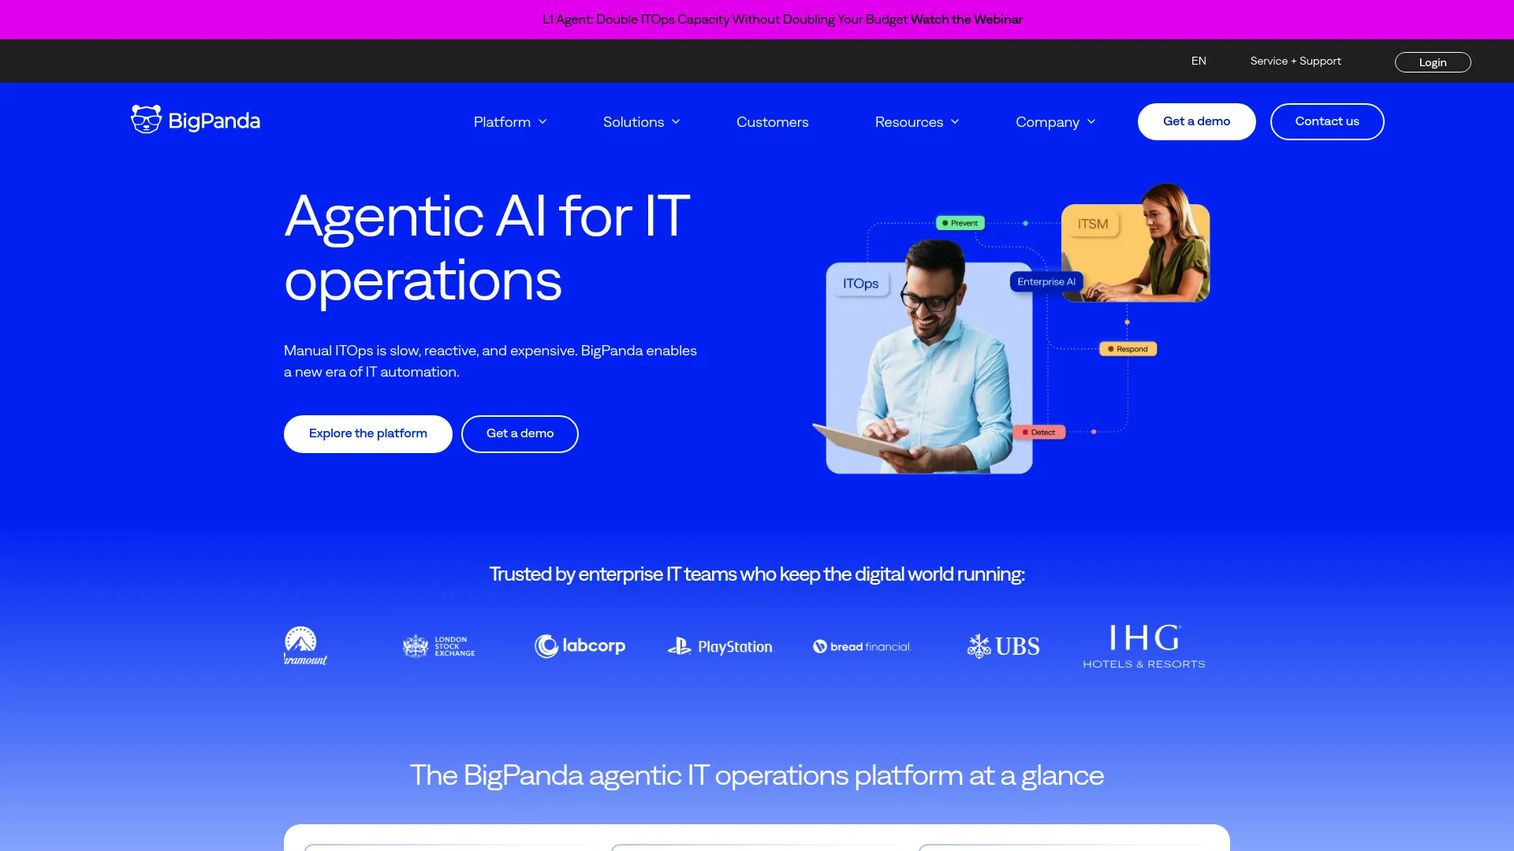
BigPanda is an AIOps platform focused on event correlation and alert noise reduction at enterprise scale. Rather than replacing monitoring tools, it sits above them, ingesting events from multiple sources and using AI to correlate related alerts into a single incident with topology, change, and business context already attached. For large IT operations centers dealing with thousands of daily events, BigPanda reduces the volume that reaches responders.
Best for: Large IT operations and NOC teams where high event volume is the primary challenge.
Key features
- AI-powered alert correlation across multiple monitoring sources
- Incident enrichment with topology and change context
- AI-generated probable root cause and remediation recommendations
- Alert deduplication and noise suppression
- Incident intelligence dashboards and reporting
Why choose BigPanda: Position it above your existing monitoring stack rather than as a replacement. The value is incident consolidation and AI-enriched context, which reduces mean time to acknowledge for complex, multi-source incidents.
BigPanda pricing: All pricing is custom quote. Plans use a tiered credit system starting at 20,000 credits with one-to-three year commitments. Event volume, integrations, and support tier drive the quote.
G2 rating: 4.5/5
10. Better Stack
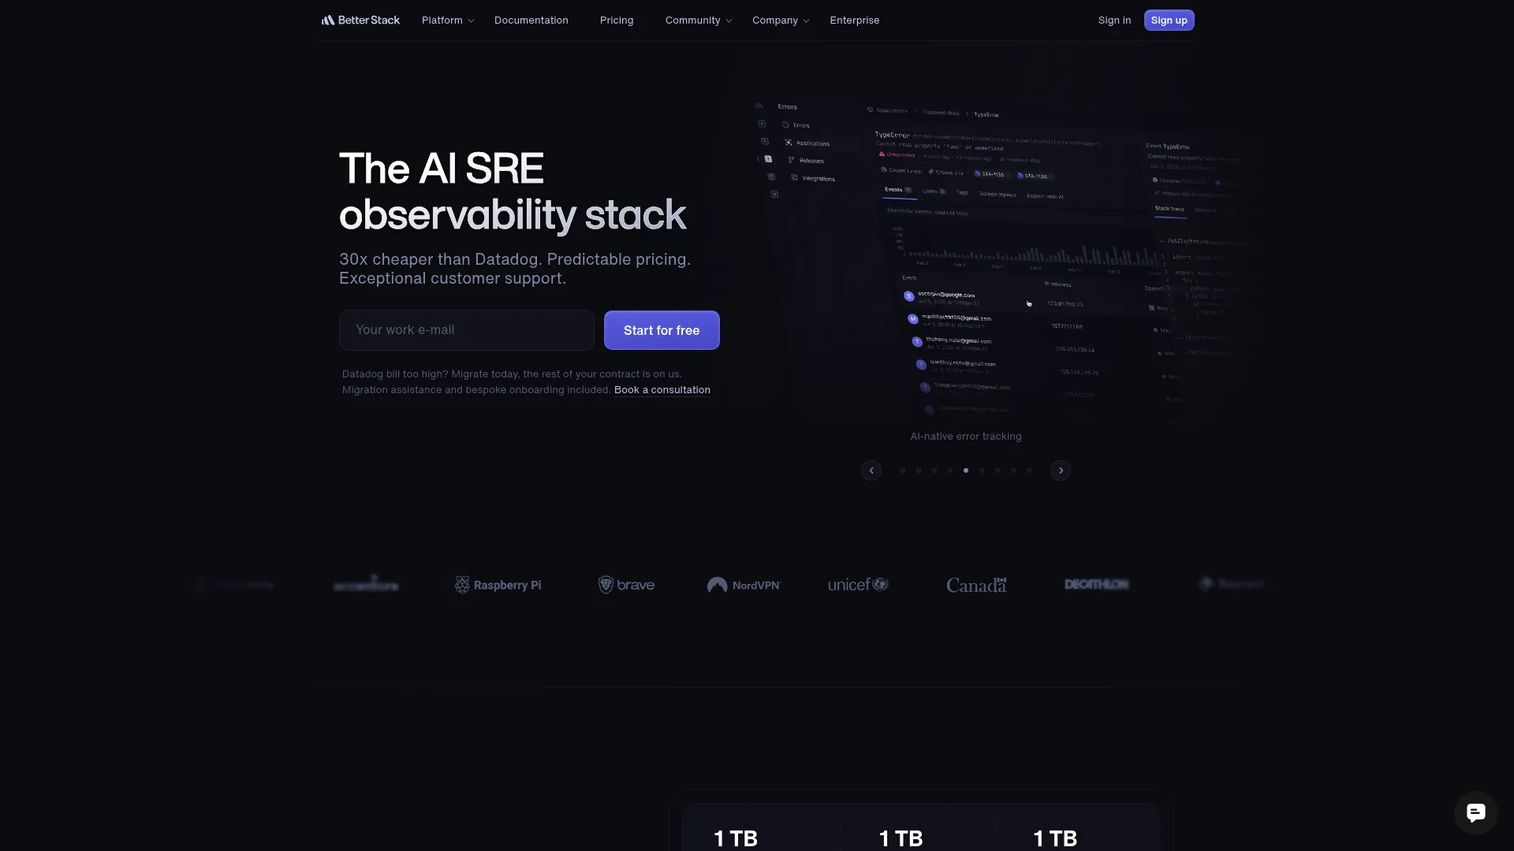
Better Stack combines uptime monitoring, log management, incident management, status pages, and on-call scheduling in a single platform. For SaaS teams responsible for customer-facing availability, it removes the need to stitch together separate uptime, incident, and status tools. Its AI-powered incident investigation and root-cause features address the follow-up question after an alert fires.
Best for: SaaS engineering and SRE teams that need uptime alerting, on-call coordination, and status page communication together.
Key features
- Uptime, heartbeat, and transaction monitoring
- On-call scheduling with phone and SMS alerts
- Log and trace management with SQL and PromQL querying
- AI-powered incident investigation and root-cause analysis
- Public and private status pages
Why choose Better Stack: Strong fit for product and engineering teams that own customer-facing availability and want monitoring, incident response, and status communication without adopting enterprise ITSM. The G2 rating of 4.8/5 reflects satisfaction across smaller, fast-moving teams.
Better Stack pricing: Free personal project plan available. Responder licenses start at $29 per license per month billed annually ($34 monthly). Observability plans start at $25 per month annually (Nano tier).
G2 rating: 4.8/5
11. UptimeRobot
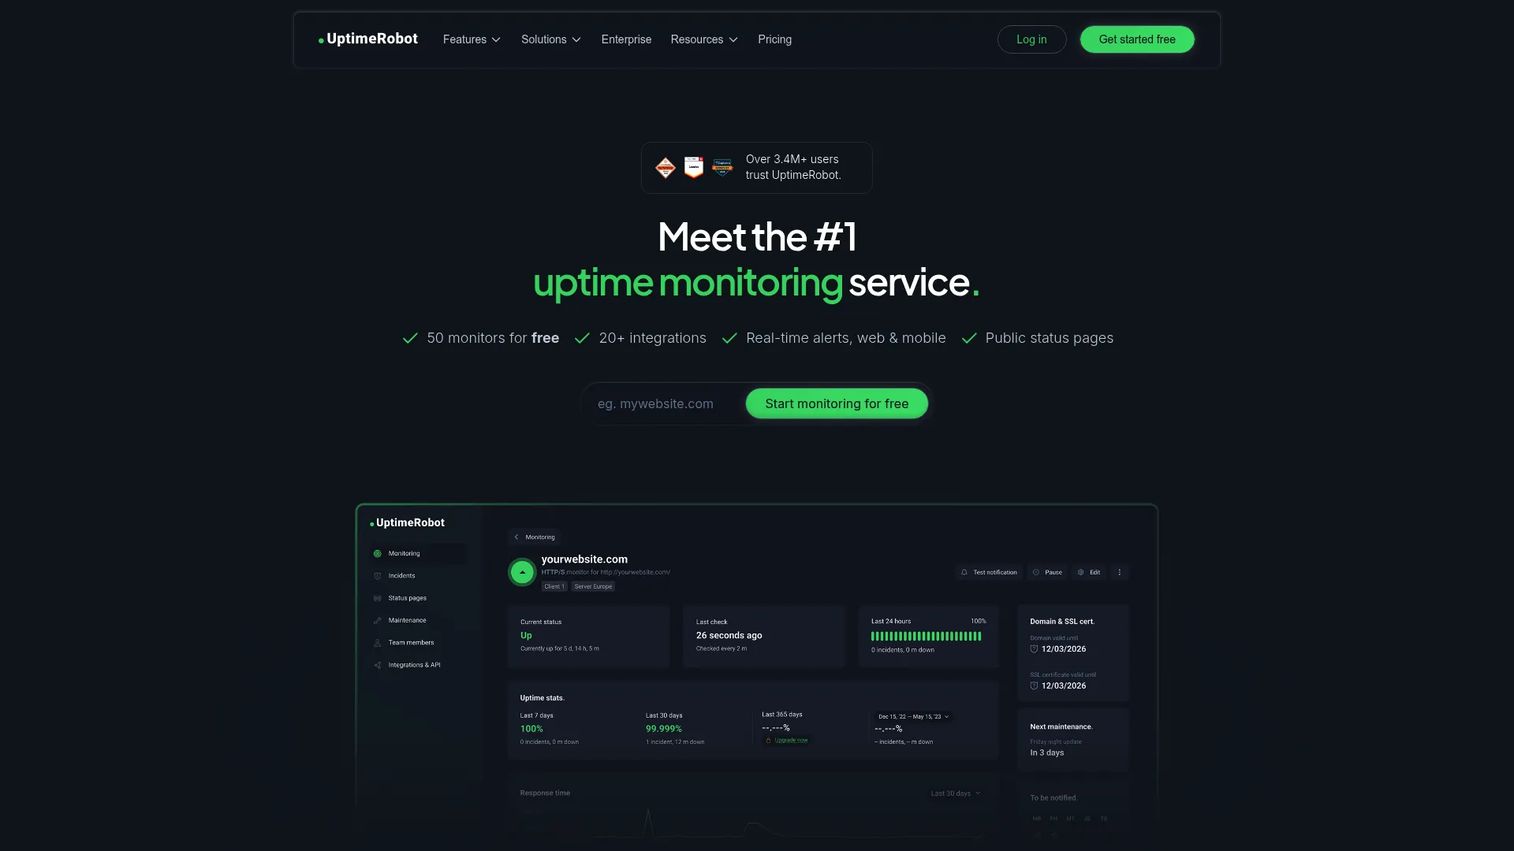
UptimeRobot is an uptime monitoring service covering websites, APIs, ports, keywords, SSL certificates, DNS, and cron jobs. Alerts fire when a monitor goes down, and notifications reach teams through email, SMS, voice, Slack, and webhooks. It is not a full incident response platform, but for teams that need basic availability monitoring with minimal configuration overhead, it handles the job efficiently.
Best for: Small teams and developers needing simple, reliable uptime notifications without incident management overhead.
Key features
- Website, API, and port monitoring
- SSL certificate and domain expiration alerts
- Multi-location monitoring checks
- Status page creation and sharing
- Integrations with Slack, PagerDuty, and webhooks
Why choose UptimeRobot: Choose it for availability monitoring where the goal is a fast, low-cost notification when something goes down. It does not replace on-call routing or incident response tools, but it feeds them well.
UptimeRobot pricing: Free plan includes 50 monitors. Solo plans start at €9 per month (approximately $10), Team plans at €35 per month, and Scale at €65 per month. Annual billing saves approximately 15%.
G2 rating: 4.7/5
12. New Relic
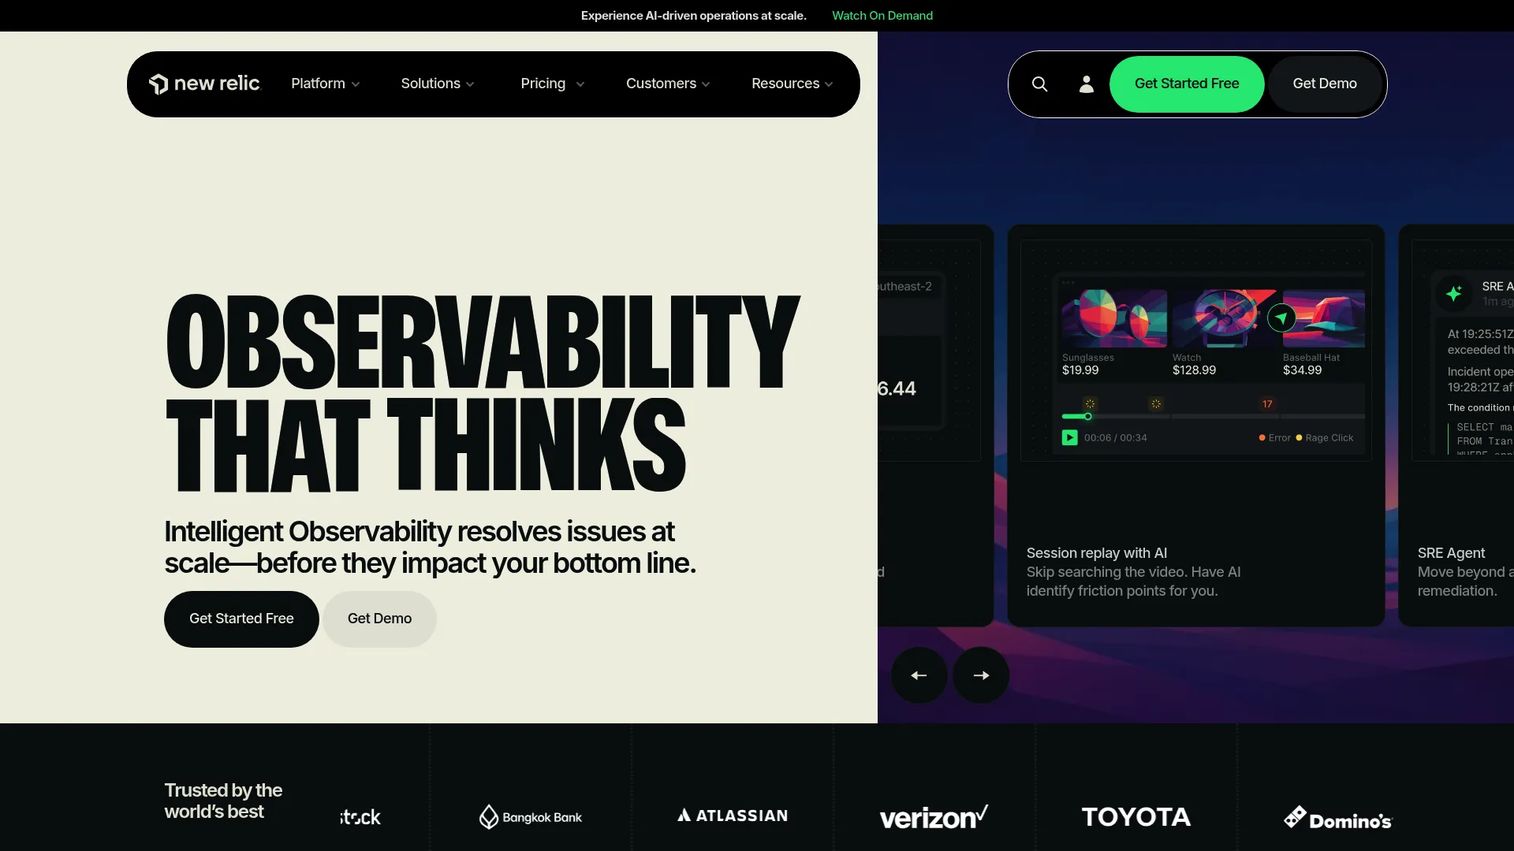
New Relic is a full-stack observability platform with alerting across applications, infrastructure, logs, digital experiences, and AI workloads. Alert policies connect directly to telemetry data already collected by New Relic agents, so conditions can fire on APM response times, error rates, infrastructure CPU, or log patterns without exporting data to a separate alerting system. For teams using observability platforms to improve API monitoring, this kind of tight integration matters significantly.
Best for: Engineering and DevOps teams that want alert conditions grounded in full-stack telemetry data.
Key features
- APM alerts on response time, throughput, and error rate
- Infrastructure alerts for cloud and Kubernetes environments
- Log-based alert conditions
- Synthetic monitoring and uptime checks
- Incident intelligence with correlation and notification workflows
Why choose New Relic: Strong when performance context is as important as the notification itself. The usage-based pricing model makes it accessible for small teams and scales with data volume for larger environments.
New Relic pricing: Free tier includes 100 GB of data ingest per month and one full platform user. Standard plans are $10 per month for the first full platform user. Pro plans start at $349 per user per month on annual commitment. Enterprise pricing requires contacting sales.
G2 rating: 4.4/5
13. Dynatrace
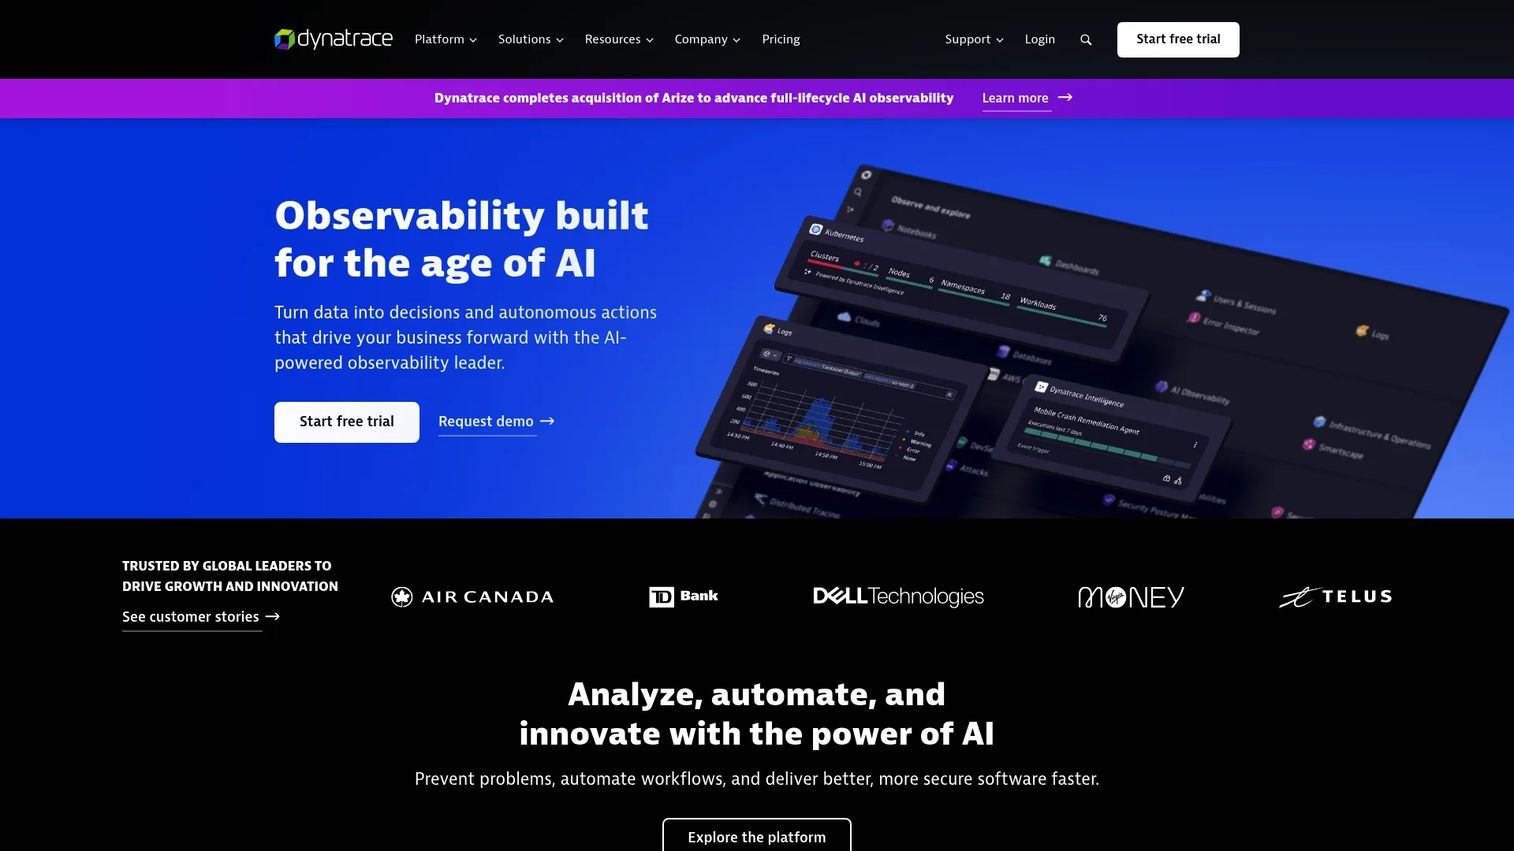
Dynatrace is an enterprise observability and automation platform. Its Davis AI engine performs automatic root-cause analysis and groups related anomalies into a single problem card rather than generating separate alerts for each affected service. For large environments with complex service dependencies, this reduces the number of incidents responders need to triage while providing deeper context on what caused the issue.
Best for: Enterprises with complex hybrid and cloud environments that need alert context, root-cause analysis, and automatic dependency mapping.
Key features
- Automatic discovery and instrumentation via OneAgent
- AI-powered root-cause analysis and predictive detection
- Log analytics with Grail and DQL
- Application observability with distributed tracing
- Automation workflows and custom application development
Why choose Dynatrace: The Davis AI engine handles alert correlation and problem grouping automatically, which matters most in environments where dozens of services fail as a cascade from one root cause. The consumption model scales with actual usage rather than fixed seats.
Dynatrace pricing: Consumption-based pricing requires a 15-day free trial to evaluate. Foundation and Discovery starts at $0.01 per host per hour. Infrastructure Monitoring is $0.04 per host per hour. Full-Stack Monitoring is $0.01 per memory-GiB-hour. Contact Dynatrace for annual commitment pricing.
G2 rating: 4.5/5
14. Checkmk
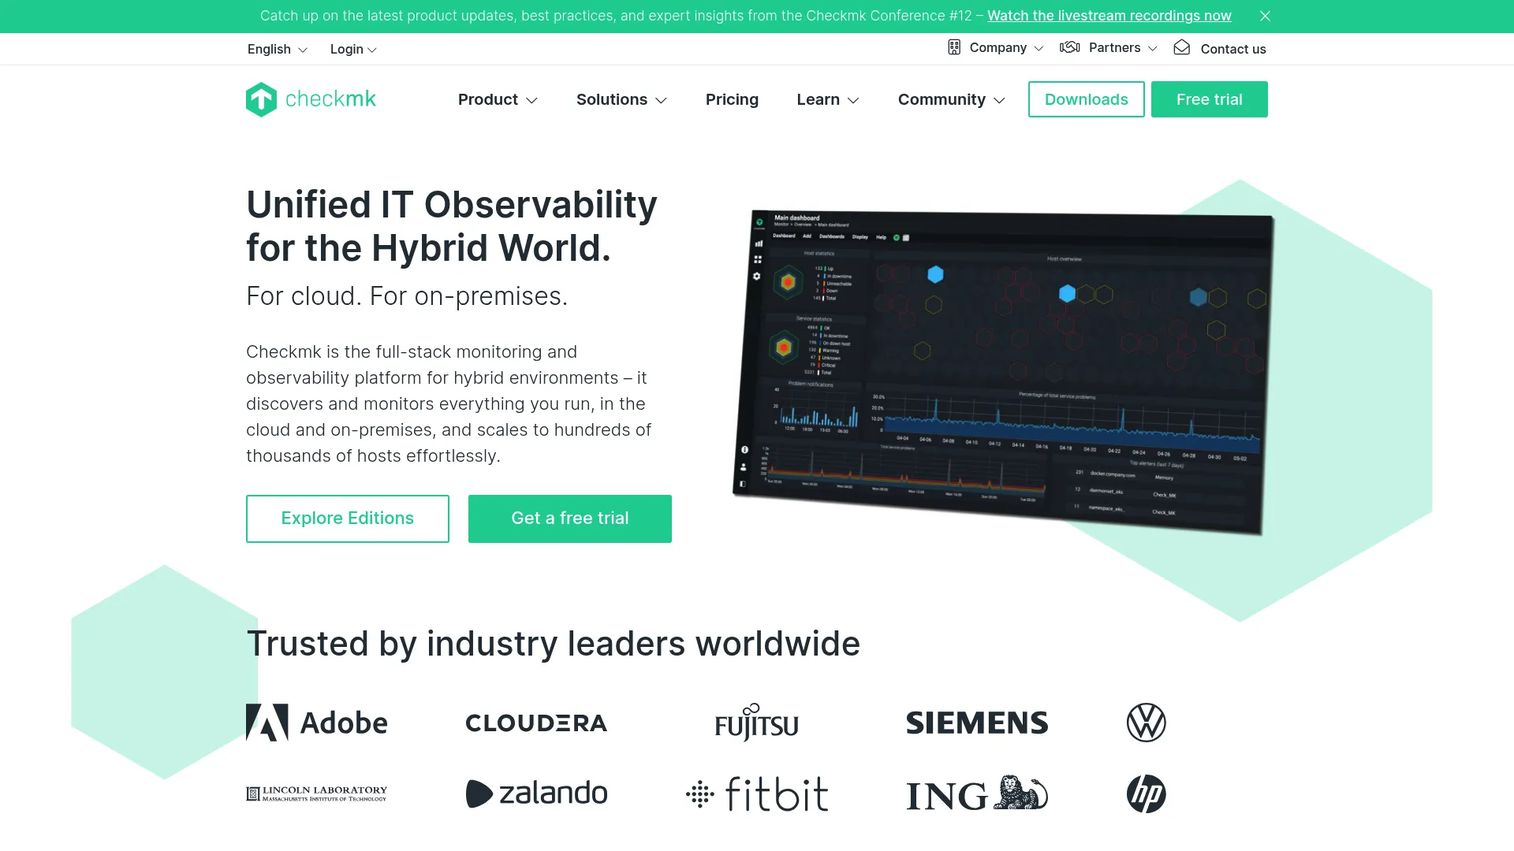
Checkmk is a full-stack infrastructure monitoring platform with over 2,000 built-in integrations covering servers, networks, cloud, storage, databases, and containers. Teams define monitoring checks and alert thresholds themselves, which gives granular control over what triggers a notification. The Community edition is free and open source, making it accessible for teams that want infrastructure-first alerting without a SaaS subscription.
Best for: IT teams that need deep infrastructure monitoring with full control over check definitions and notification rules.
Key features
- Automated service discovery across hybrid and cloud environments
- SNMP support for network device monitoring
- Over 2,000 built-in integrations
- Threshold-based and anomaly alerting
- Granular role and permission management
Why choose Checkmk: Well suited for teams that prefer defining their own monitoring logic rather than accepting defaults. The free Community edition lets teams validate the tool before committing to a commercial plan.
Checkmk pricing: Checkmk Community is free and open source. Commercial editions (Pro, Ultimate, and Cloud) require a personalized quote through the Checkmk website.
G2 rating: 4.7/5
15. Atera
Atera is an all-in-one IT management platform for MSPs and IT departments. It combines remote monitoring and management (RMM), ticketing, patch management, automation scripts, and remote access in a per-technician pricing model. Alerts generated by RMM monitoring flow directly into the ticketing system, keeping technician workflows connected without switching between tools.
Best for: MSPs and IT departments that want RMM alerts, ticketing, and remote access connected in a single per-technician workflow.
Key features
- Remote monitoring and management with threshold alerts
- Integrated ticketing and service portal
- Patch management and compliance reporting
- IT automation and scripting
- AI Copilot and autonomous AI agents for assisted resolution
Why choose Atera: The per-technician model covers unlimited endpoints, which removes the per-device cost pressure that affects MSPs managing variable client endpoint counts. A 30-day free trial is available without requiring a credit card.
Atera pricing: Atera uses per-technician pricing with unlimited endpoints. The pricing page currently requires contacting sales for specific plan costs. A 30-day free trial is available.
G2 rating: 4.6/5
16. SuperOps
SuperOps is a unified PSA and RMM platform for MSPs. It connects network monitoring and alerting directly to PSA ticketing, asset management, client reporting, and automation policies. For MSPs consolidating from multiple separate tools, it addresses the alert-to-ticket gap that causes technician time loss.
Best for: MSPs that want PSA and RMM alerting in one operating workflow without separate platform subscriptions.
Key features
- Unified endpoint management for Windows, Mac, and Linux
- Integrated ticketing and asset management
- Automated patch management and compliance
- Network monitoring and alerting
- Apple and Android mobile device management
Why choose SuperOps: A practical consolidation choice for MSPs running separate PSA and RMM tools. Alert-to-ticket workflows, client reporting, and automation policies stay in one place, which reduces technician context-switching during incident response.
SuperOps pricing: Prime plans start at $1.50 per endpoint per month (tiered by volume, 100-endpoint minimum). Prime Plus plans start at $3.00 per endpoint per month (150-endpoint minimum) and include Apple and Android MDM.
G2 rating: 4.4/5
17. ManageEngine OpManager
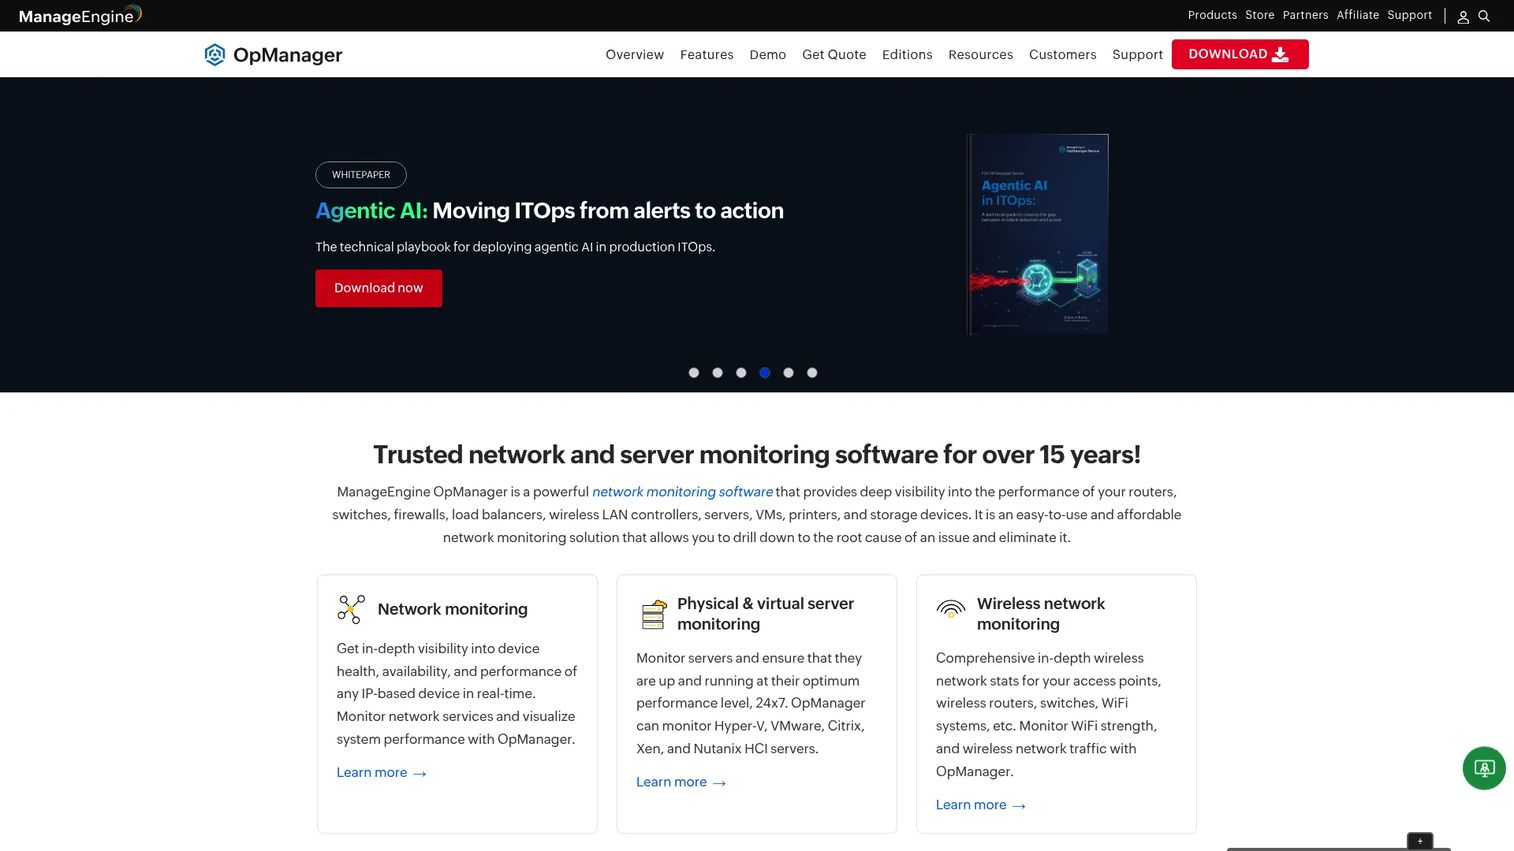
ManageEngine OpManager is network and infrastructure monitoring software that covers routers, switches, servers, virtual machines, and storage devices. Alerts fire on threshold breaches and performance anomalies, with AIOps capabilities including adaptive thresholds and root-cause analysis. Network operations teams monitoring multi-vendor device estates find it a practical fit.
Best for: Network operations teams that need device-level monitoring, threshold alerts, and network topology visibility.
Key features
- Automated network discovery and topology mapping
- Real-time performance monitoring with threshold alerts
- AIOps adaptive thresholds and root-cause analysis
- Fault management and downtime tracking
- Performance dashboards and historical reporting
Why choose ManageEngine OpManager: Designed for teams where network device availability is the primary monitoring concern. It differs from on-call platforms by focusing on infrastructure visibility rather than human escalation logic.
ManageEngine OpManager pricing: Standard Edition starts at $95 for 10 devices billed annually. Professional Edition is $145 for 10 devices annually. Enterprise Edition is $4,595 for 250 devices annually. A free trial is available.
G2 rating: 4.5/5
18. Jira Service Management
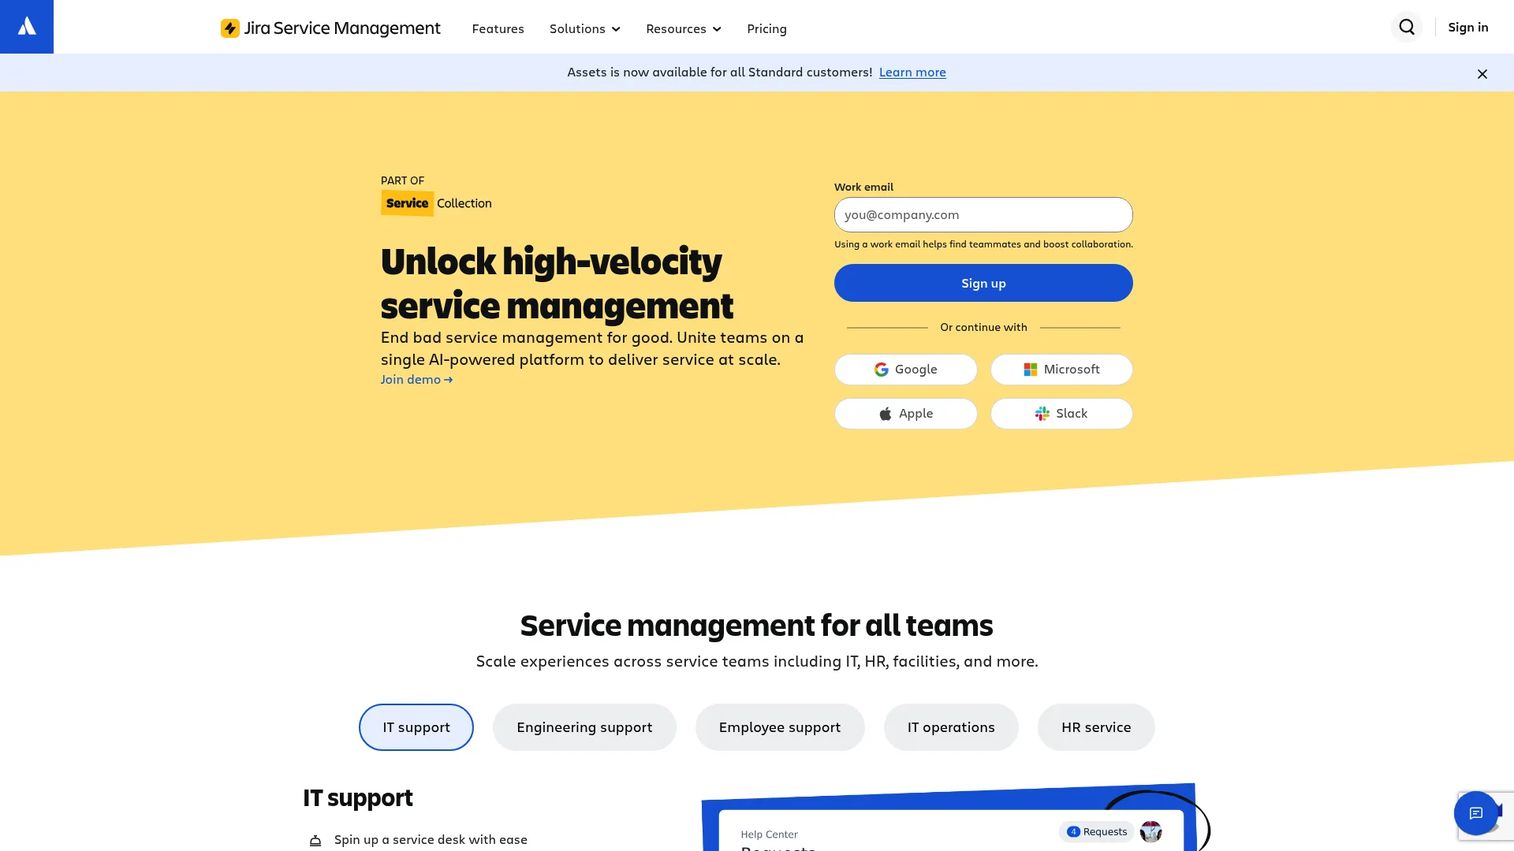
Jira Service Management is Atlassian's ITSM and incident management platform. It now includes on-call scheduling, alert management, escalation policies, and incident response capabilities alongside its service desk, change management, and asset management features. For teams already using Jira Software for engineering workflows, it keeps service and incident management inside the same Atlassian environment.
Best for: IT and DevOps teams that want service desk, on-call, and incident response managed together inside Atlassian.
Key features
- On-call scheduling with escalation and alert routing
- Incident, problem, and change management in one platform
- Request management through portals, email, chat, and forms
- Asset and configuration management with dependency visibility
- AI-powered virtual service agent and knowledge management
Why choose Jira Service Management: The best active Atlassian option for teams previously evaluating Opsgenie. It combines ITSM workflows with the on-call and alert features that Opsgenie offered, inside a platform with a long-term product roadmap.
Jira Service Management pricing: Free plan supports up to 3 agents. Standard plans are $21.50 per agent per month. Premium plans are $55.28 per agent per month. Enterprise pricing requires contacting sales.
G2 rating: 4.3/5
19. ConnectWise RMM
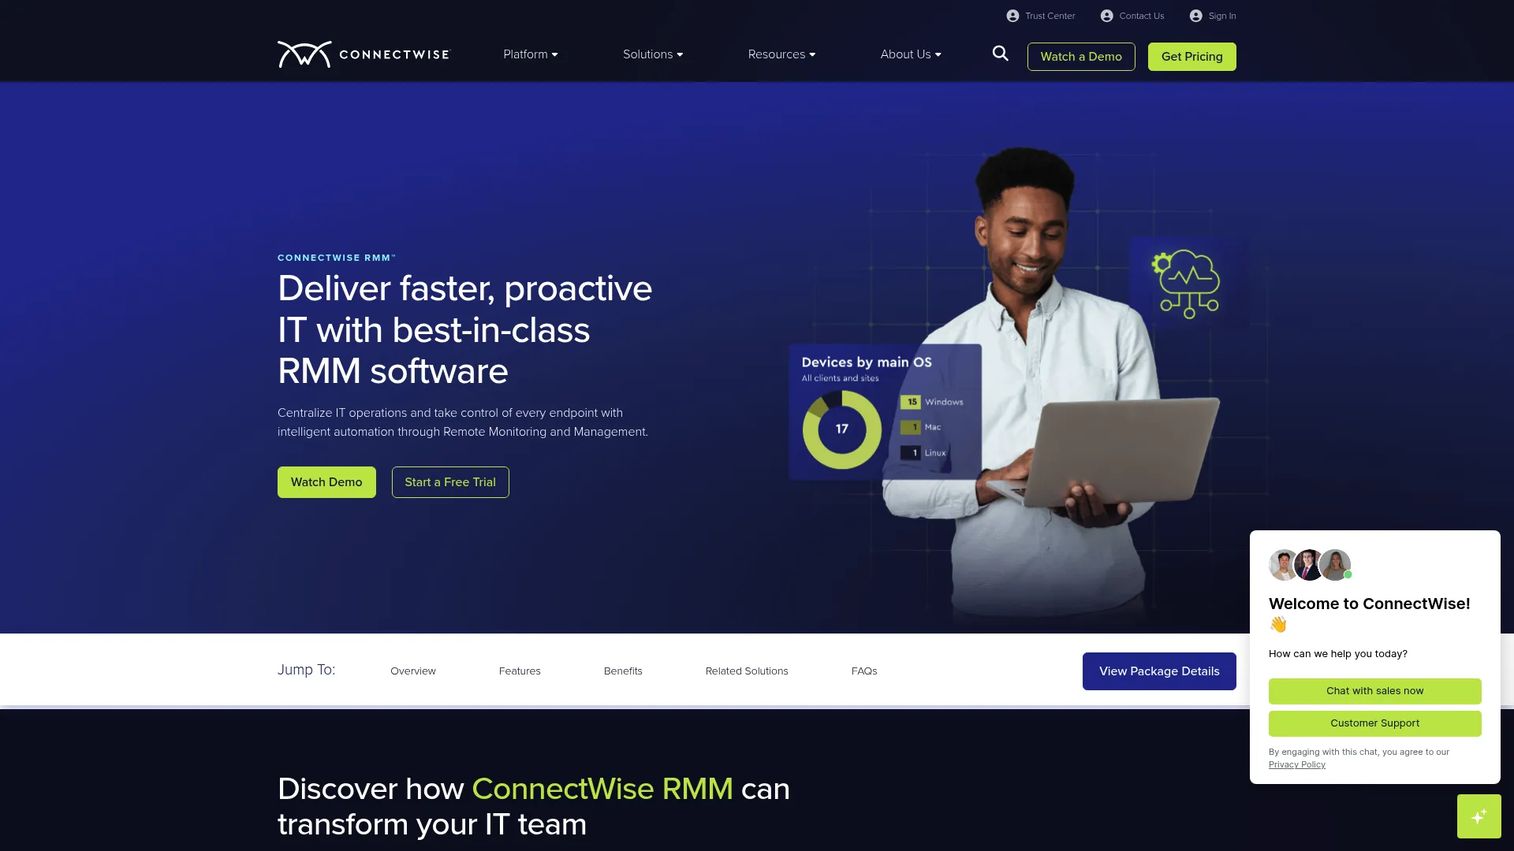
ConnectWise RMM is a cloud-based remote monitoring and management platform for MSPs. It focuses on intelligent alerting, automated remediation, and multi-tenant monitoring templates that let MSPs deploy consistent alert configurations across client environments. Reusable templates reduce the per-client setup time that makes RMM alert management expensive at scale.
Best for: MSPs managing multiple client environments that need reusable alert templates, automated remediation, and multi-tenant operations.
Key features
- Intelligent monitoring and alerting with noise reduction
- Automated operating system and third-party patching
- Remote access and troubleshooting via ScreenConnect
- IT automation and scripting
- Network monitoring and topology mapping
Why choose ConnectWise RMM: When alert volume directly affects technician capacity across many clients, the template-based approach and automated remediation workflows reduce the manual response burden. MSPs with large endpoint counts will find the multi-tenant architecture practical.
ConnectWise RMM pricing: Three packages are available: Essentials, Pro, and Premium. All pricing requires a quote. Cost drivers include endpoint count, selected modules, support tier, and managed monitoring services.
G2 rating: 4.1/5
20. Amazon Simple Notification Service
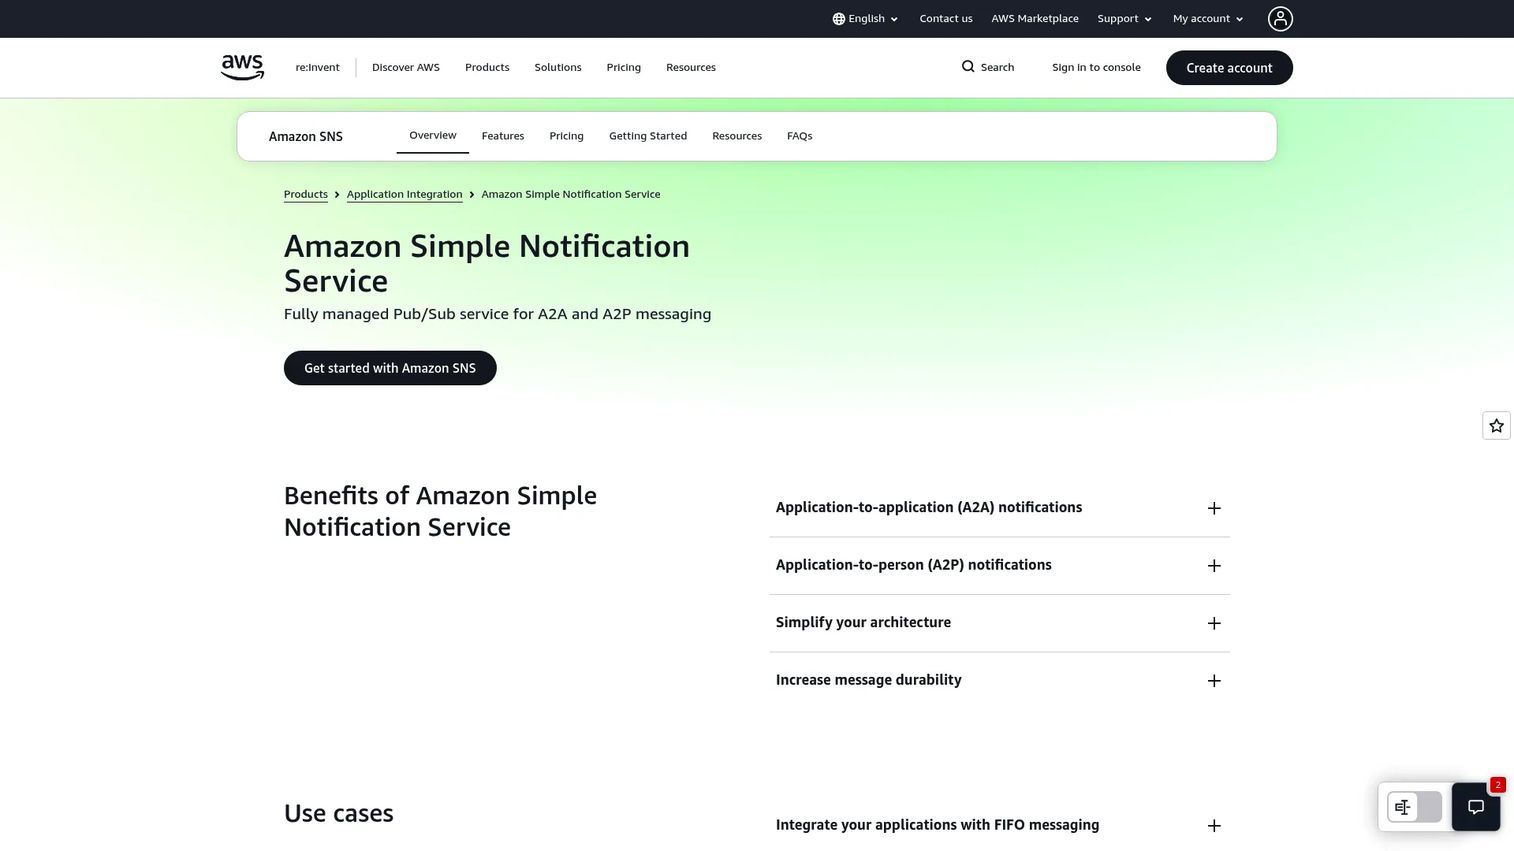
Amazon Simple Notification Service (SNS) is a fully managed publish/subscribe messaging service for AWS-based notification delivery. It sends messages from AWS events to HTTP endpoints, Lambda functions, SQS queues, email addresses, SMS recipients, and mobile push targets. SNS is infrastructure for custom alerting pipelines, not a complete incident response platform. Teams with engineering ownership of their alerting architecture use it as the delivery backbone.
Best for: AWS-native teams building custom alert delivery workflows with engineering control over routing and endpoints.
Key features
- Standard and FIFO topics with message ordering and deduplication
- Message filtering, batching, fanout, retries, and dead-letter queues
- Delivery through SQS, Lambda, HTTP/S, email, SMS, and mobile push
- High-scale delivery without infrastructure management
- Event-driven integration with AWS services
Why choose Amazon SNS: Choose it when you need programmatic alert delivery with full architectural control. It is not a replacement for on-call platforms but works as the notification layer underneath them for AWS-native environments.
Amazon SNS pricing: Generous free tier available. Standard topics cost $0.50 per 1 million API requests. HTTP notification deliveries are $0.06 per 100,000. Email deliveries are $2.00 per 100,000. SMS pricing varies by destination and carrier.
G2 rating: 4.3/5
Considerations when choosing IT alerting software
Start with the alert source, not the notification channel
Email, SMS, Slack messages, and push notifications are delivery mechanisms, not the thing you should evaluate first. Before choosing how alerts arrive, validate what triggers them: Event quality, threshold accuracy, ownership mapping, and severity classification. A well-routed Slack message carrying a vague alert description still requires a human to diagnose from scratch.
Check how the tool reduces noise
Deduplication collapses duplicate events. Grouping clusters related alerts into one incident. Suppression silences alerts during planned maintenance windows. Correlation connects related symptoms across systems. Look for visible evidence of noise reduction in practice: Fewer duplicate incidents, cleaner on-call handoffs, and lower false-positive rates over time.
Validate escalation before procurement
Schedule and escalation configuration is where many tools look good in a demo but fail in production. Test fallback responders, override handling, multi-team routing, holiday coverage, and what happens when the primary contact does not acknowledge within the configured window. Ask vendors to walk through a realistic after-hours scenario with real escalation depth.
Match alerting to your operating model
The right tool depends on which of four operating models fits your team: DevOps and SRE teams prioritize telemetry-based alert quality and MTTR; internal IT service desks prioritize ticket ownership and SLA reporting; MSPs prioritize multi-tenant templates and client-level noise reduction; enterprise ITSM teams prioritize governance, CMDB context, and ITIL process integration.
Inspect reporting and post-incident data
Good alerting tools produce data that improves operations over time. Look for MTTA and MTTR by team and service, escalation depth reporting, false-positive rate trends, acknowledgement time distributions, and postmortem export capability. Teams using best presales software tools to validate complex SaaS products will recognize this as the equivalent of asking for pilot success metrics before committing to a POC.
Conclusion
The right IT alerting software depends on your operating model, not just your notification preferences.
For on-call and incident response, PagerDuty remains the most mature option. AlertOps and xMatters handle complex escalation and orchestration requirements. OnPage covers persistent critical delivery where acknowledgement must succeed.
For observability-led alerting, Datadog, New Relic, and Dynatrace each connect alert conditions to telemetry depth. Checkmk and ManageEngine OpManager serve infrastructure-first teams that want monitoring control without a SaaS subscription.
For ITSM workflows, ServiceNow and Jira Service Management both tie alerting to service management processes. Freshservice is the practical choice for service desks that want alerts converted to managed tickets.
For MSPs, ConnectWise RMM, Atera, and SuperOps each connect RMM alerts to technician workflows with different models for client management and endpoint pricing.
For uptime-focused teams, Better Stack and UptimeRobot cover availability monitoring and status page communication without enterprise complexity. Amazon SNS handles AWS-native notification delivery for teams with engineering ownership of their alerting pipeline.
Shortlist three tools by operating model, then test alert ingestion, deduplication, routing, escalation, and MTTR reporting against realistic incident scenarios before committing to a purchase.
If your team sells complex software and needs to show technical workflows before a live call, Guideflow lets you create interactive product demos that help buyers understand product capabilities across sales engineering, support, and onboarding use cases.
Start your journey with Guideflow today!
FAQs
IT alerting software detects conditions from monitoring, cloud, security, and business systems, then routes, escalates, and tracks notifications until a responder acknowledges. It connects signals to response rather than simply delivering messages. The goal is faster MTTA and lower MTTR through structured ownership and escalation logic.
Monitoring software detects conditions and generates events. Alerting software decides what to do with those events: Which human to contact, through which channel, in what order, and at what time. Some platforms like Datadog and New Relic handle both. Others like PagerDuty specialize in the alerting and escalation layer and ingest events from external monitoring tools.
Escalation policies define what happens when the primary responder does not acknowledge within a set time. The policy specifies fallback responders, alternative channels (voice call after SMS, for example), and the escalation depth. Strong tools log the full escalation path, including each step taken and the timestamp of each acknowledgement or failure to respond.
Alert fatigue comes from too many low-value interruptions. Deduplication collapses duplicate events. Grouping clusters related symptoms into a single incident. Suppression silences alerts during planned maintenance. Better threshold rules stop monitoring noise from becoming on-call noise. The goal is fewer meaningless pages, not fewer meaningful alerts. According to Splunk's State of Observability 2025, 52% of teams already cite false alerts as a challenge, so noise reduction is a pre-purchase requirement worth testing explicitly.
Core channels include email, SMS, voice calls, mobile push notifications, and chat tools like Slack and Microsoft Teams. Ticketing system integration (Jira, ServiceNow, Freshservice) turns alerts into managed incidents. Webhooks allow custom integrations with automation platforms. Channel coverage matters less than routing logic: The right channel for the wrong person at the wrong time still fails.
Yes, when the tool supports workflow automation, runbook execution, or integrations with scripting and automation platforms. PagerDuty, xMatters, AlertOps, and ConnectWise RMM all offer automation capabilities. Before enabling automated remediation in production, test the safeguards, confirm audit trail logging, and validate rollback behavior for any action that modifies infrastructure.
MSPs need multi-tenant monitoring with reusable alert templates, per-client noise reduction, integrated ticket creation, and technician workload visibility. Every false alert becomes wasted technician time or a billing dispute. Atera, SuperOps, and ConnectWise RMM are purpose-built for this model. MSPs comparing account management software alongside RMM tools often find that the client-management layer matters as much as the alerting engine itself.
Build a realistic incident scenario before the vendor demo. Test alert ingestion from a real monitoring source, watch deduplication handle duplicate events, trace the routing logic to the correct on-call owner, confirm escalation fires when acknowledgement is delayed, verify ticket creation, and then pull the MTTA and MTTR reports. Ask the vendor to run the same scenario rather than a sanitized environment. The gap between a polished demo and production behavior is where most alerting tools reveal their actual limitations.