Your devices are already generating telemetry. The harder problem is knowing which signal deserves a roadmap decision, which one should fire an operator alert, and which one is just noise.
Most teams discover failures after customers or field operators do. Dashboards get built, alerts get configured, and yet the gap between raw device data and an actual operational decision stays wide. According to IoT Analytics in 2026, enterprise IoT spending grew 13% to $324 billion in 2025, with 21.1 billion connected devices worldwide. That volume of telemetry is not the problem. Turning it into decisions is.
The platform you choose determines whether your device data drives predictive maintenance, product reliability improvements, and faster support resolution, or whether it sits in a data store that nobody trusts enough to act on. The right IoT analytics platform matches your instrumentation maturity, your deployment constraints, and the team that will own alerts after go-live.
What's inside
This guide compares 12 IoT analytics platforms for 2026, written for PMs, IoT product teams, operations leaders, and data teams.
- Who this is for: Product managers building connected-device products, operations leaders evaluating monitoring software, engineering managers comparing deployment architectures
- How tools were chosen: IoT analytics fit, real-time monitoring depth, predictive analytics capability, deployment model flexibility, and buyer relevance
- What you'll get: A comparison table, 12 platform sections, a buying checklist, and FAQs
- How to use it: Shortlist by data source, deployment constraint, and team ownership, not by dashboard count
TL;DR
- Best for frontline operations: Mitti by SafetyCulture connects IoT sensor readings to inspections, corrective actions, and field workflows
- Best for cloud-native IoT data pipelines: Amazon Web Services IoT Analytics suits engineering-led teams already building on AWS infrastructure
- Best for Microsoft-centric enterprises: Microsoft Azure IoT Analytics fits organizations where telemetry, reporting, and identity must stay in the Microsoft stack
- Best for prototyping and MATLAB workflows: ThingSpeak lets teams validate sensor data flows before committing to heavier infrastructure
- Best for open-source IoT platform flexibility: ThingsBoard gives teams dashboards, a rules engine, device management, and flexible deployment in one package
- Best for industrial IoT at scale: Cumulocity IoT covers enterprise-grade connected-asset analytics with cloud and edge deployment options
What are IoT analytics platforms?
IoT analytics platforms collect, process, analyze, and visualize data from connected devices so teams can monitor performance, detect anomalies, forecast failures, and make operational decisions.
They differ from broader IoT platforms, which typically include device management, connectivity, application building, and workflow tools. IoT analytics platforms focus specifically on turning device data into insight and action. Many vendors include both, so the boundary blurs in practice.
Core capabilities to evaluate:
- Device telemetry ingestion: Support for sensors, gateways, machines, apps, and edge systems via MQTT, HTTP, or industrial protocols
- Real-time monitoring: Live dashboards, uptime tracking, and near-real-time alerting on device health and behavior
- Alert rules and notifications: Threshold-based alerts, rule engines, anomaly detection, and escalation routing
- Dashboards and data visualization: Configurable views for operations, product, and executive audiences
- Predictive maintenance models: Machine learning on vibration, cycle counts, temperature, error codes, and usage hours
- Anomaly detection: Statistical and ML-based identification of unusual device behavior
- Edge analytics: Processing at or near the device when latency, bandwidth, or offline operation constraints apply
- Data storage and retention: Time-series stores, data lakes, and retention policies that match operational and compliance requirements
- Integrations and APIs: Connections to CRM, ERP, ticketing, and business intelligence tools
- Security and data governance: RBAC, SSO, audit logs, tenant separation, and data residency controls
For PMs, the most important thing to understand before platform selection is instrumentation quality. If your device events use inconsistent schemas, unreliable timestamps, or missing device identifiers, even the best analytics platform will produce noisy output. The platform does not fix upstream data problems.
When to use IoT analytics platforms
Monitor connected products in real time
Real-time monitoring covers device health, uptime, location, temperature, pressure, vibration, battery, and connectivity. The platform fires alerts when a threshold is crossed or an anomaly appears. For PMs, this is the layer that lets you identify failure patterns before customers notice them, which reduces support volume and churn risk.
Predict maintenance before equipment fails
Predictive maintenance uses telemetry like vibration signatures, cycle counts, temperature trends, and error code frequency to forecast when equipment will need attention. This applies across manufacturing, energy, fleet, facilities, and industrial robotics. The PM relevance is clear: It moves your product and operations workflows from reactive to proactive, which changes how support is resourced and how SLAs are designed.
Turn telemetry into roadmap and operations decisions
Aggregated device behavior tells you which features get used, where failures cluster, and which customer segments see the most reliability problems. Connect those signals to product metrics like retention, adoption rates, and support deflection. The warning here: Dashboard volume is not decision-making quality. Teams that instrument everything but route nothing to a decision owner end up with data that nobody acts on.
IoT analytics platforms comparison
Use this table to shortlist by deployment model, analytics depth, and team ownership. Pricing and G2 ratings reflect verified figures from vendor pricing pages and G2 listings.
| # | Product | Best for | Key differentiator | Pricing | G2 rating |
|---|---|---|---|---|---|
| 1 | Mitti by SafetyCulture | Frontline operations and inspections | IoT analytics tied to field workflows | Free; from $24/seat/mo | N/A |
| 2 | Amazon Web Services IoT Analytics | Cloud-native IoT data pipelines | Deep AWS services integration | Usage-based | 4.5/5 |
| 3 | Microsoft Azure IoT Analytics | Microsoft-centric enterprise teams | Azure-native IoT data and analytics stack | Usage-based | N/A |
| 4 | ThingSpeak | Prototyping and academic IoT projects | MATLAB analytics and sensor visualization | Free; paid licenses available | 4.3/5 |
| 5 | Oracle IoT Cloud Service | Oracle enterprise environments | Oracle stack integration for enterprise IoT | Custom pricing | 3.9/5 |
| 6 | Datadog | Observability across infrastructure and IoT | Unified monitoring across apps, infra, and devices | Free; from $15/host/mo | 4.5/5 |
| 7 | Cisco Edge Intelligence | Edge data extraction and governance | Data movement from edge systems to destinations | Custom pricing | 4.5/5 |
| 8 | Fogwing | Industrial IoT application builders | Modular IoT platform with CMMS and analytics | From $15/user/mo | N/A |
| 9 | SensorCloud | Sensor data storage and visualization | Sensor-focused cloud analytics with FastGraph | Free; from $35/mo | 4.1/5 |
| 10 | Ubidots | Lightweight IoT dashboards and alerts | Fast dashboarding for connected devices | From $99/mo | 4.5/5 |
| 11 | ThingsBoard | Open-source IoT platform teams | Flexible dashboards, rules, and deployment models | Free; from $49/mo | 4.5/5 |
| 12 | Cumulocity IoT | Industrial IoT and enterprise operations | Industrial IoT analytics with cloud and edge options | From €215/mo | 4.3/5 |
Best 12 IoT analytics platforms for 2026
1. Mitti by SafetyCulture
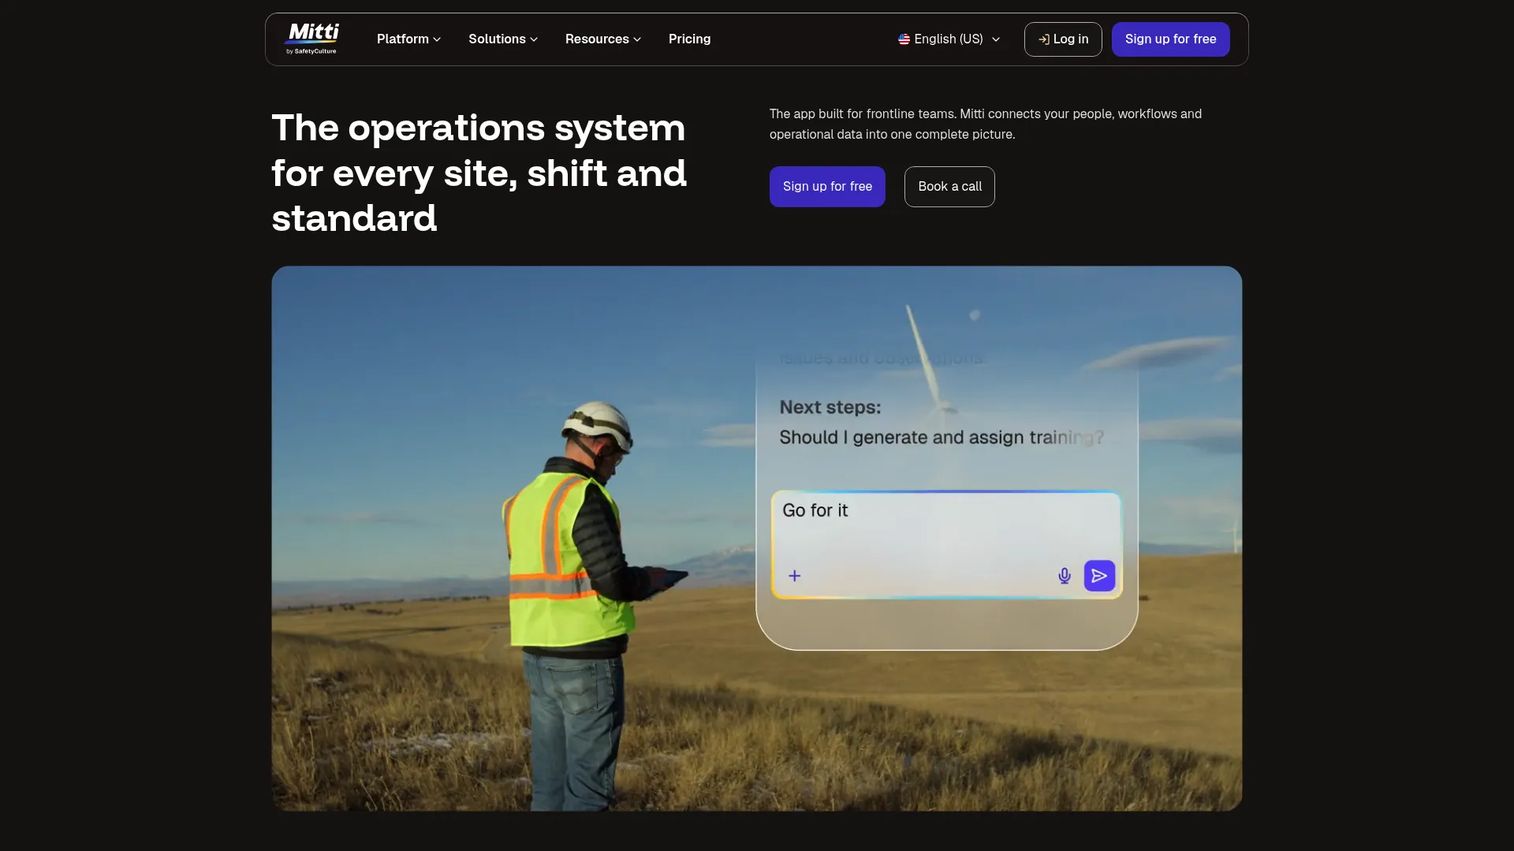
Mitti by SafetyCulture is a frontline operations platform that connects IoT sensor monitoring to inspections, issue reporting, training, and asset maintenance workflows. Where most IoT analytics platforms stop at dashboards and alerts, Mitti routes device readings into the operational actions that follow. It suits multi-site organizations where connected-device data must trigger field execution, not just appear on a screen.
Best for: Operations-heavy teams that need IoT analytics connected to inspections, corrective actions, and frontline workforce workflows.
Key features
- IoT sensor monitoring with threshold-based alerts
- Mobile inspection and checklist tools
- Issue reporting and corrective action tracking
- Asset maintenance and compliance management
- AI-assisted issue capture and reporting
Why choose Mitti: Choose Mitti when analytics need to reduce operational risk, not simply report metrics. If the gap in your workflow is between "sensor fires an alert" and "field team takes action," Mitti closes that gap.
Mitti pricing: A free plan supports teams up to 10 seats. Premium runs $24 per seat per month billed annually, or $29 per seat per month billed monthly. Enterprise pricing goes through sales.
2. Amazon Web Services IoT Analytics
Amazon Web Services IoT Analytics is a managed AWS service for collecting, filtering, transforming, enriching, storing, and analyzing IoT device data. It is designed for engineering-led teams that want control over every layer of the ingestion, storage, and analytics pipeline. The service sits inside the AWS ecosystem, so downstream use of S3, SageMaker, QuickSight, and Lambda is straightforward. Teams with limited cloud architecture resources should plan carefully before committing to this approach.
Best for: Engineering-led teams building custom IoT analytics pipelines on existing AWS infrastructure.
Key features
- IoT data ingestion, filtering, and transformation
- Managed time-series data store with SQL query support
- Machine learning analysis via built-in integrations
- AWS service connectivity (S3, SageMaker, QuickSight)
- Custom analytics workflows
Why choose AWS IoT Analytics: Choose AWS when your team already runs on AWS infrastructure and the product strategy requires custom analytics depth. Engineering capacity and cloud architecture experience must be factored into the opportunity cost.
AWS IoT Analytics pricing: AWS prices this service on usage. Cost drivers include messages processed, data stored, and queries run. The dedicated IoT Analytics pricing page redirects to the general AWS IoT hub; check the AWS pricing calculator for current per-unit rates specific to your message volume and retention requirements.
G2 rating: 4.5/5 on G2.
3. Microsoft Azure IoT Analytics
Microsoft Azure IoT Analytics is not a single product but an Azure-native stack of services for connecting, ingesting, processing, and analyzing device and asset data. Key components include Azure IoT Hub for device connectivity, Azure Stream Analytics for real-time data processing, Azure Data Explorer for time-series querying, and Power BI for operational reporting. Buyers assemble the stack that fits their use case rather than buying a single packaged tool. Enterprise identity, SSO, and governance controls inherit from the broader Azure and Microsoft 365 environment.
Best for: Enterprises already using Azure, Microsoft identity, and Power BI where telemetry, reporting, and enterprise identity need to stay in a single cloud environment.
Key features
- Azure IoT Hub for device connectivity and management
- Stream Analytics for real-time data processing
- Power BI integration for operational dashboards
- Azure Data Explorer for time-series querying
- Enterprise identity and governance via Microsoft Entra
Why choose Microsoft Azure IoT Analytics: Strong fit when stakeholder adoption depends on familiar reporting tools like Power BI. The PM tradeoff is configuration depth in exchange for faster cross-team buy-in among Microsoft-native organizations.
Microsoft Azure IoT Analytics pricing: Each Azure service carries its own usage-based pricing. IoT Hub costs vary by device count and message tier; Stream Analytics charges per streaming unit per hour; Power BI has its own licensing model. Visit the Azure pricing calculator for current estimates across the services your architecture requires.
4. ThingSpeak
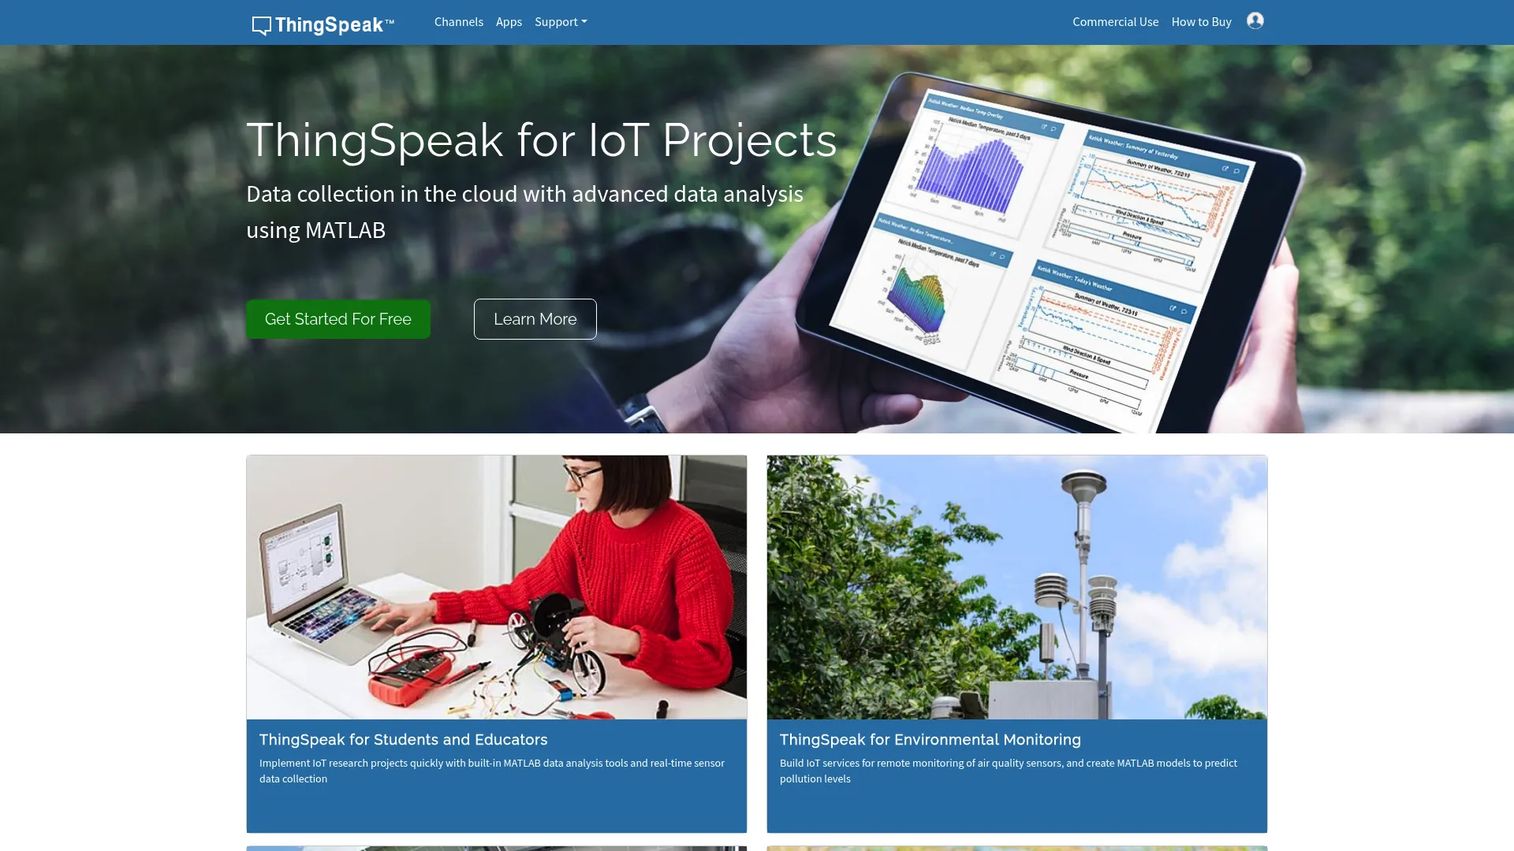
ThingSpeak is a MathWorks IoT analytics platform for collecting, visualizing, and analyzing live sensor data streams in the cloud. Its core differentiation is native MATLAB integration, which lets researchers and engineers run custom analytics directly on sensor channels without building a separate analytics environment. It connects via REST and MQTT APIs and supports event-based alerts. ThingSpeak is well established in academic research, hardware prototyping, and smaller connected-device projects.
Best for: PMs, engineers, researchers, and educators who need to validate sensor data flows and run MATLAB-based analytics before investing in heavier infrastructure.
Key features
- Cloud-hosted sensor data channels
- MATLAB-powered analytics and custom visualizations
- REST API and MQTT API connectivity
- Event-based alerts and ThingHTTP actions
- Fast charting for real-time sensor feeds
Why choose ThingSpeak: Choose ThingSpeak when the team needs to validate sensor data flows and run analytical experiments quickly. It is a strong tool for technical discovery and proof-of-concept learning before committing engineering resources to a production-scale stack.
ThingSpeak pricing: A free tier is available for non-commercial small projects with usage limits. Paid licenses are sold in annual units. One unit covers 33 million messages per year. Standard, Academic, Student, and Home license categories are listed on the pricing page, but numeric prices are not displayed; contact MathWorks for current annual rates.
G2 rating: 4.3/5 on G2.
5. Oracle IoT Cloud Service
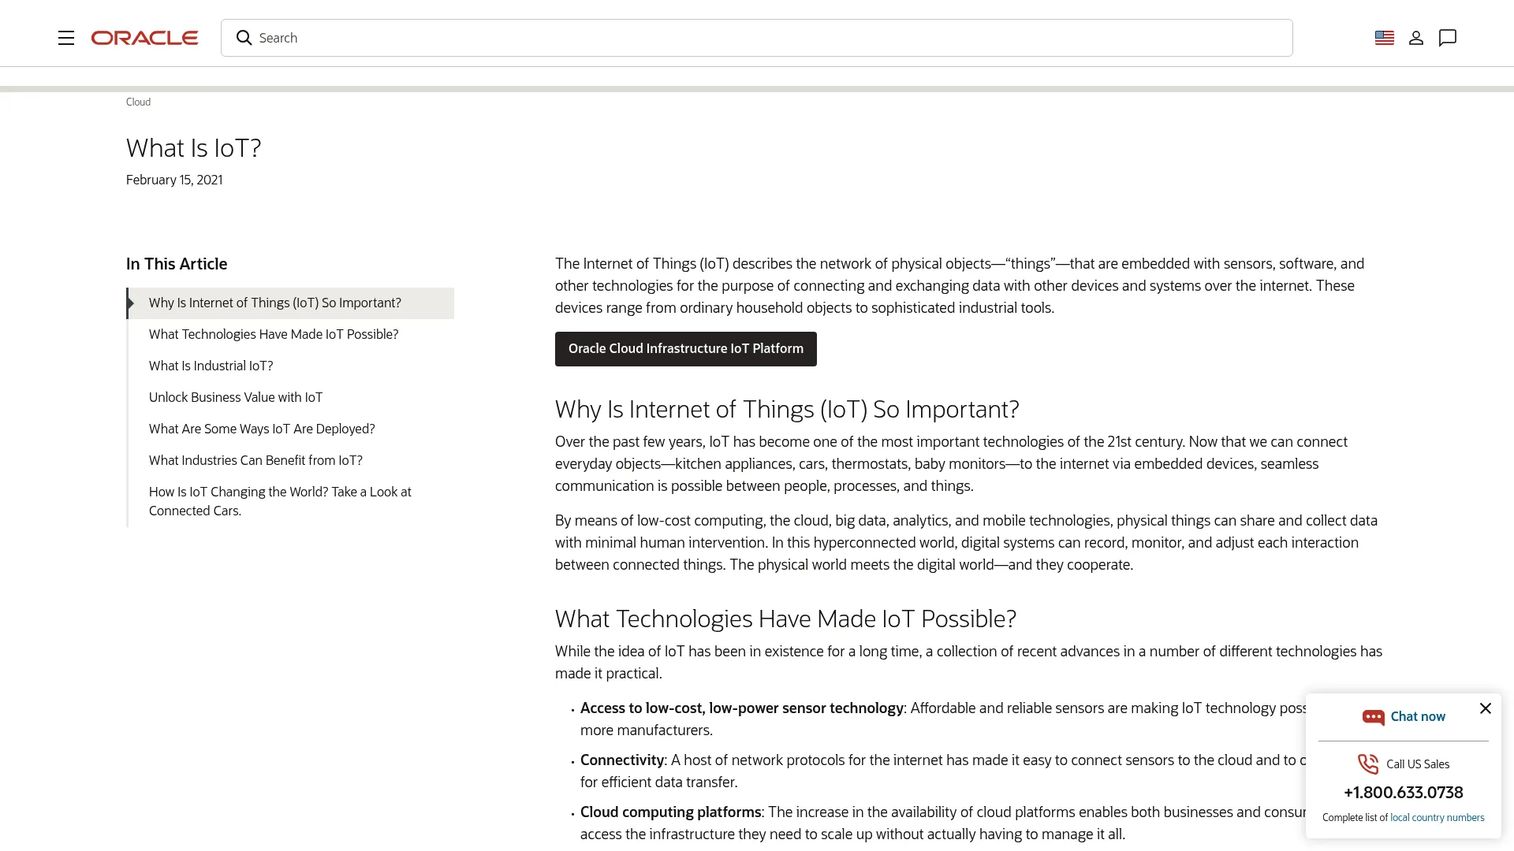
Oracle IoT Cloud Service provides scalable services for connecting devices, ingesting and normalizing telemetry, modeling digital twins, and integrating IoT data with Oracle Cloud applications and analytics. It connects devices via MQTTS, HTTPS, and MQTT over WebSockets and stores telemetry in an included Oracle Autonomous AI Database. REST APIs, OCI SDKs, and console-based administration give developers direct access to device data and analytics workflows. The platform is positioned for enterprise buyers who are already running Oracle business systems and want IoT data to feed those same environments.
Best for: Oracle-heavy enterprises that want IoT analytics connected to existing Oracle Cloud applications and operational reporting.
Key features
- Real-time device data ingestion and telemetry normalization
- Digital twin modeling for devices and physical assets
- Device connectivity via MQTTS and HTTPS
- Telemetry storage in Oracle Autonomous AI Database
- REST APIs, OCI SDKs, and console administration
Why choose Oracle IoT Cloud Service: Choose Oracle when IoT telemetry must connect directly to Oracle ERP, supply chain, or manufacturing applications. The PM tradeoff here is that business-process alignment is the strength; rapid experimentation is slower because the platform is optimized for enterprise governance, not developer velocity.
Oracle IoT Cloud Service pricing: Oracle prices this through sales. Ask for the OCI Internet of Things Platform edition, included service components, and usage drivers tied to your device scale and data volume. No self-serve pricing was verified on the product page.
G2 rating: 3.9/5 on G2 based on 18 reviews.
6. Datadog
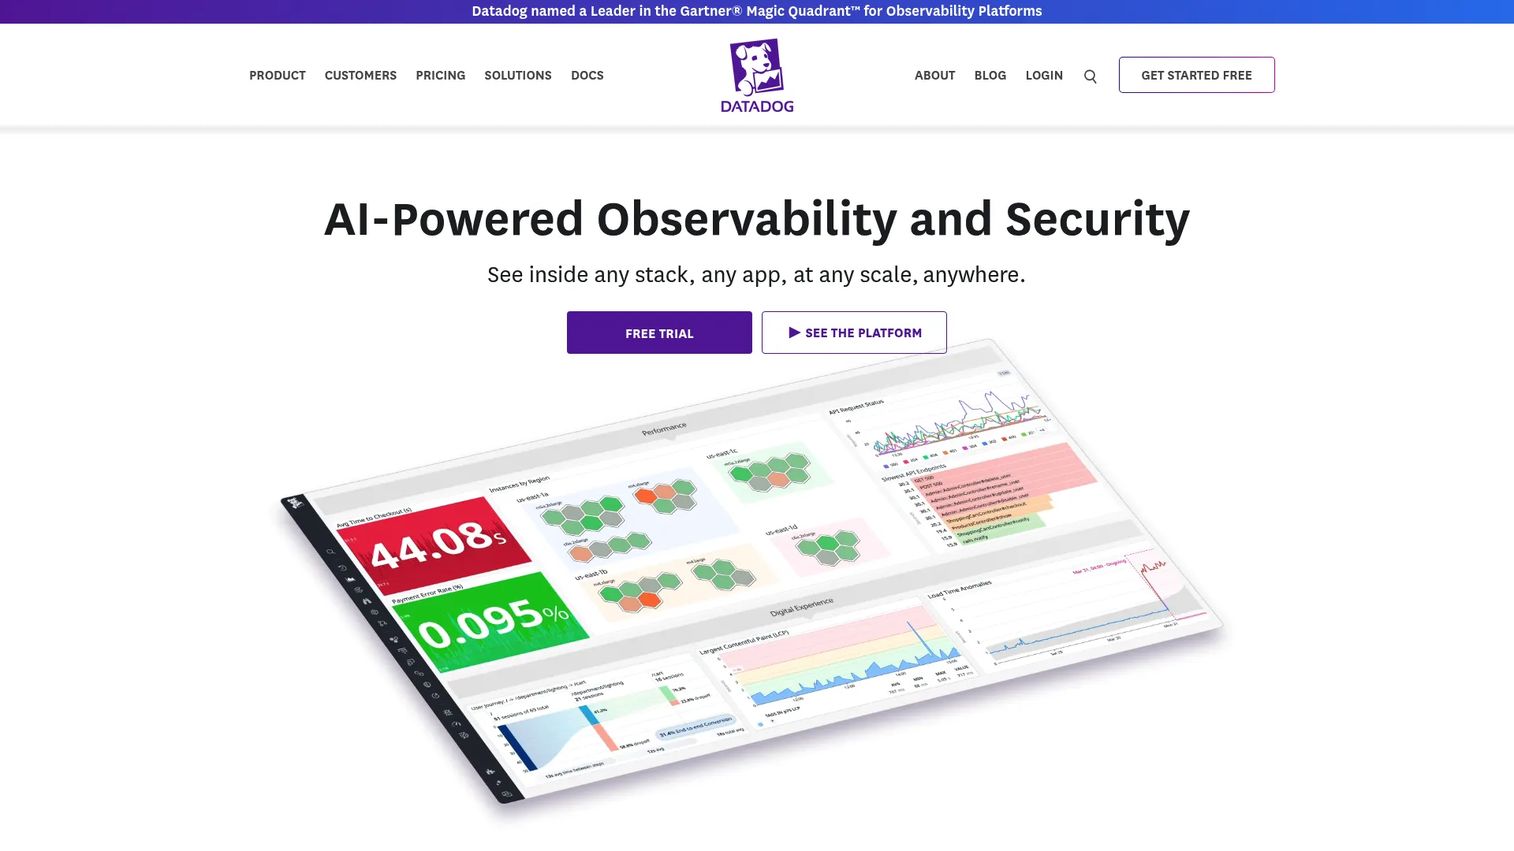
Datadog is an observability and security platform that unifies monitoring across infrastructure, applications, logs, traces, and custom metrics. For IoT use cases, Datadog fits teams where device telemetry flows alongside cloud services, APIs, and application performance. It is not a purpose-built IoT analytics tool, but its custom metrics, alert workflows, and dashboard builder handle IoT-adjacent monitoring effectively when devices feed into existing observability pipelines. The big data analytics use case is well covered for teams already running Datadog for infrastructure.
Best for: Engineering and DevOps teams that need IoT-adjacent observability across infrastructure, applications, services, and connected devices in a single monitoring layer.
Key features
- Infrastructure monitoring with integrations, dashboards, and host maps
- Custom metrics for device telemetry ingestion
- Log management, search, and correlation
- Application performance monitoring with distributed tracing
- Alerting workflows with escalation routing
Why choose Datadog: Choose Datadog when IoT telemetry is part of a wider reliability and observability workflow. If device problems frequently overlap with cloud service degradation, API timeouts, or application errors, Datadog surfaces those correlations in a way that purpose-built IoT platforms do not.
Datadog pricing: A free plan is available. Infrastructure Monitoring Pro starts at $15 per host per month billed annually ($18 on-demand). The Enterprise tier runs $23 per host per month billed annually ($27 on-demand). Datadog lists many products with separate pricing; IoT-specific usage may involve additional modules.
G2 rating: 4.5/5 on G2.
7. Cisco Edge Intelligence
Cisco Edge Intelligence is an IoT edge-to-multicloud data orchestration platform. It extracts data from connected industrial assets using industry-standard connectors including OPC UA, Modbus, MQTT, and EtherNet/IP, then applies JavaScript-based transformation and governance rules before routing data to edge or cloud destinations. Destinations include AWS, Azure, and MQTT-based applications. Built-in security and integration with Cisco industrial networking hardware make it relevant for organizations that already run Cisco infrastructure in operational environments.
Best for: Industrial and enterprise teams that need controlled, governed data movement from distributed edge environments to analytics destinations.
Key features
- Industry connectors: OPC UA, Modbus, MQTT, EtherNet/IP
- JavaScript-based edge data transformation
- Granular data governance and routing rules
- Delivery to edge and multicloud destinations
- Built-in security and Cisco industrial device integration
Why choose Cisco Edge Intelligence: Choose Cisco when the analytics blocker is access to usable operational data rather than dashboard design. If devices sit on isolated industrial networks and data must be extracted, cleaned, and routed before reaching a cloud analytics layer, this is the layer that makes it happen.
Cisco Edge Intelligence pricing: Cisco prices this through sales. Ask for current licensing terms, edge node counts, supported data destinations, and support tiers. Note that Cisco has issued an end-of-life announcement for this product; confirm current availability and the recommended migration path before committing.
G2 rating: 4.5/5 on G2 based on 14 reviews.
8. Fogwing
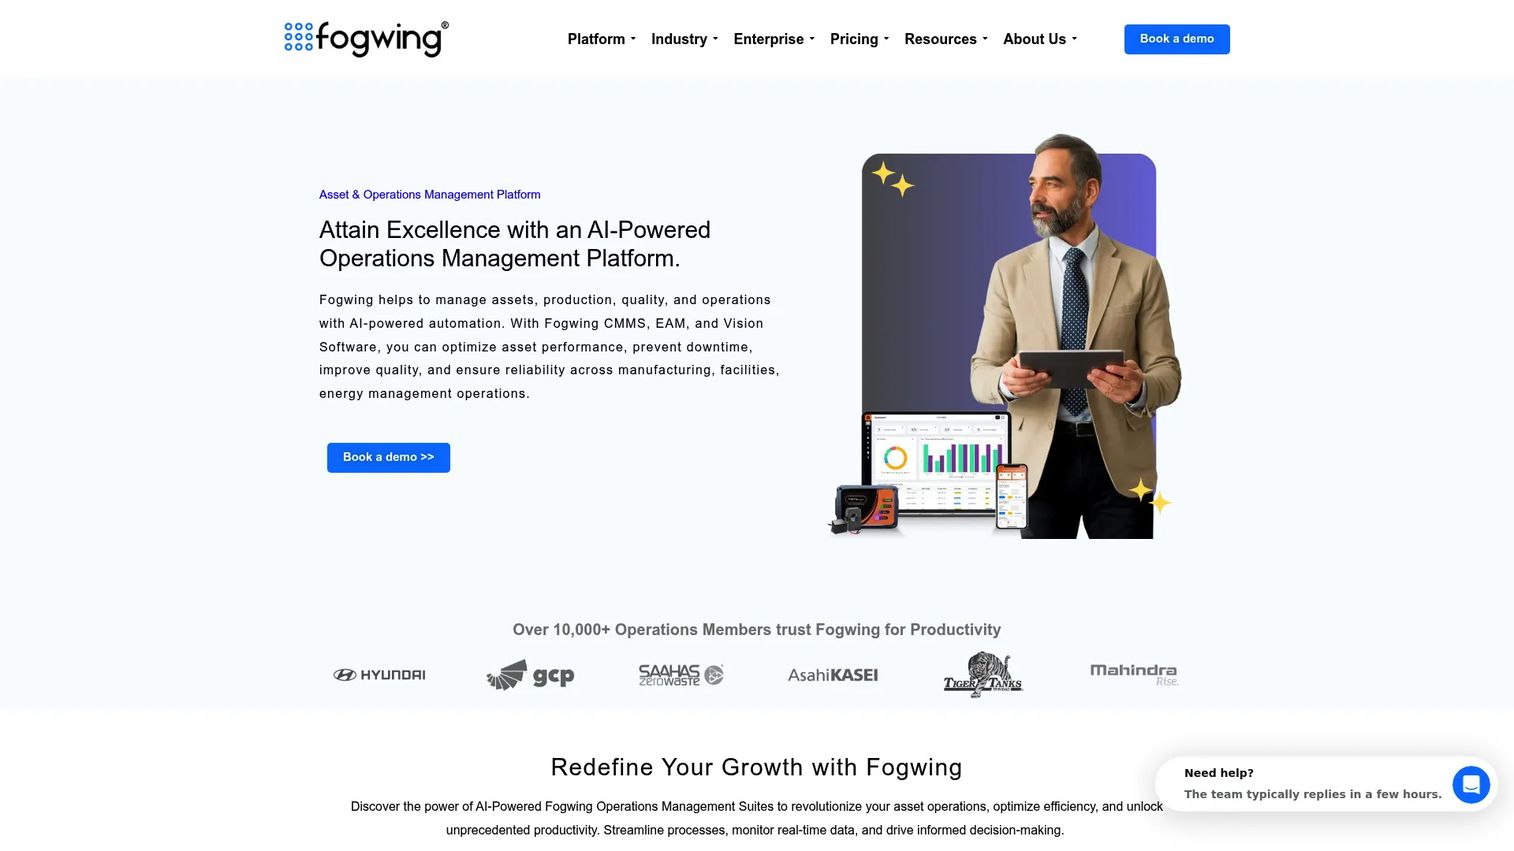
Fogwing is an AI-powered industrial operations management platform that covers asset maintenance, production monitoring, quality inspection, and IoT connectivity in a modular structure. The CMMS module handles work orders, preventive maintenance, and parts inventory. The IoT Platform module handles device connectivity, data streaming, alerts, and analytics. Additional modules address production monitoring with OEE metrics, AI-based visual quality inspection, and environmental tracking. Teams can start with one module and add others as their operational needs grow.
Best for: Manufacturing, facilities, energy, and industrial operations teams that need integrated maintenance, asset management, and IoT analytics without building every layer from scratch.
Key features
- CMMS with work orders, preventive maintenance, and asset management
- Real-time production monitoring with OEE and machine-performance metrics
- IoT connectivity, data streaming, and rule-based alerts
- AI visual quality inspection and defect detection
- Industrial AI Copilot for maintenance assistance
Why choose Fogwing: Choose Fogwing when you need a practical IoT application layer for industrial use cases that goes beyond dashboards into maintenance workflows and production tracking. It suits teams validating connected-product workflows before committing to a fully custom platform build.
Fogwing pricing: The CMMS module starts at $15 per user per month. The IoT Platform starts at $24 per month. A free lifetime account is available with no credit card required. Matrix, Vision, Eco, and the full Asset Operations Management Suite require a quote.
9. SensorCloud
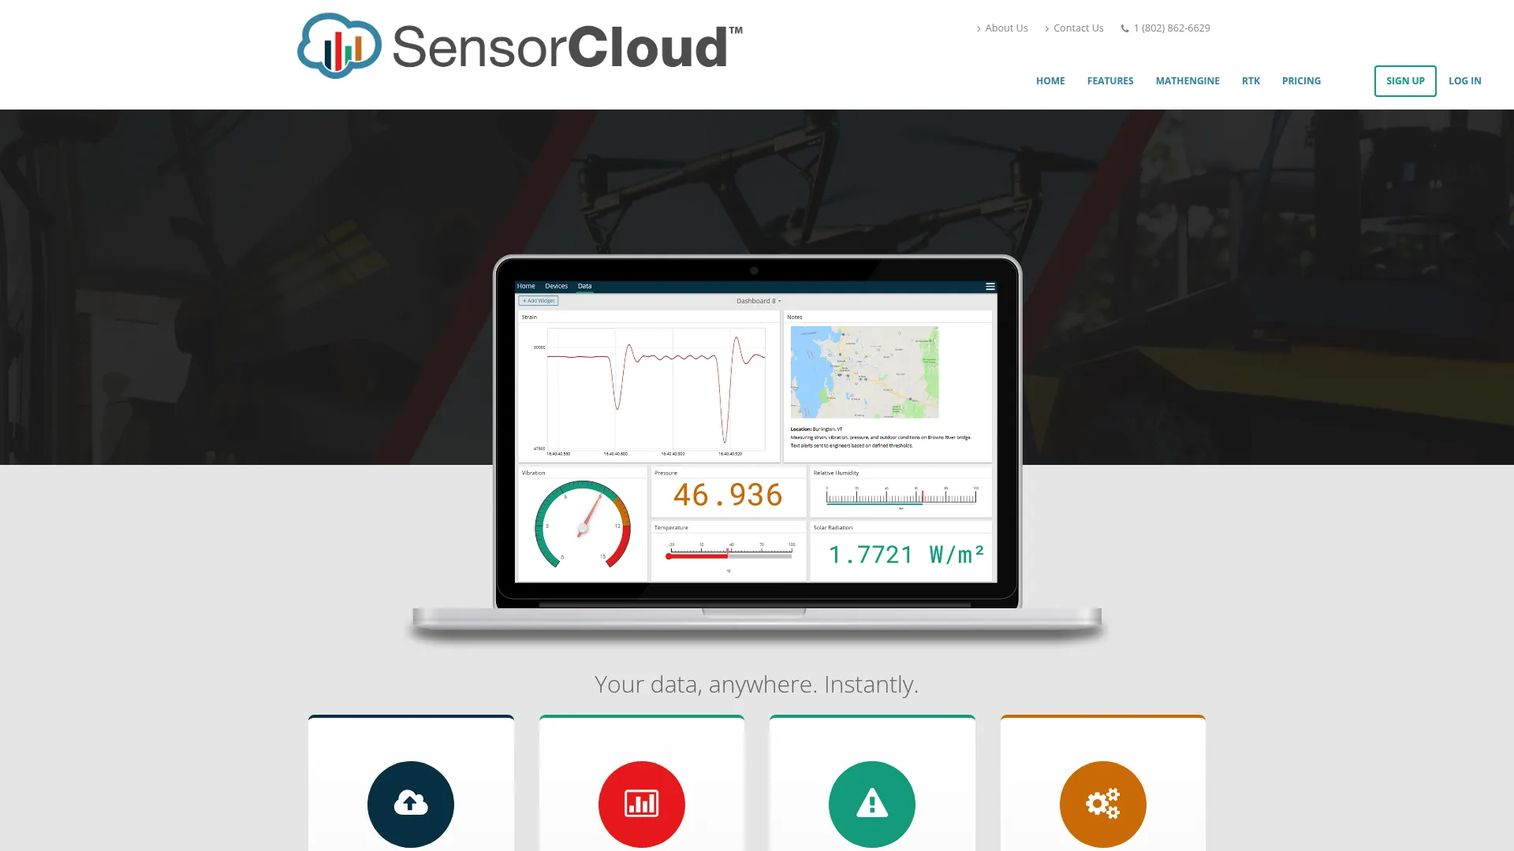
SensorCloud is a cloud platform from MicroStrain focused on sensor data storage, time-series visualization, alerting, and analysis. Its FastGraph engine handles high-speed rendering of large time-series datasets, making it well suited to structural health monitoring, vibration analysis, and similar engineering applications where data volume is high and visual inspection of raw waveforms matters. MathEngine Notebooks bring Jupyter-based analytics to sensor data without requiring a separate analysis environment.
Best for: Industrial and engineering teams that need cloud storage, high-speed visualization, and analytical access to large-scale sensor data streams.
Key features
- Cloud sensor data storage with time-series organization
- FastGraph high-speed time-series visualization
- MathEngine analytics and Jupyter-based notebooks
- RESTful OpenData API and device SDKs
- Custom email and SMS alerts; LiveConnect remote device management
Why choose SensorCloud: Choose SensorCloud when the primary product question is about understanding device behavior over time through time-series data, especially when waveform visualization and engineering analysis matter as much as operational dashboards.
SensorCloud pricing: A Basic Free plan is available with 10 million data points and 25,000 monthly transactions. Premium runs $35 per month, and Pro runs $100 per month, both priced per gateway or API device. Enterprise and OEM custom plans include custom branding and priority support; contact sales for those rates.
G2 rating: 4.1/5 on G2.
10. Ubidots
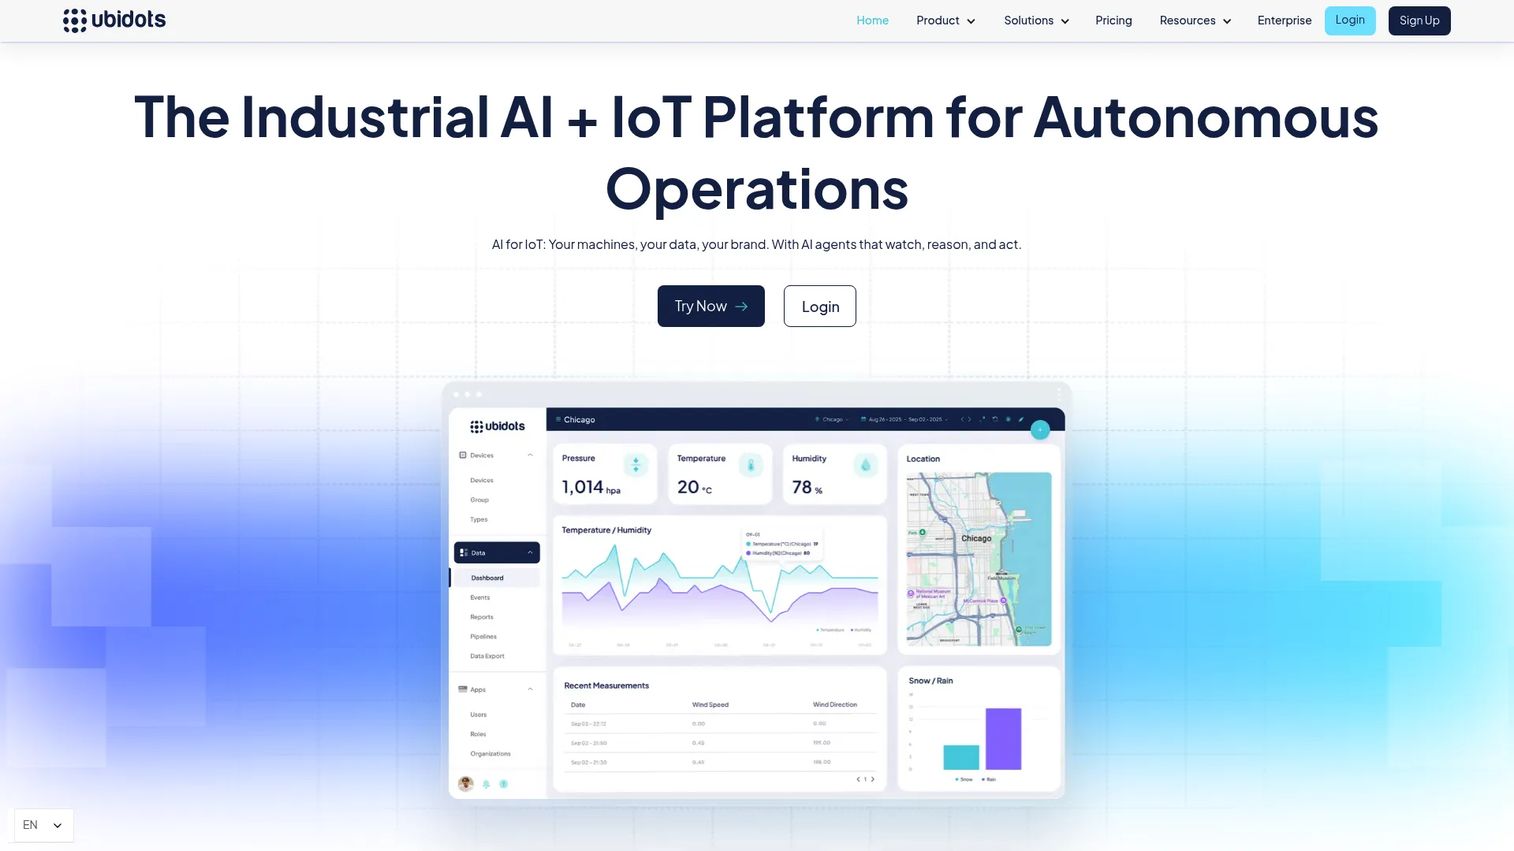
Ubidots is an industrial IoT platform for ingesting, processing, visualizing, and acting on connected-device data. Its dashboard builder is designed for speed, letting teams stand up operational views without deep engineering involvement. The events and rules engine fires on device readings, and synthetic variables let teams calculate derived metrics from multiple device feeds. White-label application support and serverless functions extend the platform toward product teams building branded IoT applications for end customers.
Best for: Teams that need quick IoT dashboards, alerts, and device-data applications, including those building white-label monitoring products for external customers.
Key features
- Real-time IoT dashboards with drag-and-drop builder
- Events and rules engine with multi-channel notifications
- MQTT, HTTP, TCP, and UDP data ingestion
- Synthetic variables and machine learning
- White-label applications and serverless functions
Why choose Ubidots: Choose Ubidots when speed to a usable IoT dashboard matters more than building a custom analytics stack. It fits prototypes, pilots, and lightweight production monitoring. The white-label capability also makes it useful for product teams shipping IoT dashboards to end users.
Ubidots pricing: The Professional plan starts at $99 per month and includes 50 devices, 10 million data points per month, and 6 months of data retention. A non-commercial STEM plan is available for educational use. Industrial and Enterprise plans use custom pricing through sales.
G2 rating: 4.5/5 on G2 based on 2 reviews.
11. ThingsBoard
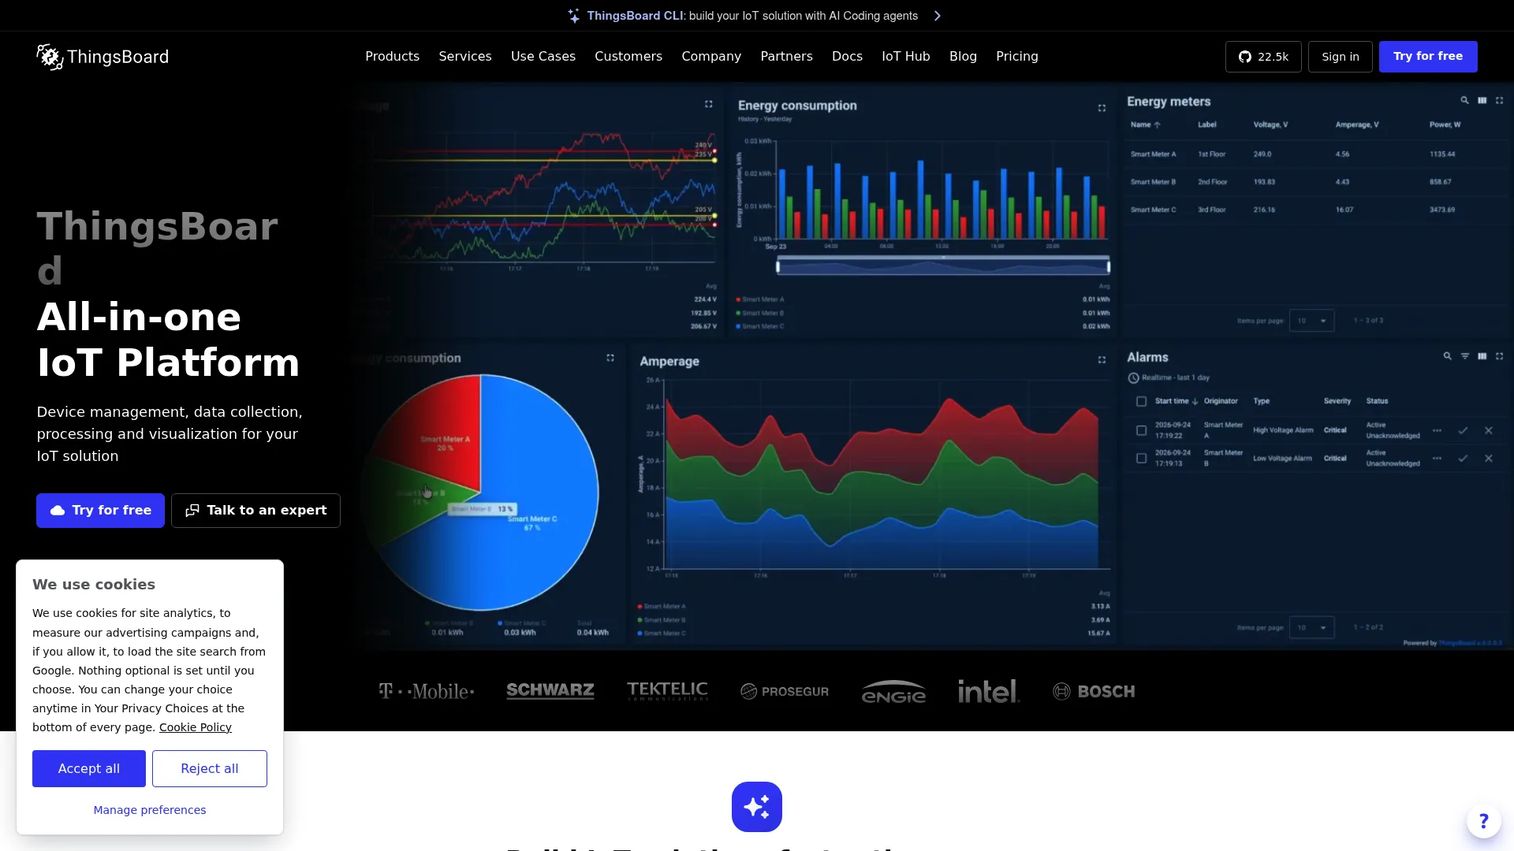
ThingsBoard is an open-source IoT platform covering device connectivity, data collection, telemetry processing, dashboards, a visual rules engine, and device management. Over 600 built-in widgets support customizable dashboards. Multi-tenancy with data isolation lets organizations serve multiple customers or business units from a single deployment. Deployment options include ThingsBoard Cloud, self-managed on any infrastructure, and edge deployments for offline or latency-sensitive environments. A perpetual self-managed license is also available for teams that want full deployment control without ongoing subscription costs.
Best for: Teams that want a flexible IoT platform with dashboards, a rules engine, device management, and deployment control in one package, without vendor lock-in.
Key features
- 600+ dashboard widgets with full customization
- Visual rules engine for server-side automation
- Multi-tenancy with customer-level data isolation
- Edge deployment for offline and latency-sensitive environments
- Community Edition (open-source) and Professional Edition options
Why choose ThingsBoard: Choose ThingsBoard when you need more than analytics: Dashboards, rules-based automation, device management, and the flexibility to deploy on your own infrastructure. It is especially useful when several teams or customers need different views of the same device data, and when vendor lock-in is a concern.
ThingsBoard pricing: A free cloud plan is available at $0 per month. Paid cloud plans start at $49 per month (Prototype), $99 per month (Pilot), $299 per month (Startup), and $499 per month (Business). A self-managed perpetual license starts at $4,999. ThingsBoard Community Edition is available as open-source at no charge.
G2 rating: 4.5/5 on G2.
12. Cumulocity IoT
Cumulocity IoT is an enterprise-grade industrial AIoT platform covering device lifecycle management, real-time streaming analytics, event processing, digital twin modeling, and dashboards. Cloud, edge, on-premises, and air-gapped deployment options give industrial organizations the flexibility to place analytics where operational constraints require it. Data lake integration and SQL querying support teams that want to connect device data to broader analytics or business intelligence environments. The platform targets industrial organizations building connected-asset monitoring, predictive maintenance, and operational decisioning at scale.
Best for: Enterprise and industrial teams running connected assets at scale who need analytics, device management, and deployment flexibility in one platform.
Key features
- Device integration and lifecycle management
- Real-time streaming analytics and event processing
- Digital twin and asset hierarchy management
- Dashboards and data visualization
- Cloud, edge, on-premises, and air-gapped deployment
Why choose Cumulocity IoT: Choose Cumulocity when industrial IoT analytics must connect device data, operational workflows, and enterprise-scale deployment requirements. For PMs, it is strongest when reliability, governance, and multi-deployment-model flexibility matter as much as dashboards.
Cumulocity IoT pricing: The Starter plan begins at €215 per month billed annually and supports up to 2.5 million platform messages per month with one tenant. Business, Enterprise, Connected (single-node on-premises), and Air-Gapped plans use custom pricing through sales.
G2 rating: 4.3/5 on G2.
Considerations when choosing an IoT analytics platform
Start with the data you already trust
Platform choice depends on instrumentation quality. If your device events use inconsistent schemas, broken timestamps, or missing device identifiers, the platform will surface that inconsistency in every dashboard and alert. Establish schema consistency, event naming conventions, and missing-data handling rules before evaluating vendors.
Decide where analytics should run
Edge analytics matters when latency, bandwidth, privacy, or offline operation constraints are high. A factory floor with unreliable connectivity needs local processing. Cloud analytics works best when cross-team access, long-term storage, and cross-device aggregation matter more than millisecond latency. Hybrid architectures split workloads across both layers.
Check alert quality before dashboard polish
Alert fatigue is the most common failure mode in IoT monitoring deployments. Threshold-based alerts that fire constantly stop getting actioned. Before finalizing a platform, evaluate whether it supports anomaly detection, escalation rules, alert ownership assignment, and suppression logic. Alerts must create action, not noise.
Match the platform to team ownership
Engineering-led teams can operate cloud-native stacks with significant configuration flexibility. Operations-led teams often need packaged workflows and pre-built connectors. Data teams typically prioritize pipeline access and model integration. Product teams need metrics tied to activation, reliability, and retention. Picking a platform optimized for the wrong owner creates adoption risk.
Verify security and governance early
Evaluate RBAC, SSO, audit logs, tenant separation, data residency, and retention policies before a security review blocks deployment. Industrial deployments often require compliance with sector-specific frameworks. Confirm platform capabilities against your organization's security requirements rather than assuming coverage. Consult your own security and legal teams on regulatory obligations.
Conclusion
The decision framework here is simple: Choose the platform by decision workflow, not by dashboard count.
Mitti fits operations teams where sensor readings must trigger field action. AWS IoT Analytics suits engineering teams building custom pipelines on AWS. Azure's IoT stack belongs to organizations where Power BI and Microsoft identity govern everything. ThingSpeak is the fastest path to validating sensor flows before committing to production infrastructure. ThingsBoard gives teams deployment control and open-source flexibility with a full feature set. Cumulocity IoT covers industrial-scale connected-asset analytics with cloud and edge deployment options.
Before shortlisting, answer four questions: What data does your team trust today? Where does analytics need to run? Who owns the alerts after they fire? Which workflows happen after an insight appears?
The platforms that fail are not technically weak. They fail because the team that chose them did not own the instrumentation, the alerts, or the operational response. Pick the platform your team will actually maintain.
For further reading on analytics and operational decisioning, explore our guides to predictive analytics software and data visualization tools.
FAQs
An IoT analytics platform collects telemetry from connected devices, processes and analyzes that data, visualizes it in dashboards, fires alerts based on thresholds or anomalies, and routes insights to the teams that make operational decisions. The goal is to turn raw device data into reliable signals for maintenance, product, and operations workflows.
A broader IoT platform typically includes device connectivity, lifecycle management, application building, and workflow tools in addition to analytics. An IoT analytics platform focuses on the data-to-insight-to-action layer specifically. The distinction matters less in practice because most vendors bundle both, but knowing which capability you are buying helps avoid paying for device management you already have or analytics depth you do not yet need.
The right choice depends on asset type, telemetry quality, and deployment constraints. Cumulocity IoT and ThingsBoard are strong fits for industrial connected-asset scenarios. AWS IoT Analytics suits teams that want to build custom ML models on telemetry pipelines. Mitti fits operations teams where predictive insights must connect to maintenance workflows and field teams. No platform produces useful predictions without clean, consistent telemetry as an input.
Not always. Edge analytics matters when latency is critical, bandwidth to the cloud is limited, privacy rules restrict data leaving a facility, or operations must continue during cloud outages. For less time-sensitive monitoring where connectivity is reliable and data can travel to the cloud, a cloud-only analytics layer is sufficient. Evaluate your operational constraints before adding edge complexity.
Focus on decision quality, not feature count. Evaluate whether the platform matches your current instrumentation maturity, who will own alerts after deployment, how the tool integrates with existing CRM, ticketing, and business intelligence systems, what the total cost looks like at your device scale and message volume, and whether the security review will pass. Tie every selection criterion back to PM metrics: Reliability, support volume, adoption, and operational efficiency.
Pricing models vary significantly. AWS and Azure charge on usage: Messages processed, data stored, and queries run. ThingsBoard Cloud starts at $49 per month. Ubidots starts at $99 per month. SensorCloud starts at $35 per month. Mitti starts at $24 per seat per month. Cumulocity IoT starts at €215 per month. Oracle and Cisco price through sales with no self-serve rates. Model your cost against expected message frequency, data retention period, team size, and the integrations your workflow requires.
Yes. Most platforms covered here support real-time or near-real-time alerting. Alert mechanisms vary: Some use simple threshold rules, others run visual rules engines, anomaly detection models, or machine learning-based pattern recognition. The more important question is not whether a platform supports alerts, but who owns the alert, what action it triggers, and how suppression and escalation work. Alert volume without ownership leads to fatigue and ignored notifications.
The specific data collected depends on your sensors, gateways, firmware, and product instrumentation. Common telemetry types include temperature, vibration, pressure, location, battery level, connectivity status, device uptime, utilization metrics, error codes, and cycle counts. Platforms ingest this data through MQTT, HTTP, industrial protocols like OPC UA or Modbus, or direct API integrations. The quality of what you can analyze is determined by how well you instrument your devices upstream, not by the platform itself.