

You ran the same onboarding walkthrough four times this week. Three of those customers asked the same question you answered during the walkthrough. The fourth went dark after the kickoff call and hasn't logged in since.
You know the pattern. Static documentation goes unread. Loom videos get skimmed. Live walkthroughs don't scale, and every new stakeholder on the customer side means another 30 minutes on your calendar. The problem isn't that customers lack access to information. It's that the format doesn't match how people actually learn software: by clicking through it themselves.
According to research on interactive content, active participation yields 75% information retention compared to 5% for passive formats like lectures and videos. That gap explains why your help center articles aren't moving the needle on adoption.
This guide covers the specific interactive demo best practices that CS teams use to drive adoption, reduce support tickets, and compress time-to-value, with concrete benchmarks, a step-by-step creation process, and a measurement framework tied to the KPIs your VP of CS actually cares about.
What's inside
This guide covers 12 interactive demo best practices specifically for customer success teams, with guidance on when to use each demo format, a step-by-step creation process, a measurement framework tied to CS KPIs, and concrete benchmarks. Practices were selected based on patterns from CS teams that measurably improved onboarding completion, reduced ticket volume, and increased feature adoption. This is not generic demo advice borrowed from sales playbooks. It's built for CSMs, onboarding managers, and CS team leads managing a book of accounts.
TL;DR
- Interactive product demos outperform static docs and video walkthroughs for customer education because they require active participation, driving 75% retention versus 5% for passive formats.
- The highest-performing CS demos focus on one workflow, stay between 5 and 8 steps, and are personalized by customer segment.
- Demo analytics tied to CS KPIs (completion rate, feature adoption, ticket volume) give you data to prove CS ROI to leadership.
- Building a demo library organized by use case and customer tier lets you serve 50 accounts the way you used to serve 15.
- Guideflow lets CS teams capture product flows in minutes and track engagement at the session level.
- Start with one workflow, one demo, and one week of data. The teams that scale fastest started small.
What is an interactive demo (and why CSMs should care)
An interactive demo is a guided, clickable replica of your product that lets users experience real workflows without logging in, setting up an account, or joining a live call. Also called an interactive product demo, product tour, or interactive demonstration, it captures the actual screens and interactions of your product and turns them into a self-serve experience anyone can click through on their own time.
Here's how that differs from the formats you're probably using today:
Help center articles and docs. Customers read (or more often, skim) but don't retain. You get page views as a signal, which tells you someone landed on the page. It tells you nothing about whether they understood the workflow.
Loom and video walkthroughs. Passive viewing. You can see watch time, but you can't tell whether the customer understood what to do next. And they can't practice the workflow inside the video.
Live onboarding calls. High-touch, don't scale, and require scheduling coordination across time zones. You're spending 30 to 45 minutes per account on walkthroughs you've delivered dozens of times.
Interactive demos. Active, self-serve, and trackable at the step level. The customer clicks through the actual workflow, and you see exactly where they completed, where they paused, and where they dropped off.
| Format | Engagement model | Scales across accounts | Tracks understanding | CSM time per account |
|---|---|---|---|---|
| Help center article | Passive reading | Yes | Page views only | Low |
| Loom video | Passive watching | Yes | Watch time only | Low |
| Live walkthrough | Active, 1:1 | No | Verbal confirmation | High |
| Interactive demo | Active, self-serve | Yes | Step-by-step analytics | Minimal |
Why does this matter for CSMs specifically? Three reasons.

First, interactive demos let customers learn by doing, which improves retention of the information. The gap between passive and active learning isn't marginal. It's the difference between a customer who can describe a feature and one who can use it.
Second, they scale across your entire book of accounts. You create one demo for a workflow, and every customer in onboarding can use it on their own schedule. No calendar coordination. No repeated walkthroughs.
Third, they generate engagement data that tells you who completed the workflow and who dropped off. That's a signal you can act on before the customer goes silent. A customer who completed 3 of 7 onboarding demos is a different conversation than one who completed all 7.
When to use interactive demos in customer success
Every piece of advice about interactive product demos focuses on sales and marketing. But the CS use cases are where the format delivers the most compounding value, because you're serving the same accounts over months and years, not one-time prospects.

Onboarding and first-value delivery
New customer just signed. You need them to complete setup and reach their first meaningful outcome within 30 days. Interactive demos guide them through the exact steps (connect your CRM, invite team members, create your first report) on their own schedule, without requiring a live call.
The onboarding CSM managing 40+ accounts simultaneously can't run a live walkthrough for each one. An interactive demo covering "How to complete initial setup" lets every new account start immediately, and the CSM gets completion data showing who's progressing and who needs a nudge. If you're evaluating tools to streamline this process, explore the best user onboarding software tools available today.
Feature education and adoption campaigns
Customers are paying for features they don't use. A changelog email announcing "New: Automated Reports" gets opened and forgotten. An interactive demo showing the specific workflow ("How to set up your first automated report in 3 minutes") drives deeper adoption because the customer practices the workflow instead of reading about it. Learn more about how to boost product adoption with interactive demos.
Support deflection and self-service
Your top 10 support tickets are the same questions every month. An interactive demo embedded directly in the relevant help center article answers those questions before they become tickets. The customer clicks through the workflow instead of submitting a ticket and waiting for a response.
- Identify your 5 most common support tickets
- Build an interactive demo for each workflow
- Embed the demo in the corresponding help center article
- Track ticket volume on those specific topics
New stakeholder onboarding
A new VP joins the customer side. Instead of re-running a full onboarding call, send a personalized interactive demo that covers the executive-level workflows. The customer's new stakeholder gets up to speed without consuming CSM time, and you get data showing they completed the walkthrough.
QBR preparation and expansion enablement
Before a QBR, send an interactive demo showcasing the features the customer hasn't adopted yet. During the QBR, use engagement data ("your team spent 6 minutes exploring the reporting module and completed all 5 steps") to open expansion conversations with evidence, not assumptions.
Pro tip: Pair the demo with a specific question in the QBR: "Your team completed the advanced reporting walkthrough. What would it take to roll that out to the rest of the team?" This turns demo engagement into a concrete expansion conversation.
Renewal risk mitigation
An account shows declining usage as a churn predictor. Send a targeted interactive demo focused on the workflows that originally drove their purchase decision. Track whether they engage. If they do, you have a re-engagement signal and a reason to schedule a call. If they don't, you have an early warning that this account needs immediate attention.
Key principles behind high-performing CS demos
Before diving into the tactical best practices, here are the four principles that separate demos with 70%+ completion from ones that get ignored. These are the "why" behind every demo tip that follows.
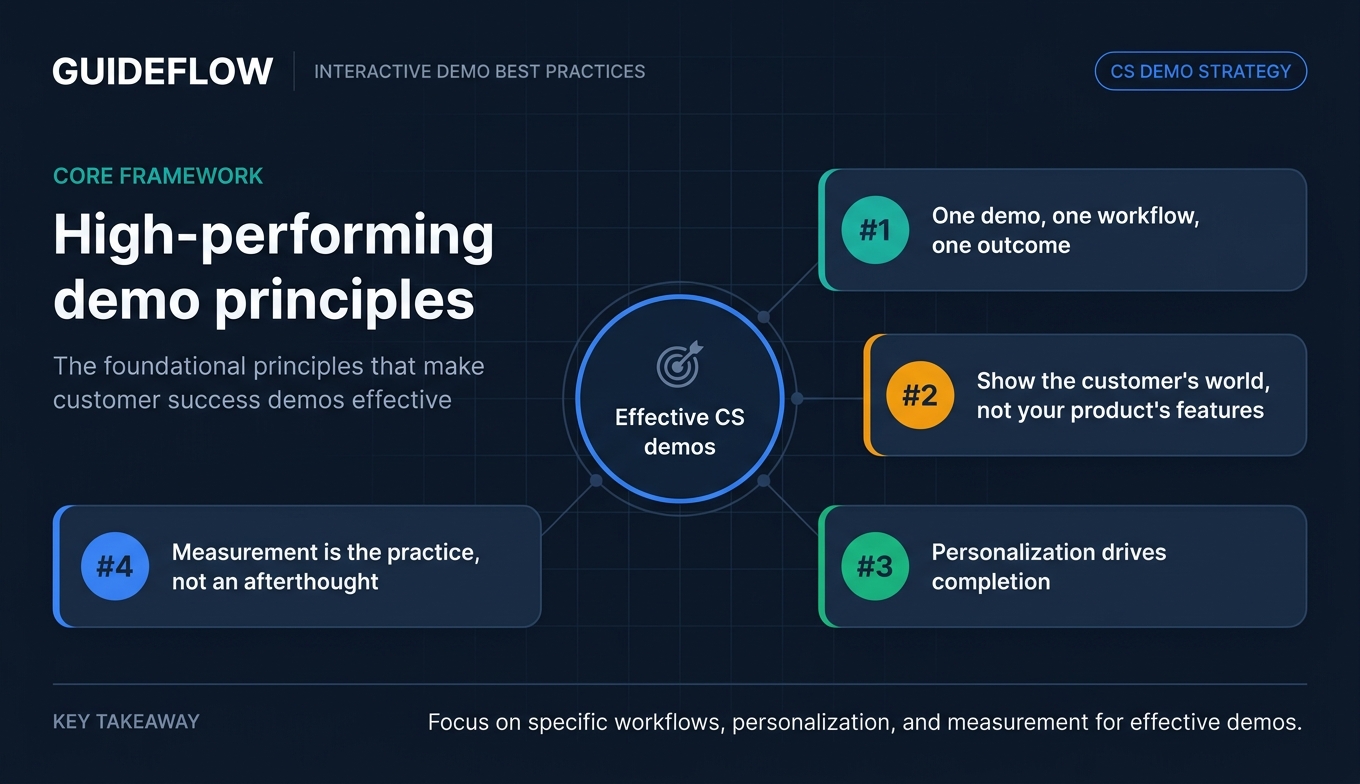
1. One demo, one workflow, one outcome
The highest-completion demos focus on a single task the customer needs to accomplish. Trying to cover "everything the product does" in one demo creates cognitive overload and drives drop-off. Data from interactive demo platforms shows that flows with 1 to 6 steps achieve the highest completion rates, and completion drops as step count increases beyond that range.
Application: Instead of "Complete product overview," create "How to set up your first automated report" or "How to invite team members and assign roles." Each demo should have one clear outcome the customer achieves by the end.
2. Show the customer's world, not your product's features
Effective product demos are framed around what the customer is trying to achieve, not what buttons to click. The demo title, tooltip copy, and CTA should use the customer's language and reference their specific use case.
Application: Instead of "Click the integrations tab," use "Connect your CRM so new contacts sync automatically." The action is the same. The framing tells the customer why it matters to them.
3. Personalization drives completion
Demos personalized with the customer's company name, data, or use case see materially higher completion rates than generic versions. Even light personalization (swapping a company name into the demo header) signals "this was made for you." Interactive content with contextual personalization generates 2x more conversions than static, non-personalized content.
Application: Use dynamic variables to insert the customer's company name, industry-specific terminology, or role-specific workflows. With Guideflow's personalize feature, you can personalize text, images, and data inside your interactive demo for each customer segment in minutes, using a no-code editor.
4. Measurement is the practice, not an afterthought
The best CS teams treat demo analytics as a core part of their workflow, not a reporting exercise. Completion rates, drop-off points, and time-per-step tell you exactly where customers get stuck, which features resonate, and which accounts need attention.
Application: Review demo analytics weekly alongside your account health dashboard. A customer who completed 3 of 7 onboarding demos is showing a different signal than one who completed all 7. Feed that data into your health scoring model, and you have an early warning system that runs on actual behavior, not gut feel.
How to create an interactive demo for customer success (step-by-step)
Here's the process CS teams follow to go from "I should build a demo" to "I have a live demo with data coming in." Six steps, each with a specific output.

Step 1. Identify the workflow your customers need most
Start with your top 5 support tickets or the most common onboarding friction point. The first demo you build should address the single workflow that generates the most repetitive CSM effort. Ask your support team: "What are the 5 questions you answer most often?" Pick the one that comes up across the most accounts.
Output: A one-sentence description of the workflow (e.g., "Setting up the Slack integration for real-time alerts").
Step 2. Map the steps from the customer's perspective
Walk through the workflow yourself, but annotate each step with what the customer needs to understand, not just what they need to click. Note where customers typically get confused (ask your support team for the common follow-up questions on this topic).
Keep the step count between 5 and 8. If the workflow requires more steps, split it into two demos with a clear handoff between them.
Output: A numbered list of 5 to 8 steps with annotations on "what the customer needs to know here."
Step 3. Capture the product flow
Use your demo tool to record the workflow. With Guideflow's capture feature, you capture your product flow directly from your browser in a few clicks. Follow the flow as you would normally, hit Finish, and the step-by-step interactive guide is generated automatically. Use realistic but anonymized data in the capture so the demo looks credible without exposing sensitive information.
Output: A raw captured demo ready for editing.
Step 4. Edit for clarity and brevity
Remove unnecessary steps. Add tooltips that explain "why," not just "what." Customize the branding (colors, logo) to match your company. Replace any sensitive data. Add a clear CTA at the end (e.g., "Ready to try this in your account? Log in here.").
Guideflow's editor lets you add notes, apply branding, customize text, images, and graphs, and collaborate with your team. AI features can auto-adjust steps, popups, and translations, so you publish a polished experience without manual fine-tuning.
Output: A polished, branded demo ready for personalization.
Step 5. Personalize by customer segment
Create variants for your key segments. At minimum, personalize by:
- Customer tier (SMB vs. enterprise): different complexity levels, different feature emphasis
- Lifecycle stage (onboarding vs. mature): different starting points, different goals
- Stakeholder role (admin vs. end user): different workflows, different language
Use dynamic variables for company name and industry-specific language. With Guideflow, you personalize content at scale using a rich no-code editor, editing text, images, and graphs, and hiding or adjusting elements per segment.
Output: 2 to 3 personalized variants of the demo.
Step 6. Distribute, measure, and iterate
Share via the channel your customers already use: embed in your help center, send in onboarding emails, drop into Slack channels, or include in QBR prep materials. Then track completion rates, drop-off points, and time-per-step. Review weekly.
If a step has a high drop-off, simplify it or add a clearer tooltip. If completion is below 50%, the demo is likely too long or not targeted enough. Shorten it or narrow the workflow focus.
Output: A live demo with a weekly review cadence.
Benchmark: CS teams typically see 60 to 80% completion rates on well-targeted onboarding demos. If you're below 50%, shorten the demo or narrow the workflow focus. Top-performing demos (top 1%) reach near-100% completion among engaged users.
12 interactive demo best practices for customer success
These are the specific, actionable demo best practices that CS teams use to drive results. Each one is grounded in CS-specific use cases, not generic sales advice.
1. Keep demos between 5 and 8 steps
Data from interactive demo platforms shows that flows with fewer steps achieve materially higher completion rates. Demos with 1 to 6 steps see the highest completion; beyond 10 steps, completion drops significantly. If the workflow requires more than 8 steps, split it into two demos with a clear transition between them.
Customers abandon long demos the same way they abandon long help articles. Respect their time, and they'll complete the workflow.
2. Start with the outcome, not the setup
The first screen of the demo should show the end result: the completed report, the configured dashboard, the sent notification. Then walk backward through how to get there. This hooks the customer with "what's in it for me" before asking them to invest attention.
Example: Instead of starting with "Step 1: Navigate to Settings," start with "Here's what your automated weekly report will look like. Let's set it up."
3. Write tooltip copy in the customer's language
Avoid internal product jargon. Use the words your customers use in support tickets and calls. "Set up your weekly summary email" is clearer than "Configure notification preferences in the settings module."
Review your last 20 support tickets for the exact phrases customers use. Mirror that language in your demo tooltips.
4. Use chapter breaks for multi-section workflows
If a workflow has distinct phases (e.g., setup, configuration, testing), use chapter breaks so customers can resume where they left off. This is critical for onboarding demos that customers complete across multiple sessions.
Research shows that demos with intro chapters gain 72% higher play rates. Chapters also give you more granular analytics on where customers pause and return.
5. Personalize with the customer's company name and data
Even basic personalization (company name in the demo header, industry-specific example data) signals that this content was created for them, not copied from a generic library. Interactive content with personalization generates 2x more conversions than static, non-personalized content.
With Guideflow, dynamic variables pull data from your CRM to insert company names, industry terminology, and role-specific details automatically. Personalization takes minutes and scales across your entire book of accounts.
6. Build a demo library organized by use case, not by feature
Organize your demos around what customers are trying to do ("Set up integrations," "Invite your team," "Create your first report"), not around your product's feature taxonomy ("Integrations module," "User management," "Reporting"). Learn how to build an interactive demo library that boosts product understanding across your organization.
Customers think in workflows, not in product architecture. A demo center organized by use case lets customers self-select the workflow they need and complete it independently.
7. Embed demos where customers already look for help
Don't create a separate demo portal that customers have to find. Embed interactive demos directly in your help center articles, onboarding emails, in-app tooltips, and Slack messages. The demo should meet the customer where they already are.
- Help center: Embed the demo in the article that covers the same topic
- Onboarding emails: Include a direct link to the relevant workflow demo
- Slack: Drop the demo link in the customer's shared channel
- QBR prep: Send the demo in your pre-QBR email
8. Segment demos by customer lifecycle stage
An onboarding customer needs "How to complete initial setup." A 6-month customer needs "How to use advanced reporting." A renewal-risk customer needs "How to get value from the features you're already paying for."
One demo library serving all three stages will see lower engagement than segmented content. Create clear categories: Onboarding, Adoption, Advanced, and Re-engagement.
9. Add a clear CTA at the end of every demo
Every demo should end with a specific next action: "Log in and try this now," "Book a call with your CSM to discuss," or "Explore the next workflow." A demo that ends without direction wastes the momentum you just built.
Match the CTA to the lifecycle stage. Onboarding demos should push toward "try it in your account." Expansion demos should push toward "talk to your CSM about adding this for your team."
10. Use demo analytics to identify at-risk accounts
A customer who completed 1 of 5 onboarding demos is showing a different signal than one who completed all 5. Use completion data as an input to your health score. Low demo engagement during onboarding is an early warning that the account may not reach first value. Guideflow's analytics give you session-level detail to power these insights.
Set up alerts: if an account hasn't engaged with any onboarding demos within 7 days of kickoff, that's a trigger for a proactive outreach.
11. Share engagement data in QBRs and renewal conversations
"Your team completed 12 interactive walkthroughs this quarter, with 89% completion on the reporting setup guide" is a concrete proof point in a QBR. It shows the customer is actively engaging with the product and gives you data to anchor the conversation.
This also works in renewal conversations. "Your team used 47 interactive guides this year" is a stronger retention argument than "we hope you're finding value."
12. Update demos when the product changes, not quarterly
A demo that shows an outdated UI erodes trust instantly. Update demos when the product ships changes, not on a fixed schedule. With no-code capture tools like Guideflow, re-recording a flow takes minutes. You capture the updated screens, and the guide refreshes automatically.
Tie demo updates to your product release cycle. When the product team ships a UI change, the CS team re-captures the affected demos the same day.
Common mistakes CS teams make with interactive demos
These are the patterns that show up most often when CS teams start building demos. Each one has a specific fix tied to the best practices above.
Building a "complete product tour" instead of targeted workflows
The pattern: A CSM creates one massive 20-step demo that covers "everything." Completion sits at 23%. Customers drop off after step 6 because they came for one specific workflow and got a product encyclopedia.
The fix: Break it into 4 to 5 targeted demos of 5 to 8 steps each, organized by use case. After splitting into focused workflows, completion typically jumps to 60%+ per demo. Reference best practices #1 and #6.
Using generic demos for every customer segment
The pattern: The same onboarding demo is sent to a 5-person startup and a 500-person enterprise account. The startup finds it too complex; the enterprise finds it too basic. Engagement is middling across both.
The fix: Create 2 to 3 segment-specific variants. An SMB demo focuses on quick setup and core workflows. An enterprise demo covers admin configuration, team permissions, and integration setup. Reference best practices #5 and #8.
Treating demos as a "set it and forget it" asset
The pattern: A demo was created 6 months ago. The product UI has changed twice since then. Customers see outdated screens and lose confidence in the content.
The fix: Tie demo updates to your product release cycle. With Guideflow, re-capturing a flow takes minutes, so demos stay current automatically as your product evolves. Reference best practice #12.
Not connecting demo data to account health
The pattern: The CS team has demo analytics in one tool and health scores in another. Nobody connects the two. An account that hasn't engaged with any demos in 30 days doesn't trigger an alert.
The fix: Feed demo completion and engagement data into your health scoring model. Guideflow's analytics sync to CRM and Slack via integrations, so engagement signals flow into the systems you already use for account management. A customer who hasn't engaged with any demos in 30 days is showing a signal. Reference best practice #10.
Hiding demos behind a separate portal instead of embedding them
The pattern: The team builds a demo library but puts it on a standalone page that customers have to navigate to. Usage is low because customers don't know it exists.
The fix: Embed demos directly in help center articles, onboarding emails, and in-app messages. Guideflow supports embedding via public links, website embeds, email links, and more, so your demos meet customers wherever they already are. Reference best practice #7.
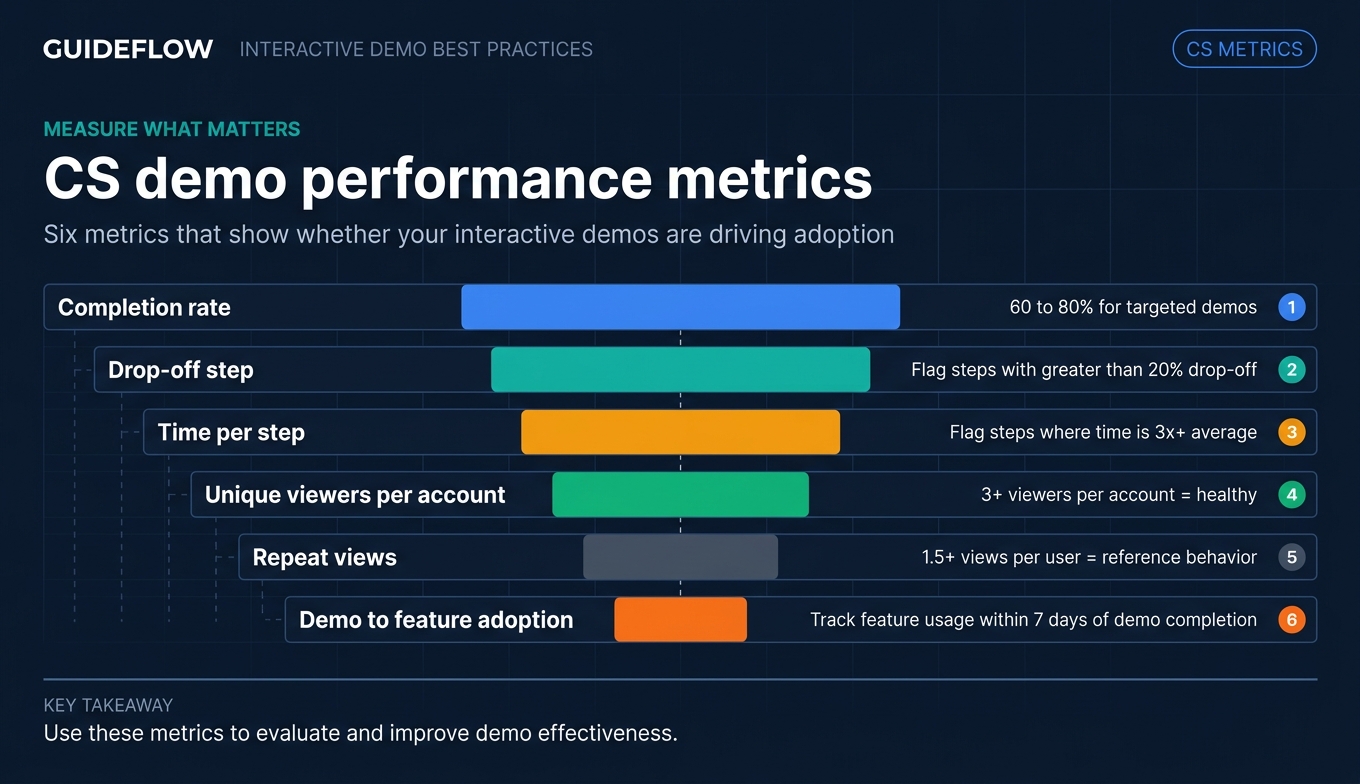
How to measure interactive demo performance (CS metrics that matter)
The metrics that matter for CS demos are different from sales demo metrics. Here's what to track, realistic benchmarks, and what the numbers mean for your accounts.
| Metric | What it tells you | CS KPI it maps to | Benchmark range |
|---|---|---|---|
| Completion rate | Are customers finishing the workflow? | Time-to-value, onboarding completion | 60 to 80% for targeted demos |
| Drop-off step | Where do customers get stuck? | Ticket volume (proactive fix) | Flag steps with >20% drop-off |
| Time per step | Which steps cause confusion? | Support complexity | Flag steps where time is 3x+ average |
| Unique viewers per account | Is the whole team engaging? | Product adoption breadth | 3+ viewers per account = healthy |
| Repeat views | Are customers referencing the demo? | Self-service success | 1.5+ views per user = reference behavior |
| Demo-to-feature adoption | Did the demo drive usage? | Feature adoption rate | Track feature usage within 7 days of demo completion |
How to interpret the data:
If completion is below 50%, the demo is likely too long or not targeted enough. Shorten it or narrow the workflow focus. If drop-off concentrates on one step, the tooltip copy or the workflow itself needs simplification. If unique viewers per account is low, the demo isn't reaching the right people, and distribution needs adjustment.
How to use this data in leadership conversations:
Demo engagement data gives you a concrete narrative for CS ROI. "Our onboarding demos had 74% completion this quarter, and accounts that completed all onboarding demos had 23% higher 90-day retention than accounts that didn't engage" is the kind of statement that earns budget. It connects interactive demo performance directly to the retention and adoption metrics your VP of CS reports on.
Guideflow's advanced analytics track impressions, completion rate, leads collected, and conversion in real time, with session-level detail that shows exactly what each customer explored. Data syncs to your CRM and Slack so it flows into your existing reporting workflow.
What to do next
Here are 5 specific actions you can take in the next 24 hours:
- Identify your top 3 repetitive onboarding workflows. Ask your support team: "What are the 5 questions you answer most often?" Pick the top 3 that apply to onboarding.
- Build your first interactive demo this week. Choose the single most repetitive workflow and capture it. With Guideflow, you capture your product flow from your browser in a few clicks and the guide is generated automatically. Aim for 5 to 8 steps.
- Send it to 5 customers in active onboarding. Don't wait for a perfect library. Ship one demo, track completion, and learn from the data.
- Review the analytics after 7 days. Check completion rate, drop-off points, and whether those 5 customers progressed further in onboarding than your average.
- Share the results with your VP of CS. Even preliminary data ("5 customers completed the demo, 4 of 5 reached first value within 10 days vs. our 21-day average") builds the case for expanding the program.
The CS teams that get the most from interactive demos didn't start with a 50-demo library. They started with one workflow, one demo, and one week of data. Start there.
Conclusion
Interactive demos give CS teams a way to scale customer education, reduce support load, and prove their impact with data, all without adding headcount. The practices in this guide are grounded in one pattern: the CS teams that drive the highest adoption and lowest churn are the ones that let customers learn by doing, not by reading.
The numbers back it up. Active participation drives 75% retention versus 5% for passive formats. Targeted demos see 60 to 80% completion. And the data from those demos feeds directly into the retention, adoption, and time-to-value metrics that justify CS investment.
Pick one workflow. Build one demo. Ship it this week. The data will tell you what to do next.
Start your journey with Guideflow today
FAQs
Interactive demos let customers walk through workflows themselves, answering the "how do I..." questions that generate the most tickets. When embedded in help center articles, they intercept the question before the customer opens a ticket. CS teams consistently see measurable ticket reduction on the specific workflows covered by demos. You can also build self-service experiences that further reduce support load.
5 to 8 steps focused on one workflow. Data from interactive demo platforms shows that flows with fewer steps achieve the highest completion rates, and completion drops significantly beyond 10 steps. If the workflow requires more steps, split it into multiple demos with chapter breaks.
Use dynamic variables to insert company name, industry-specific data, and role-specific workflows. Create 2 to 3 segment variants (e.g., SMB vs. enterprise, admin vs. end user) rather than one generic version. With Guideflow, personalization takes minutes using a no-code editor and scales across your entire book of accounts.
Yes. Interactive demos drive active engagement with specific features, compared to passive formats like docs or videos. Customers who complete a feature-specific demo are more likely to use that feature within 7 days, which directly improves adoption metrics. Interactive content generates 2x more conversions than static content.
Track completion rate, drop-off points, feature adoption after demo completion, and ticket volume on covered workflows. Map these to CS KPIs: time-to-value, support ticket reduction, and retention rate for accounts that engaged with demos vs. those that didn't. Present the data as: "Accounts that completed onboarding demos had X% higher retention."
Help center articles, onboarding email sequences, in-app tooltips, Slack messages, and QBR prep materials. The demo should meet customers where they already look for help, not require them to navigate to a separate portal. Guideflow supports sharing via public links, website embeds, email, Notion, and social platforms.
Update when the product UI changes, not on a fixed quarterly schedule. With no-code capture tools like Guideflow, re-recording a flow takes minutes, so demos stay current as your product evolves. Tie updates to your product release cycle for consistency.
The terms are often used interchangeably. An interactive demo typically refers to a self-serve, clickable replica of your product that users can experience without logging in. A product tour is often an in-app guided experience for users who are already logged in. Both serve customer education effectively, and many CS teams use both depending on the context: interactive demos for pre-login onboarding and support deflection, product tours for in-app feature guidance. Platforms like digital adoption platforms can complement interactive demos for in-app guidance.
.avif)
.avif)