You built the interactive demo. Embedded it on the landing page. Shared the link with Sales. Sent it to your Slack channel with a little party emoji.
Then you checked the numbers. Completion rate: 34%. The VP of Engineering on the buying committee dropped off at step 3. Your champion said it "looked great" but never forwarded it to the CFO. The demo is live. The pipeline impact is invisible.
This is the gap most PMMs are living in right now. You have interactive product demos. What you don't have is a system for making them convert. And the difference between "we have demos" and "our demos drive pipeline" is where the real work begins.
Here's what the data shows: teams that personalize their interactive demos and match them to specific personas and funnel stages see up to 32% higher conversion rates. Yet most teams still build one demo, paste it everywhere, and wonder why the numbers don't move.
This guide covers 12 specific, tested interactive demo best practices organized around the three phases that determine whether your demo drives revenue or just collects impressions: Build, Distribute, and Measure.
What's inside
- Build (practices 1 through 5): How to scope, script, structure, personalize, and optimize your interactive demos before they go live.
- Distribute (practices 6 through 9): Where and how to deploy demos across channels and funnel stages for maximum impact, including demo centers, gating strategy, and shareability.
- Measure and optimize (practices 10 through 12): The specific metrics, A/B testing frameworks, and feedback loops that connect demo engagement to pipeline outcomes.
Each practice includes what to do, why it matters for conversion, and a specific implementation detail. These are drawn from patterns across teams that have measurably improved demo performance.
TL;DR
- The single biggest driver of interactive demo performance is matching demo length and content to a specific persona and funnel stage. One demo for everyone is the most common optimization opportunity.
- Demo personalization (prospect name, company, industry data) drives materially higher completion rates than generic versions. Teams using Guideflow report up to +30% conversion rate lifts with personalized flows.
- Most teams measure impressions and clicks. The metrics that predict pipeline impact are completion rate by step, drop-off points, and downstream conversion (demo viewer to SQL).
- Distribution strategy matters as much as demo quality. The same demo performs differently on a landing page versus in a sales email versus embedded in a help center.
- Short, focused demos (5 to 8 steps for top-of-funnel, up to 15 for mid-funnel evaluation) consistently outperform longer flows. Data from analysis of 37,000 demos confirms: adding steps reduces completion.
- Interactive demos generate behavioral data (which features prospects explored, where they spent time) that static formats and recorded videos cannot provide. This is a fundamentally different engagement model.
What is an interactive demo (and why PMMs care in 2026)
An interactive demo is a clickable, self-guided replica of your product that lets prospects experience specific workflows without a live call, login, or sandbox environment. Viewers click through real screens, interact with UI elements, and follow guided paths at their own pace.
That's the definition. Here's why it matters for you specifically.
How interactive demos differ from static assets and live demos
The difference is not incremental. It's structural.
Interactive product demos deliver a fundamentally different engagement model. The viewer is doing, not watching. And every click generates behavioral data you can use to refine messaging, prioritize features, and inform Sales follow-up.
Why interactive demos are a PMM's highest-leverage asset
As a PMM, you're accountable for conversion, win rates, and pipeline influence, but you don't directly control the teams that execute. Interactive demos solve three of your hardest problems simultaneously.
Message consistency across touchpoints. The demo IS the message. It's not a description of the product filtered through a sales rep's interpretation or a static screenshot that's already outdated. Every stakeholder sees the same narrative, the same proof points, the same "aha moment."
Enablement adoption. Sales teams use interactive demos because they're easy to share and track. No scheduling, no prep, no SE dependency. When 18% of B2B SaaS websites now feature interactive demos (up 40% year-over-year), your buyers expect this format.
Measurable proof points. Demo analytics show exactly which features resonate, where prospects lose interest, and which value props drive action. For a PMM who needs defensible data to justify positioning decisions, this is behavioral research from real prospects, not survey responses.
12 interactive demo best practices that drive conversion

These 12 practices are organized into three groups:
- Build (1 through 5): What makes a demo worth clicking through
- Distribute (6 through 9): Where and how to deploy for maximum impact
- Measure and optimize (10 through 12): How to connect engagement to pipeline
Start with the group that matches your current bottleneck.
BUILD: Practices 1 through 5
1. Start with one persona and one use case, not "the whole product"
The instinct is to show everything. The feature tour. The admin settings. The reporting dashboard. The integrations page. You want the prospect to see how much your product can do.
The result is a demo that resonates with nobody.
Here's the pattern from teams that get this right: one demo, one persona, one job-to-be-done. A PMM at a Series B SaaS company building a demo for their landing page should target the primary ICP's top pain point, not a tour of every feature.
Data from an analysis of over 37,000 interactive demos confirms this: flows with 1 to 6 steps have the highest completion rates. The top 1% of demos have 16% fewer steps than the median. More steps, lower completion. Every time.
This connects directly to the segmentation work you've already done. Your ICP definition, your persona research, your positioning framework: these should drive demo scope. If you've identified three buyer personas, that's three demos, not one demo with three sections.
What to do first: Pick your highest-volume landing page. Identify the single persona that page targets. Build one demo that addresses their top pain point and leads to one clear "aha moment." Measure completion rate. Then expand.
2. Script the narrative before you capture a single screen
Most teams open the capture tool and start clicking through the product. That's backwards. The best interactive demos follow a story arc that mirrors the positioning framework you already use: problem, recognition, product intervention, outcome.
Here's the scripting process:
- Define the "aha moment" you're building toward. This is the single screen or interaction where the prospect thinks "this solves my problem." Everything else exists to get them there.
- Identify the 3 to 5 screens that create the path. Each screen should advance the narrative. If a screen doesn't move the prospect closer to the "aha moment," cut it.
- Write the tooltip and callout copy before capturing. This is where most teams skip. The copy in your tooltips is the narrative voice of the demo. It should follow the same structure as your positioning: name the pain, show the intervention, describe the outcome.
The first tells the prospect what to do. The second tells them why they should care.
Modern demo platforms include AI features that auto-generate step copy and CTAs, which speeds up the scripting phase. But AI works best when you've defined the narrative arc first. Start with the story. Let AI handle the polish.
This is the same narrative structure you use for positioning docs: situation, complication, resolution. The interactive demo is just the positioning doc in clickable form.
3. Keep demos short and focused (the step count framework)
"Keep it short" is not a product demo tip. It's a platitude. Here's a specific framework based on patterns from high-performing teams:
The data backs this up. One team had 23% completion with their original step count. After simplifying to three decision points, completion jumped to 61%. Another pattern from the top 10% of demos: they use 1.4x more branching paths and 1.2x more intro chapters, letting viewers choose their own path rather than forcing a linear flow.
The key insight: it's not just about fewer steps. It's about the right steps for the right context. A 15-step branching demo excels at mid-funnel evaluation where the prospect is actively comparing options. A 5-step focused demo drives the highest completion on a landing page where attention is scarce.
What to do first: Audit your existing demos. Check step count against the framework above. If your landing page demo has more than 8 steps, split it into a shorter top-of-funnel version and a deeper mid-funnel version.
4. Personalize beyond "Hi {first_name}"
This is the practice that separates demos that get clicks from demos that drive pipeline. And it's the one competitors barely touch.
Here's the personalization framework, organized by depth:
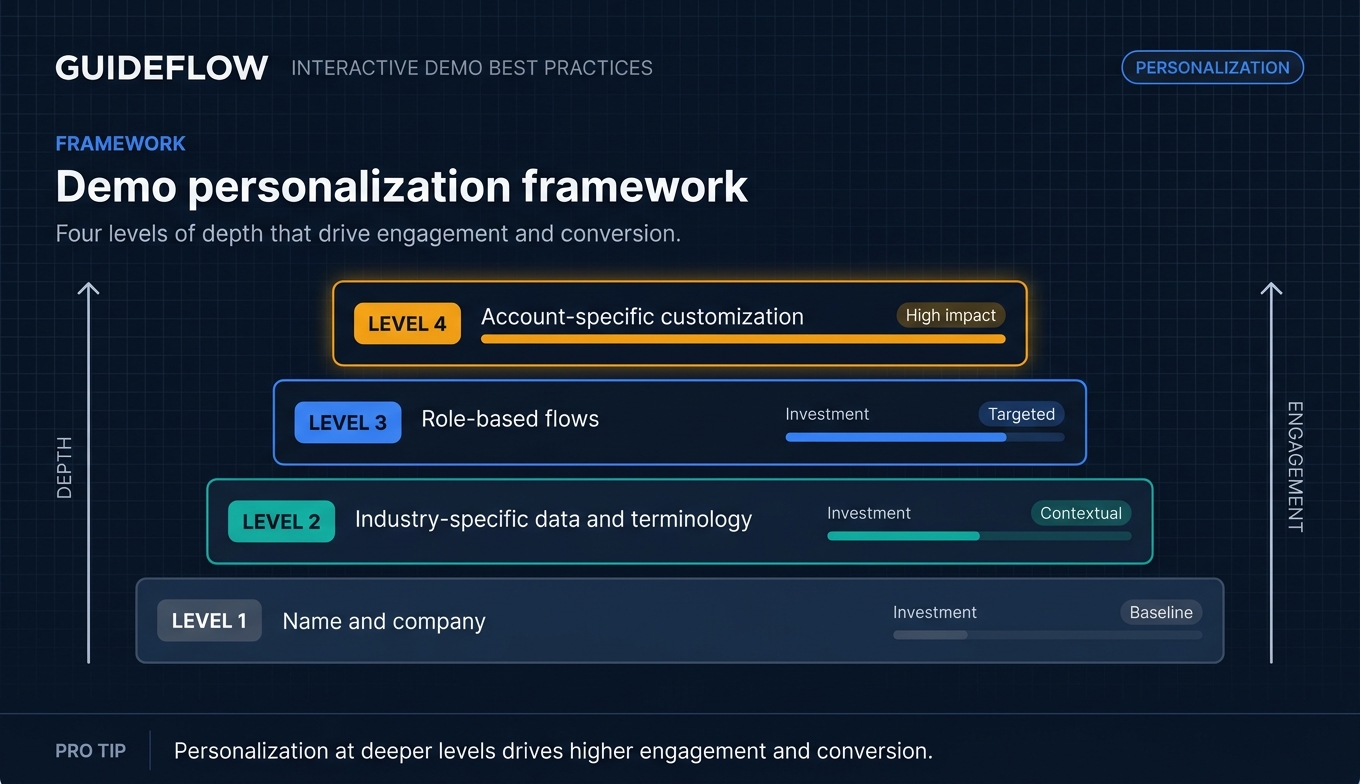
Level 1: Name and company. Table stakes. Better than generic, but not enough on its own. "Welcome, Sarah from Acme Corp" is a start.
Level 2: Industry-specific data and terminology. Show healthcare dashboards to healthcare prospects. Show e-commerce metrics to e-commerce buyers. Use their language, not yours.
Level 3: Role-based flows. The CFO sees ROI metrics and payback period. The end user sees daily workflow and time savings. The IT lead sees security configurations and compliance certifications. Same product, different narrative.
Level 4: Account-specific customization. Their logo, their data, their use case. This is the level that drives the highest engagement. A Series B SaaS company personalizing demos by industry vertical saw response rates increase from 8% to 23%. Explore how the best personalization software can support this approach at scale.
Personalization at scale requires a no-code editor with CRM-driven variables, not manual rebuilds for each account. With dynamic variables that pull data from your CRM or marketing automation system, you can personalize text, images, and graphs across dozens of demos in minutes.
What to do first: Start with Level 2. Pick your top three verticals. Create one demo template per vertical with industry-specific screenshots, terminology, and metrics. Measure completion rate against your generic version.
5. Design for mobile from the start
Your champion reviews the demo on their laptop. Then they forward it to the VP of Finance via Slack. The VP opens it on their phone during their commute.
If the demo breaks on mobile, the stakeholder who needed convincing never sees it. And buying committee members increasingly evaluate products outside traditional office hours, on mobile devices, during commutes, between meetings, and after dinner. This is why a dedicated mobile demo experience matters.
Here's how to optimize:
- Test every demo on mobile before publishing. This takes seconds with responsive capture methods but catches layout issues that kill engagement.
- Keep tooltip text short enough to read on small screens. If your callout copy wraps to four lines on mobile, rewrite it.
- Use responsive capture methods that automatically adjust to screen size.
- Consider mobile-specific demo versions for high-value use cases. If 30% of your demo views come from mobile (check your analytics), a mobile-optimized version is worth the minutes it takes to create.
The top 1% of interactive demos achieve 98% engagement rates on their first step. That number drops fast when the first step renders poorly on a phone.
DISTRIBUTE: Practices 6 through 9
6. Match the demo format to the channel and funnel stage
Building a great demo is half the work. The other half is putting it in the right place, in the right format, at the right moment. This is the distribution strategy that no one talks about.
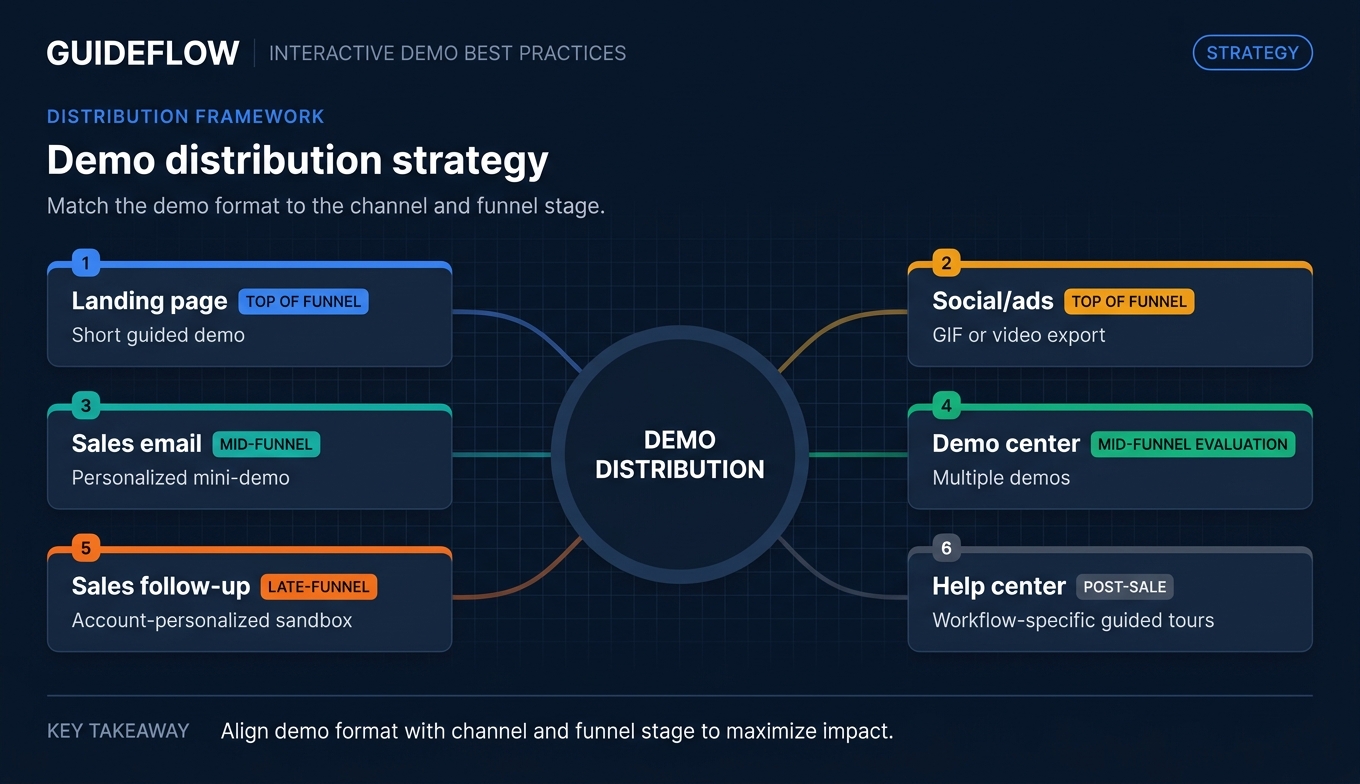
The same product flow performs differently depending on context. A 15-step demo that works in a demo center will lose attention in a cold email. A 3-step teaser that drives replies in outreach won't provide enough depth for a mid-funnel evaluator.
Your job as a PMM is to map demo assets to the buyer journey, not create one demo and paste it everywhere. The top-performing teams maintain a library of demos organized by channel and persona, each calibrated to the attention and intent level of that specific touchpoint.
What to do first: Map your current demos to this table. Identify gaps. If you have a landing page demo but nothing for sales outreach, that's your next build.
7. Build a demo center for multi-stakeholder deals
In B2B deals with 6 to 12 stakeholders, each person needs to evaluate the product on their own terms. The champion can't schedule separate live demos for the CFO, the CISO, the end users, and the VP of Engineering. And even if they could, that process adds weeks.
A demo center is a branded hub with multiple demos organized by role, use case, or product area. The champion shares one link. Five stakeholders explore in the same week, on their own schedules, instead of sequentially over five weeks.
Here's how to structure it:
- Organize by persona or use case, not by product feature. "For Finance Leaders" and "For End Users" resonates more than "Dashboard Module" and "API Configuration."
- Include conditional paths so visitors see relevant content first based on their role or interest.
- Track which stakeholders view which demos to inform Sales follow-up. When you can see that the CISO spent 8 minutes on the security configuration flow, you know exactly what to address in your next conversation.
Research shows 52% of top-performing demos appear on multiple website pages. Demo centers take this further by creating a dedicated destination that serves the entire buying committee from a single URL. See how teams use a demo showcase to bring this to life.
The evaluation timeline compresses because exploration happens asynchronously. That's the difference between a 4-week evaluation and a 10-week evaluation.
8. Gate strategically (not everything, not nothing)
The gating debate is real. Your demand gen team wants email captures. Your growth team wants maximum reach. Here's the data pattern that resolves it:
- Ungate: Landing page embeds, social shares, top-of-funnel awareness. Ungated demos achieve 5 to 12% higher completion and engagement rates than gated versions.
- Gate (light): Email capture after step 5 (let them see value first). This partial gating approach often outperforms both full gating and no gating because the viewer has already experienced enough value to justify sharing their information.
- Gate (full): Demo center access for mid-funnel evaluation (name, company, role). At this stage, the viewer has already shown intent by navigating to the demo center. The gate captures higher-quality leads.
The gating decision should match the conversion goal, not a blanket policy. Top-of-funnel demos earn attention by being accessible. Mid-funnel demos earn contact information by delivering depth. For more on optimizing this balance, explore best CRO tools that help you test and refine gating strategies.
What to do first: If all your demos are gated the same way, run a test. Take your highest-traffic landing page demo, remove the gate (or move it to after step 5), and measure completion rate and downstream conversion over two weeks.
9. Make demos shareable for internal champions
Your champion saw the demo. They liked it. Now they need to forward it to 7 other people on the buying committee. If the demo requires a login, a download, or a scheduled call, most of those 7 people will never see it.
The best demos travel through the buying committee without the seller's involvement, generating buying signals along the way. This is a core principle of buyer enablement. Here's the shareability checklist:
- Public links that work without authentication. No login walls. No "request access" friction. Click the link, see the demo.
- Embed options for Notion, email, and internal wikis. Champions share information in different formats. Meet them where they work.
- Presenter notes for Sales so they can walk stakeholders through the demo live when needed. The notes are invisible to the prospect but keep the rep on-message.
- Analytics that track each viewer. When the champion shares the link and three new stakeholders view it, Sales should see who explored what, without asking.
This connects directly to your enablement mandate. Sales teams adopt interactive demos because sharing a link is faster than scheduling a call. The demo becomes the enablement asset that actually gets used.
MEASURE AND OPTIMIZE: Practices 10 through 12
10. Track the metrics that actually predict conversion
Most teams track impressions and total views. Those are vanity metrics. Here are the numbers that connect demo engagement to pipeline outcomes:
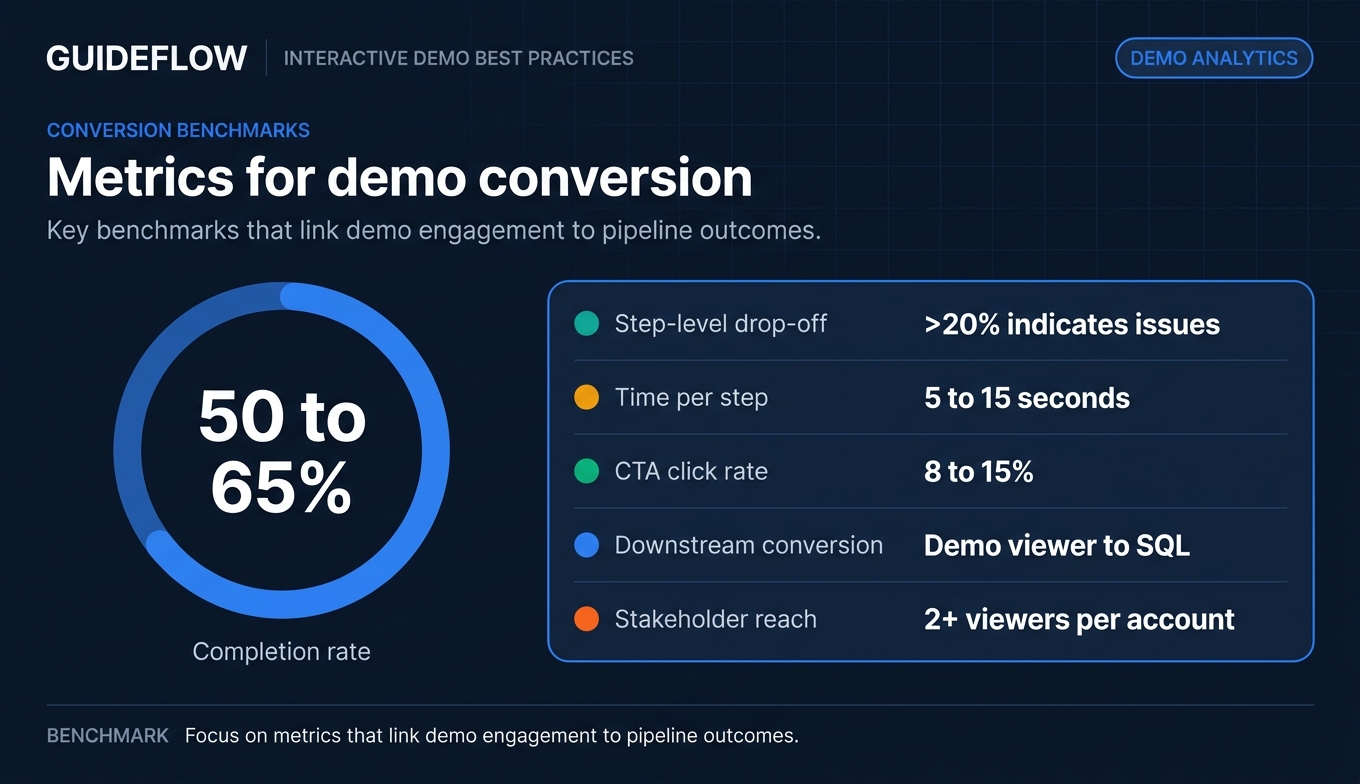
You've been burned by vanity metrics before. Demo analytics are only useful if they connect to pipeline outcomes, not just engagement scores.
Here's the reporting framework: track completion rate and drop-off weekly. Review downstream conversion monthly. Share step-level engagement data with Sales so they can tailor follow-up to what the prospect actually explored. The best product analytics software can help you connect demo engagement data to broader product usage insights.
This gives you something most PMMs lack: defensible proof points for leadership. Not "people viewed our demo" but "demo viewers convert to SQL at 2.3x the rate of non-viewers, and the security features demo drives the highest completion among enterprise prospects."
11. Run A/B tests on your demos (yes, really)
Interactive demos are testable assets, just like landing pages. Yet almost no one tests them. Here's what to test and how:
Variables worth testing:
- Step count: Does a 5-step version outperform an 8-step version for the same use case?
- Opening screen: Does leading with the "aha moment" versus leading with context change completion rates? (Data shows intro chapters boost play rate by 72%.)
- CTA placement: End-of-demo CTA versus mid-demo CTA versus persistent CTA.
- Personalization depth: Generic versus industry-specific versus account-specific.
Simple testing framework:
- Pick one variable.
- Create two versions (change only that variable).
- Split traffic or share different versions with comparable segments.
- Run for 2 weeks or 100+ views, whichever comes first.
- Measure completion rate and CTA click rate. Implement the winner. Test the next variable.
This is the same experimentation mindset you apply to landing pages and email campaigns. The difference: interactive demos generate richer engagement data per test because you can see exactly where behavior diverges, not just whether someone bounced.
What to do first: Take your highest-traffic demo. Create a version with a different opening screen (lead with the outcome instead of the setup). Run both for two weeks. Compare completion rates.
12. Build a feedback loop between demo analytics and product messaging
Demo analytics are not just for optimizing the demo. They're a signal source for your broader messaging strategy.
If prospects consistently drop off at the pricing configuration step, that's a messaging problem, not a demo problem. If the security features demo has 3x the completion rate of the integrations demo, that tells you which value prop resonates most with your ICP.
Here's the feedback loop:
- Review demo analytics monthly alongside pipeline data. Which demos correlate with faster deal progression? Which demos do champions share most?
- Share step-level engagement data with Product to inform roadmap priorities. If prospects spend 3x longer on the reporting workflow than the setup wizard, that's a signal about where value lives.
- Use demo completion patterns to refine ICP and segmentation. If healthcare prospects complete at 72% and fintech prospects complete at 38% on the same demo, your segmentation or your messaging for fintech needs work.
- Update positioning docs based on what buyers actually engage with versus what you assumed they'd care about.
This positions interactive demos as a research tool, not just a marketing asset. For a PMM who struggles with low-signal research and hard-to-validate messaging, demo analytics provide real behavioral data from real prospects, at scale, without scheduling a single interview.
How to build an interactive demo (step-by-step)
If you're ready to create your first interactive demo (or rebuild an existing one), here's the process:
Step 1. Define the goal and audience
One demo, one persona, one objective. Are you converting landing page visitors? Driving replies from sales outreach? Enabling mid-funnel evaluation? The answer determines everything that follows: step count, narrative, CTA, and distribution channel. Reference practice #1 above.
Step 2. Script the flow and write tooltip copy
Define your "aha moment." Map the 3 to 5 screens that get the viewer there. Write the tooltip copy before you capture anything. Follow the story arc: problem, product intervention, outcome. Reference practice #2.
Step 3. Capture your product screens
Open your product, follow the flow you scripted, and capture via browser extension. With platforms like Guideflow, you capture in a few clicks and the step-by-step interactive guide is generated automatically. AI auto-adjusts steps, popups, and translations so you can publish a polished demo the same day.
Step 4. Edit, personalize, and brand
Add your branding (colors, logo, fonts). Customize text and images. Set up personalization variables using CRM-driven data: company name, industry, role. Hide or blur sensitive information. Reference practice #4 for the personalization depth framework.
Step 5. Publish, distribute, and measure
Choose your distribution channels based on the channel/format mapping in practice #6. Set up analytics tracking. Establish a review cadence: weekly for completion rate and drop-off, monthly for downstream conversion. Reference practice #10 for the metrics framework.
Common mistakes that reduce interactive demo performance
These patterns show up in nearly every demo program audit. Each one is paired with the optimization that fixes it.
Building one demo for every audience
The "everything demo" tries to serve every persona, every use case, every funnel stage. It ends up resonating with none of them. Focused demos built for a single persona and use case drive materially higher completion rates. Build separate demos for the CFO (ROI metrics, payback period) and the end user (daily workflow, time savings). Reference practice #1.
Skipping the script and capturing on instinct
The capture-first, story-second approach leads to meandering flows with no clear narrative arc. Scripted demos with a defined "aha moment" and intentional tooltip copy consistently outperform ad-hoc captures. Write the story first. Capture second. Reference practice #2.
Measuring views instead of conversion
Impressions feel good but tell you nothing about pipeline impact. Track completion rate, step-level drop-off, and downstream SQL conversion. Connect demo engagement to revenue outcomes, not just activity metrics. Reference practice #10.
Gating every demo the same way
A blanket gating policy suppresses sharing and completion on top-of-funnel assets while under-qualifying mid-funnel leads. Match your gating strategy to the channel and funnel stage. Ungate for awareness. Gate lightly after demonstrating value. Gate fully for mid-funnel evaluation. Reference practice #8.
Ignoring mobile viewers
Buying committee members evaluate products on mobile devices, especially when a champion forwards a demo link via Slack or email. Test every demo on mobile before publishing. Keep tooltip text concise. Use responsive capture methods. Reference practice #5.
Interactive demo best practices checklist
Screenshot, bookmark, or paste this into your project management tool.
.svg)
Conclusion
Interactive demo best practices come down to three disciplines: build focused demos for specific personas and funnel stages, distribute them strategically across channels, and measure what actually connects to pipeline, not vanity metrics.
These 12 practices turn interactive demos from a marketing asset into a GTM system. A system that improves conversion, compresses evaluation timelines for multi-stakeholder deals, and gives you defensible data on which messages, segments, and value props actually perform.
The PMMs who treat their demo program with the same rigor they apply to positioning and launches are the ones who can walk into a leadership meeting with specific numbers: "Demo viewers convert to SQL at 2.3x the rate of non-viewers. The security features demo drives the highest engagement among enterprise prospects. Personalized demos increased outbound response rates from 8% to 23%."
That's the difference between having demos and having a demo program.
Start your journey with Guideflow today!