Your dashboards say everything is green. The customer says the app is down.
That gap is the problem enterprise monitoring software exists to close. Distributed systems generate more telemetry than any team can triage manually, yet most incidents still surface from end-user complaints rather than automated detection. According to New Relic (2025), high-impact IT outages carry a median annual cost of $76 million, and 68% of organizations report measurable improvements in mean time to detect after adopting observability tooling. The tools in this guide exist to shrink both numbers.
This comparison is written for technical evaluators: IT operations leaders, DevOps and SRE teams, network engineers, and presales professionals supporting enterprise monitoring evaluations. Use it to build a shortlist, map platforms to your environment, and go into vendor conversations with sharper questions.
What's inside
This guide compares 12 enterprise monitoring software platforms for 2026. Items were selected based on enterprise relevance, telemetry breadth, and recurring mentions across technical review sources.
Selection criteria:
- Telemetry coverage: Does the platform monitor infrastructure, networks, applications, logs, containers, and user experience?
- Enterprise scalability: Can it handle large, hybrid, or multi-cloud estates without architectural compromise?
- Alerting quality: Does it reduce noise and surface context, not just fire thresholds?
- Pricing clarity: Can you model costs before signing?
TL;DR
- Best overall for cloud-native observability: Datadog covers infrastructure, APM, logs, user experience, and security in one platform
- Best for AI-assisted enterprise observability: Dynatrace automates discovery, dependency mapping, and root cause analysis
- Best for network and hybrid IT teams: Paessler PRTG and SolarWinds Observability SaaS, depending on whether sensor-based or SaaS delivery fits your setup
- Best for dashboard-led observability: Grafana Enterprise suits teams already running Prometheus or OpenTelemetry
- Best for APM-first teams: New Relic and IBM Instana both offer strong application-centric telemetry
- Best open source control: Checkmk and Zabbix for teams comfortable owning their own deployment
What is enterprise monitoring software?
Enterprise monitoring software is a platform that tracks the health, performance, availability, and usage of large-scale IT systems across infrastructure, networks, applications, databases, cloud services, containers, and user-facing services.
It collects telemetry, meaning metrics, logs, traces, events, topology data, and user-experience signals, and uses that data to alert teams when systems degrade, help engineers troubleshoot incidents, support compliance reporting, and give operations leaders the visibility they need to plan capacity or brief executives.
The distinction from small-business monitoring tools is not just scale. Enterprise environments require governance across teams and regions, data volume that can reach millions of events per second, integrations with ITSM and security tooling, and the ability to monitor hybrid estates that span on-premises data centers, private cloud, and multiple public cloud providers simultaneously.
Key capabilities to evaluate in any enterprise monitoring platform:
- Infrastructure monitoring: Servers, VMs, containers, Kubernetes clusters, and cloud accounts
- Network monitoring: Devices, traffic, bandwidth, latency, and uptime across physical and virtual networks
- Application performance monitoring: Request tracing, error rates, latency, and service-level indicators
- Log management: Collection, indexing, search, and alerting on log data at scale
- Distributed tracing: End-to-end request visibility across microservices and service meshes
- Cloud and container monitoring: Native integration with AWS, Azure, GCP, Kubernetes, and Docker environments
- Alerting and escalation: Threshold-based, anomaly-based, and ML-assisted alerting with escalation routing
- Dashboards and topology maps: Real-time visualization of service dependencies and infrastructure state
- Root cause analysis: Automated or assisted investigation of incident origin
- Integrations: Connections to PagerDuty, ServiceNow, Jira, Slack, and CI/CD pipelines
- Governance and enterprise readiness: RBAC, SSO, audit logs, data residency, and retention controls
According to 451 Alliance (2025), 45% of organizations now use observability tools or platforms, up nearly 10 percentage points year over year, but only 15.8% of IT professionals describe their observability practice as mature (ManageEngine, 2025). That gap explains why tool selection still matters so much.
When to use enterprise monitoring software
Consolidate monitoring across hybrid infrastructure
Organizations running cloud workloads alongside on-premises servers, branch networks, containerized applications, and legacy systems generate fragmented telemetry by default. A team watching Kubernetes in one tool, network devices in another, and application traces in a third will always be slow to correlate during an incident. Enterprise monitoring platforms give teams a shared data model and a single alert surface across that whole estate.
Reduce alert noise during incidents
Alert fatigue is real. Thousands of thresholds firing during a cascade incident tell you nothing useful about where to look first. The strongest enterprise monitoring platforms layer in alert correlation, dependency context, and anomaly detection to surface which alerts represent root cause rather than downstream noise. Teams that invest in this capability see meaningful MTTR reductions.
Prove reliability during enterprise evaluation
Presales and solutions engineers supporting enterprise software evaluations frequently need to demonstrate reliability, integrations, and incident response workflows to skeptical buyers. A platform with topology maps, clear SLA dashboards, and audit-ready logs helps technical teams prove fit before procurement asks for pricing. Showing how a monitoring platform surfaces root cause during a simulated incident is often more persuasive than a slide deck.
Enterprise monitoring software comparison
The table below gives a fast orientation to each platform. Pricing and ratings are from verified vendor sources and G2 listings. Use this table to narrow the shortlist before reading the detailed sections.
| # | Product | Best for | Key differentiator | Pricing | G2 rating |
|---|---|---|---|---|---|
| 1 | Datadog | Cloud-native observability | Broad telemetry across infrastructure, APM, logs, RUM, and synthetics | From $15/host/month | 4.4/5 |
| 2 | Dynatrace | AI-assisted enterprise observability | Davis AI with automated discovery and root cause analysis | From $0.04/host-hour | 4.5/5 |
| 3 | SolarWinds Observability SaaS | Hybrid IT and network visibility | SaaS delivery across cloud-native and on-premises estates | From $5/GB/month | 4.3/5 |
| 4 | Grafana Enterprise | Dashboard-led observability | Enterprise governance for Grafana, Loki, Mimir, and Tempo | Custom pricing | N/A |
| 5 | Paessler PRTG | Network and infrastructure monitoring | Sensor-based monitoring for devices, traffic, servers, and services | From $200/month | 4.7/5 |
| 6 | ManageEngine OpManager | Network operations teams | Device monitoring, network mapping, and IT operations workflows | From $95 (10 devices) | 4.5/5 |
| 7 | LogicMonitor | SaaS-based hybrid monitoring | AIOps and broad integrations for enterprise IT | From $16/hybrid unit/month | 4.5/5 |
| 8 | New Relic | Full-stack observability for engineering teams | Unified APM, logs, infrastructure, traces, and user monitoring | From $10/month | 4.4/5 |
| 9 | Splunk Enterprise | Log-heavy enterprise monitoring | Powerful log search, indexing, and machine-data analysis | Custom pricing | 4.3/5 |
| 10 | IBM Instana | Application-centric observability | Automated APM and dependency mapping | From $0.03/MVS hour | 4.4/5 |
| 11 | Checkmk | Open source and self-hosted monitoring | Broad infrastructure monitoring with enterprise editions | From €190/month | N/A |
| 12 | Zabbix | Open source infrastructure monitoring | Flexible self-hosted monitoring with templates and community support | Free (support from €245/month) | 4.3/5 |
Best 12 enterprise monitoring software tools
1. Datadog
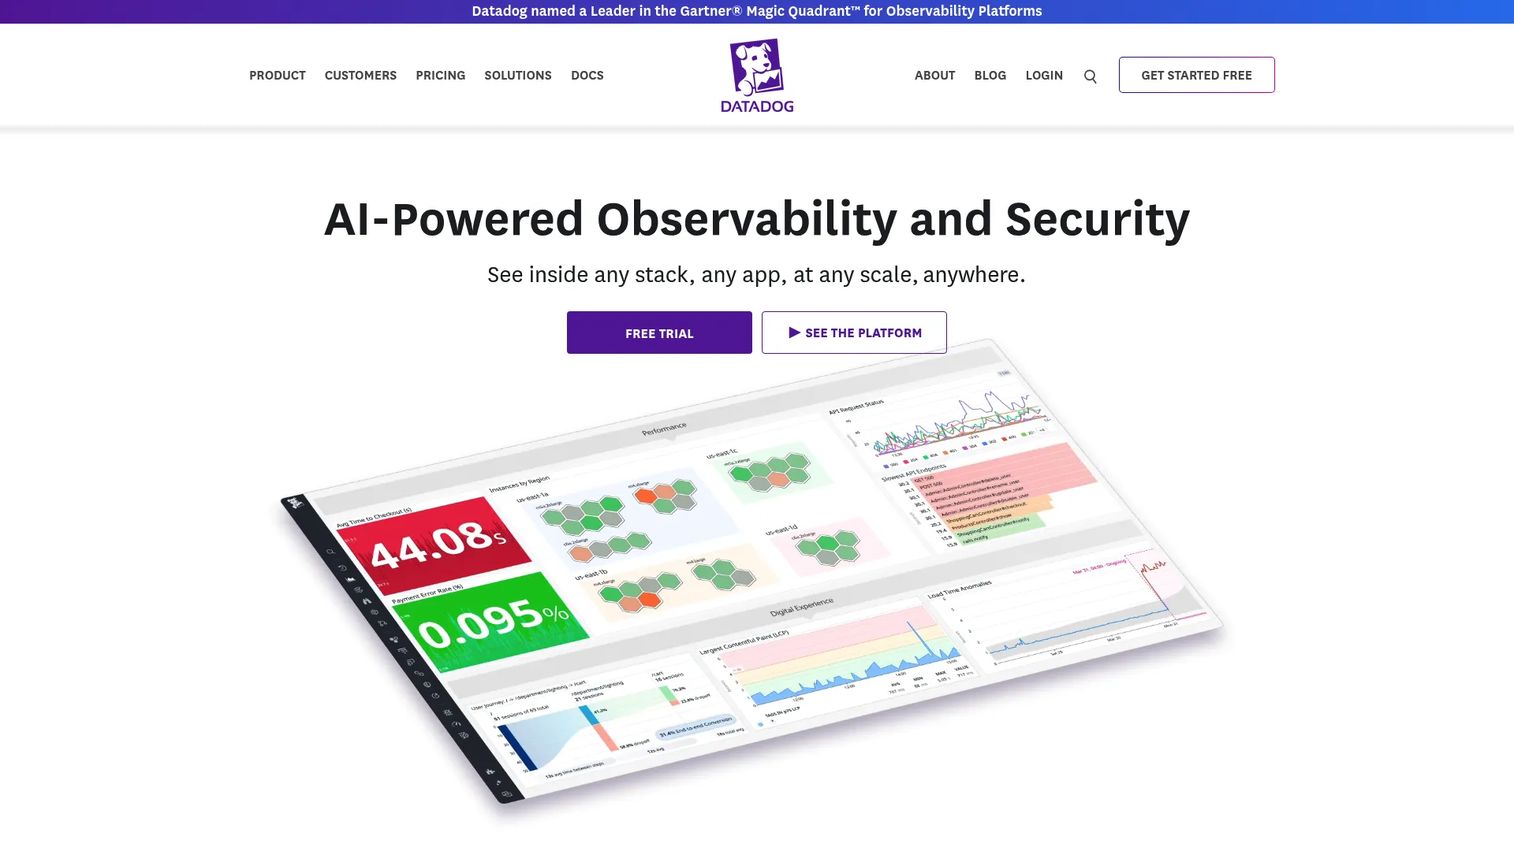
Datadog is a SaaS observability platform that covers infrastructure monitoring, application performance monitoring, log management, real user monitoring, synthetic testing, network performance, database monitoring, and security-adjacent telemetry. It is the go-to consolidation choice for engineering and DevOps teams running modern cloud-native stacks, and it connects those signals in a single timeline.
Best for: Engineering, DevOps, and SRE teams consolidating telemetry across cloud-native, Kubernetes, and multi-cloud environments.
Key features
- Infrastructure monitoring with metrics, alerting, and integrations
- APM with distributed tracing and service-level dashboards
- Log management with search, filtering, and correlation
- Real user monitoring and synthetic testing
- 700+ integrations including AWS, GCP, Azure, and Kubernetes
Why choose Datadog: Datadog fits teams that want one platform for metrics, traces, logs, and user experience rather than stitching separate products together. Keep in mind that pricing compounds with scale: Hosts, custom metrics, log ingestion, APM spans, RUM sessions, and each additional product module add to the bill, so model a 12-month scenario before committing.
Datadog pricing: Infrastructure Monitoring starts at $15 per host per month (billed annually) for the Pro plan and $23 per host per month for Enterprise. A free tier is available. Separate modules for APM, logs, RUM, synthetics, and database monitoring each carry their own per-unit rates.
G2 rating: 4.4/5
2. Dynatrace
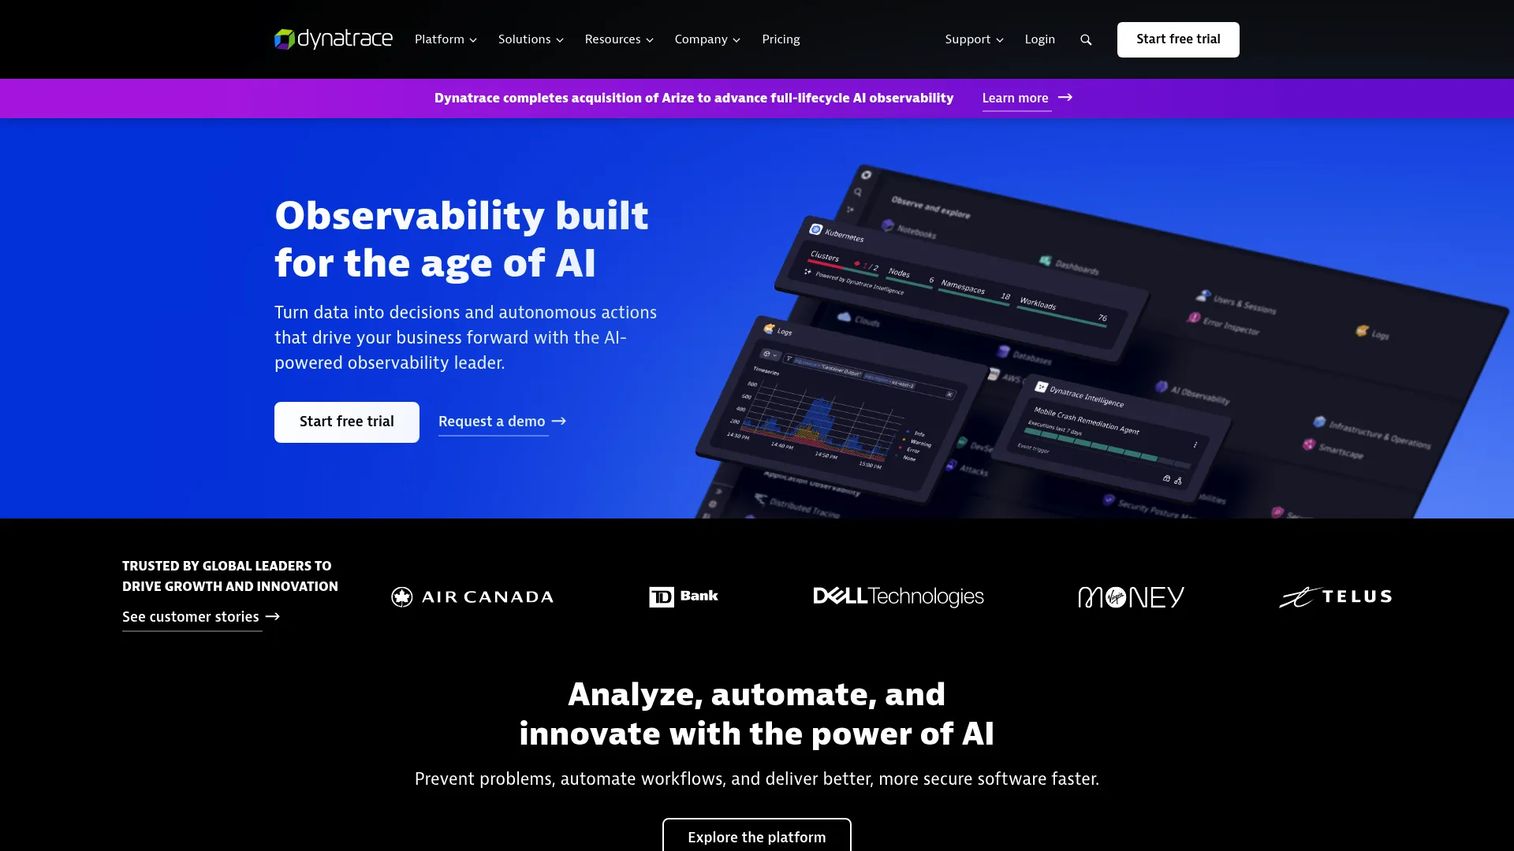
Dynatrace is an enterprise observability and AIOps platform built around automated discovery, dependency mapping, and Davis AI, its causal AI engine. It covers application performance monitoring, infrastructure monitoring, real user monitoring, synthetic monitoring, log analytics, and security observability. The platform automatically builds and maintains a real-time topology map of your environment without manual configuration.
Best for: Large enterprises that need automated topology, AI-assisted root cause analysis, and deep application observability across complex distributed systems.
Key features
- Davis AI for automated root cause analysis and anomaly detection
- Automatic full-stack discovery and dependency mapping
- Application performance monitoring with distributed tracing
- Real user monitoring and synthetic monitoring
- Log analytics correlated with metrics and traces
Why choose Dynatrace: Dynatrace excels when manual threshold tuning and dashboard building cannot keep pace with the complexity of distributed applications. Davis AI reduces mean time to detect by identifying probable root cause rather than presenting a list of correlated alerts. Teams should plan careful onboarding because the platform's depth introduces a learning curve, particularly for teams new to topology-driven observability.
Dynatrace pricing: Dynatrace uses consumption-based rate-card pricing. Infrastructure Monitoring starts at $0.04 per host-hour. Full-Stack Monitoring starts at $0.01 per memory-GiB-hour. Real User Monitoring starts at $0.0001 per property per session. A 15-day free trial is available.
G2 rating: 4.5/5
3. SolarWinds Observability SaaS
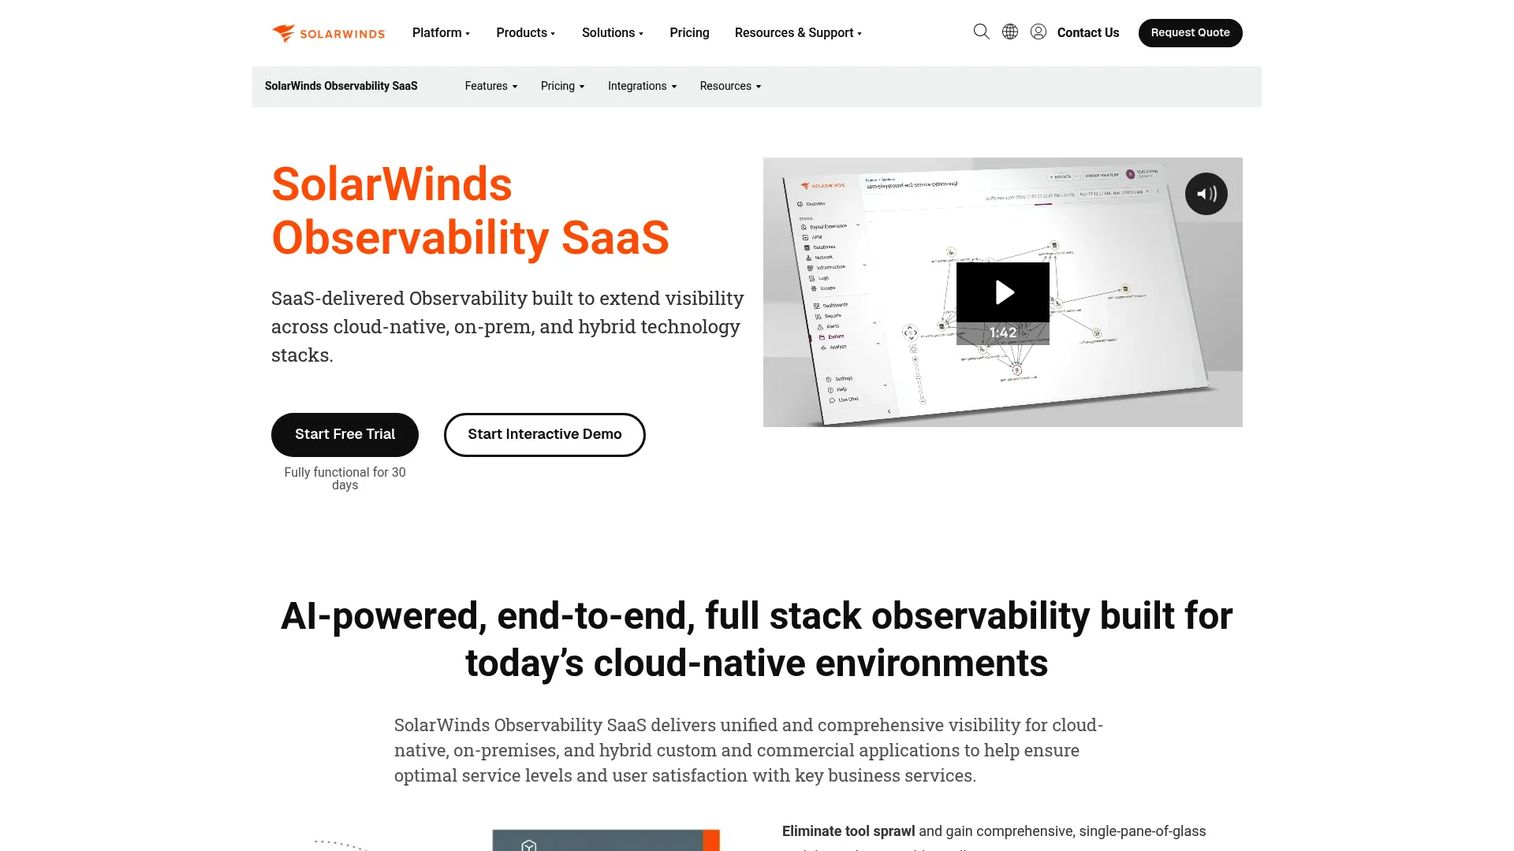
SolarWinds Observability SaaS is a SaaS-delivered full-stack observability platform for cloud-native and hybrid IT environments. It unifies metrics, traces, logs, database queries, and user-experience data across cloud services, on-premises infrastructure, and distributed networks. Its heritage in network and enterprise IT monitoring, combined with newer cloud-native observability coverage, makes it a practical fit for organizations that cannot afford to abandon their existing estate while modernizing.
Best for: Enterprise IT and DevOps teams managing hybrid environments with meaningful on-premises infrastructure alongside cloud workloads.
Key features
- Application observability with distributed tracing and exception tracking
- Hybrid infrastructure monitoring including cloud, virtual, and physical hosts
- Network observability across distributed estates
- Database visibility with query-level insights
- AIOps-enhanced anomaly detection and root cause analysis
Why choose SolarWinds Observability SaaS: SolarWinds suits organizations that need monitoring continuity across legacy and modern stacks. It fits teams with network-heavy operational requirements who also need to extend visibility into containerized applications or cloud services. Evaluate how SaaS observability coverage maps to your existing SolarWinds deployments before signing.
SolarWinds Observability SaaS pricing: Modular pricing by usage type. Application Observability starts at $27.50 per service per month. Network and Infrastructure Observability starts at $15.75 per node per month. Log Observability starts at $5 per GB per month. Database Observability starts at $70 per database instance per month. Multi-year contracts billed annually. A 30-day free trial is available.
G2 rating: 4.3/5
4. Grafana Enterprise
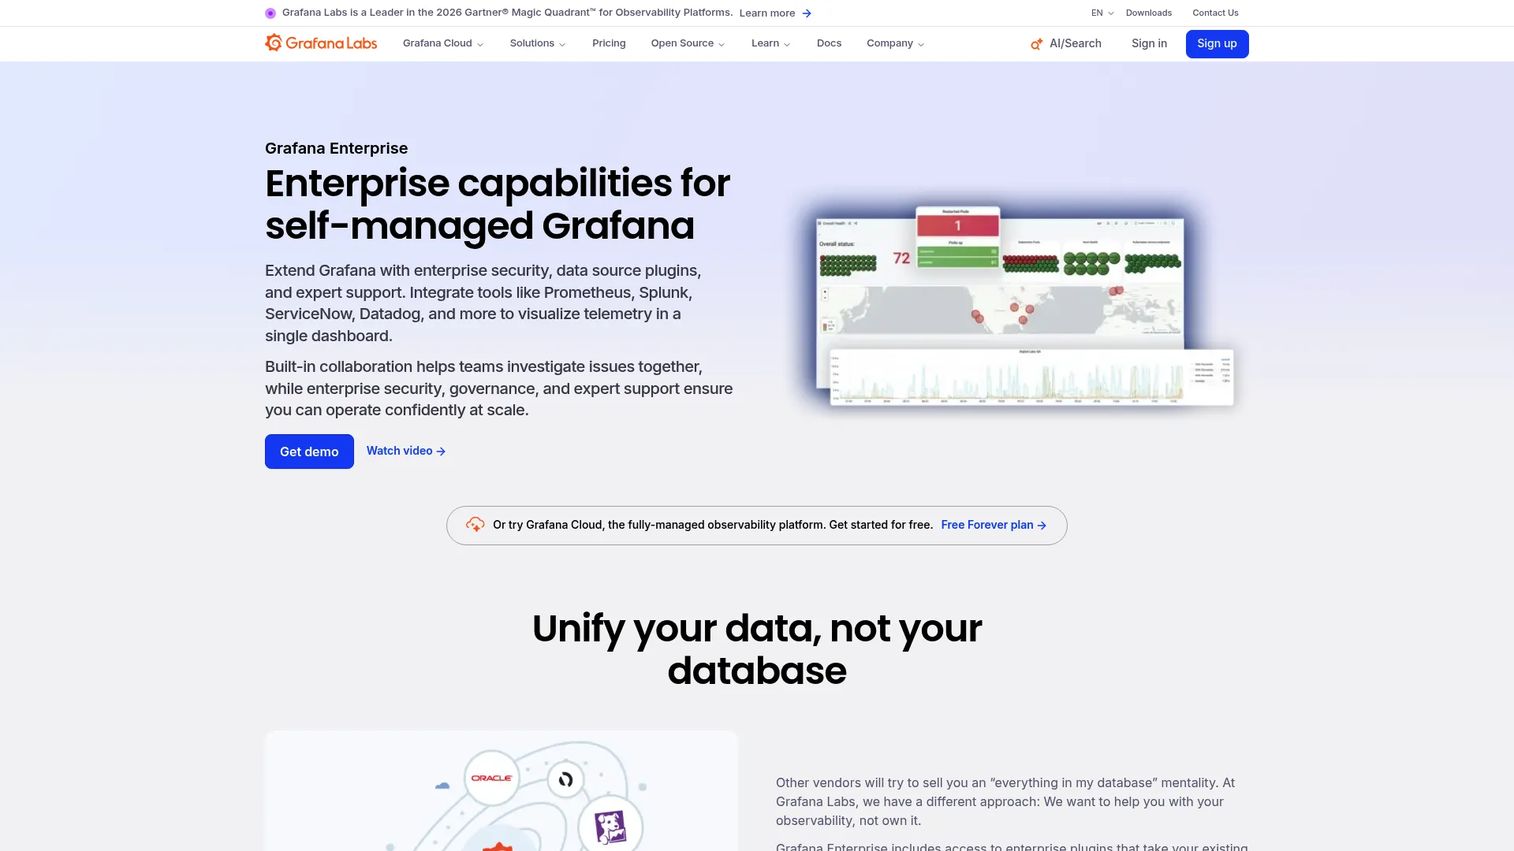
Grafana Enterprise is the self-managed, enterprise-grade offering built on top of Grafana's open observability stack. It adds role-based access control, SAML authentication, team synchronization, scheduled PDF reporting, custom branding, audit logging, query caching, enterprise data-source plugins, and 24/7 support on top of the open-source Grafana, Loki, Mimir, and Tempo components.
Best for: Teams that already run Prometheus, OpenTelemetry, or open-source Grafana dashboards and need enterprise governance, reporting, and professional support at scale.
Key features
- Role-based access control and data-source permissions
- SAML authentication, enhanced LDAP, and team synchronization
- Scheduled PDF reporting and dashboard export
- Enterprise plugins for premium data sources
- Audit logging and usage insights
Why choose Grafana Enterprise: Grafana Enterprise excels when teams have strong in-house observability engineering and want to build on the open ecosystem without giving up support or governance. It is a strong fit when Prometheus and OpenTelemetry are already collecting telemetry and the team wants a governed visualization and alerting layer on top. Teams less familiar with the Grafana stack should plan meaningful onboarding time.
Grafana Enterprise pricing: Pricing requires a sales conversation. Contact Grafana with your user count, data source requirements, deployment model, and support needs. You can download and run the Enterprise edition before upgrading to the full feature set.
5. Paessler PRTG
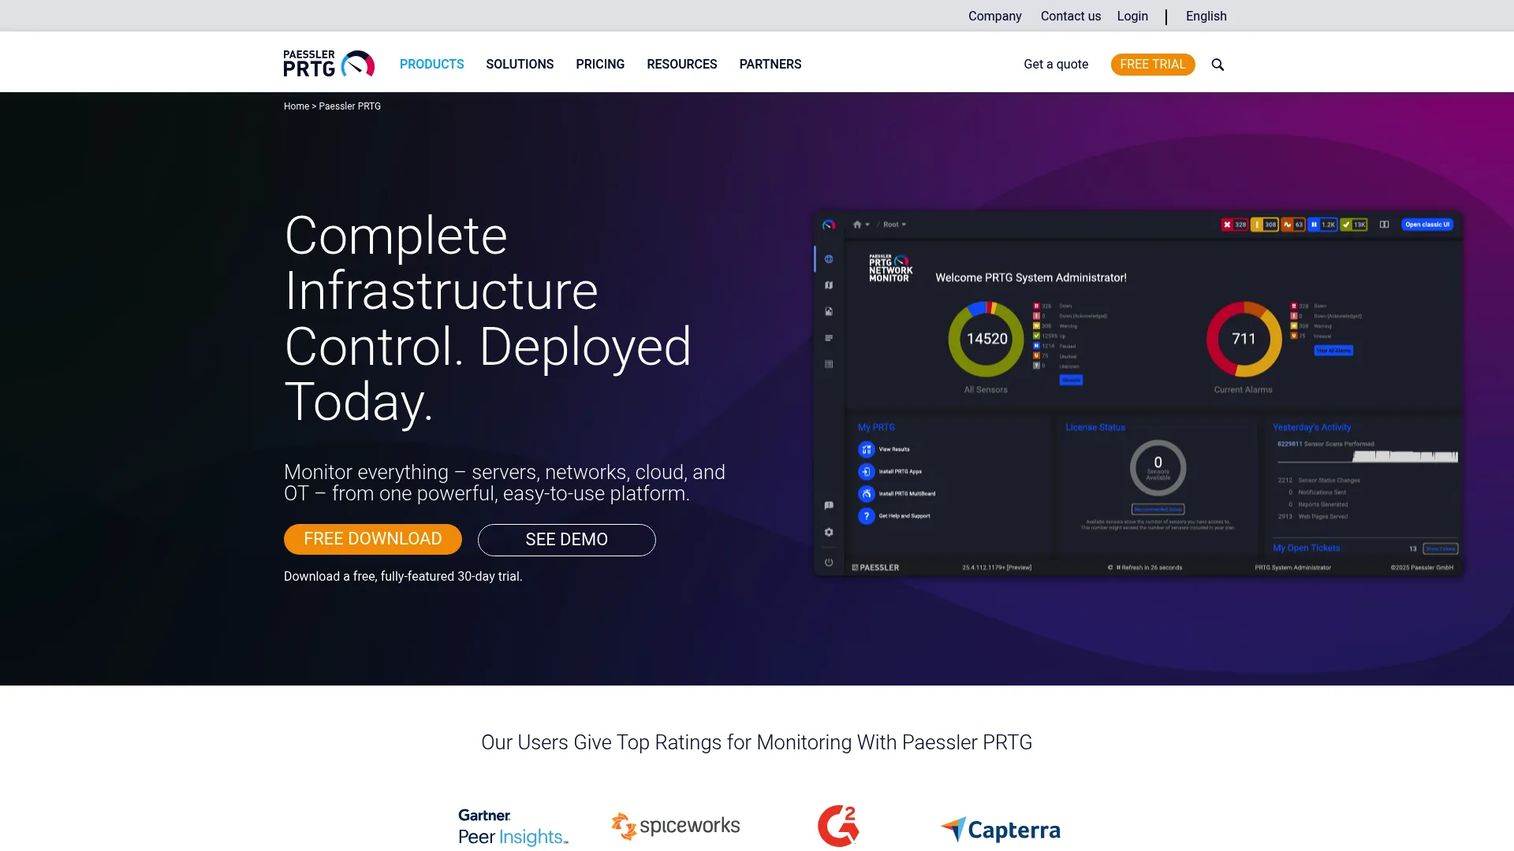
Paessler PRTG is a sensor-based IT monitoring platform for networks, servers, applications, traffic, virtual environments, cloud services, and IoT devices. Each sensor monitors one specific metric, such as CPU usage on a server, bandwidth on a network interface, or uptime of a web service. The sensor model makes pricing transparent and coverage predictable.
Best for: IT operations teams and managed service providers that need practical device, traffic, server, and service monitoring from a familiar operations interface.
Key features
- 250+ pre-configured sensor types for devices, services, and traffic
- AI-driven anomaly detection and sensor recommendations
- Real-time dashboards and drag-and-drop network maps
- Distributed monitoring with remote probes
- Custom alerting and mobile apps
Why choose Paessler PRTG: PRTG is strong when teams want solid network monitoring software coverage across mixed device estates, branch networks, and service uptime checks without building a custom observability stack. The sensor model makes it easy to estimate costs before rollout: Count your sensors and match to a license tier. It is a practical enterprise network monitoring software option for operations teams that need breadth without engineering overhead.
Paessler PRTG pricing: Subscription licenses scale by sensor count: PRTG 500 starts at $200 per month (annual payment), PRTG 1000 at $358 per month, PRTG 2500 at $742 per month, PRTG 5000 at $1,300 per month, and PRTG 10000 at $1,642 per month. A Freeware Edition supports 100 sensors; a 30-day trial has no sensor or device limit.
G2 rating: 4.7/5
6. ManageEngine OpManager
ManageEngine OpManager is enterprise network monitoring software for routers, switches, firewalls, servers, virtual machines, storage, and wireless infrastructure. It combines automated infrastructure discovery with proactive alarms, adaptive thresholds, network mapping, workflow automation, and integrations with the broader ManageEngine product ecosystem.
Best for: Network operations teams that need monitoring, fault management, network mapping, and performance reporting without moving to an engineering-led observability stack.
Key features
- Automated infrastructure discovery and classification
- Proactive alarms with adaptive thresholds and event correlation
- Network mapping and topology visualization
- Performance dashboards and scheduled reporting
- Workflow automation and ManageEngine ecosystem integrations
Why choose ManageEngine OpManager: OpManager fits teams that run traditional network operations and need practical coverage of physical and virtual infrastructure. It is a strong shortlist candidate for organizations where network device health, WAN performance, and server availability are the primary monitoring priorities. Teams evaluating enterprise IT monitoring at the network layer will find the combination of fault management and topology mapping useful.
ManageEngine OpManager pricing: Standard Edition starts at $95 for 10 devices (annual billing). Professional Edition starts at $145 for 10 devices. Enterprise Edition starts at $4,595 for 250 devices. A free edition supports 3 devices and 2 users.
G2 rating: 4.5/5
7. LogicMonitor
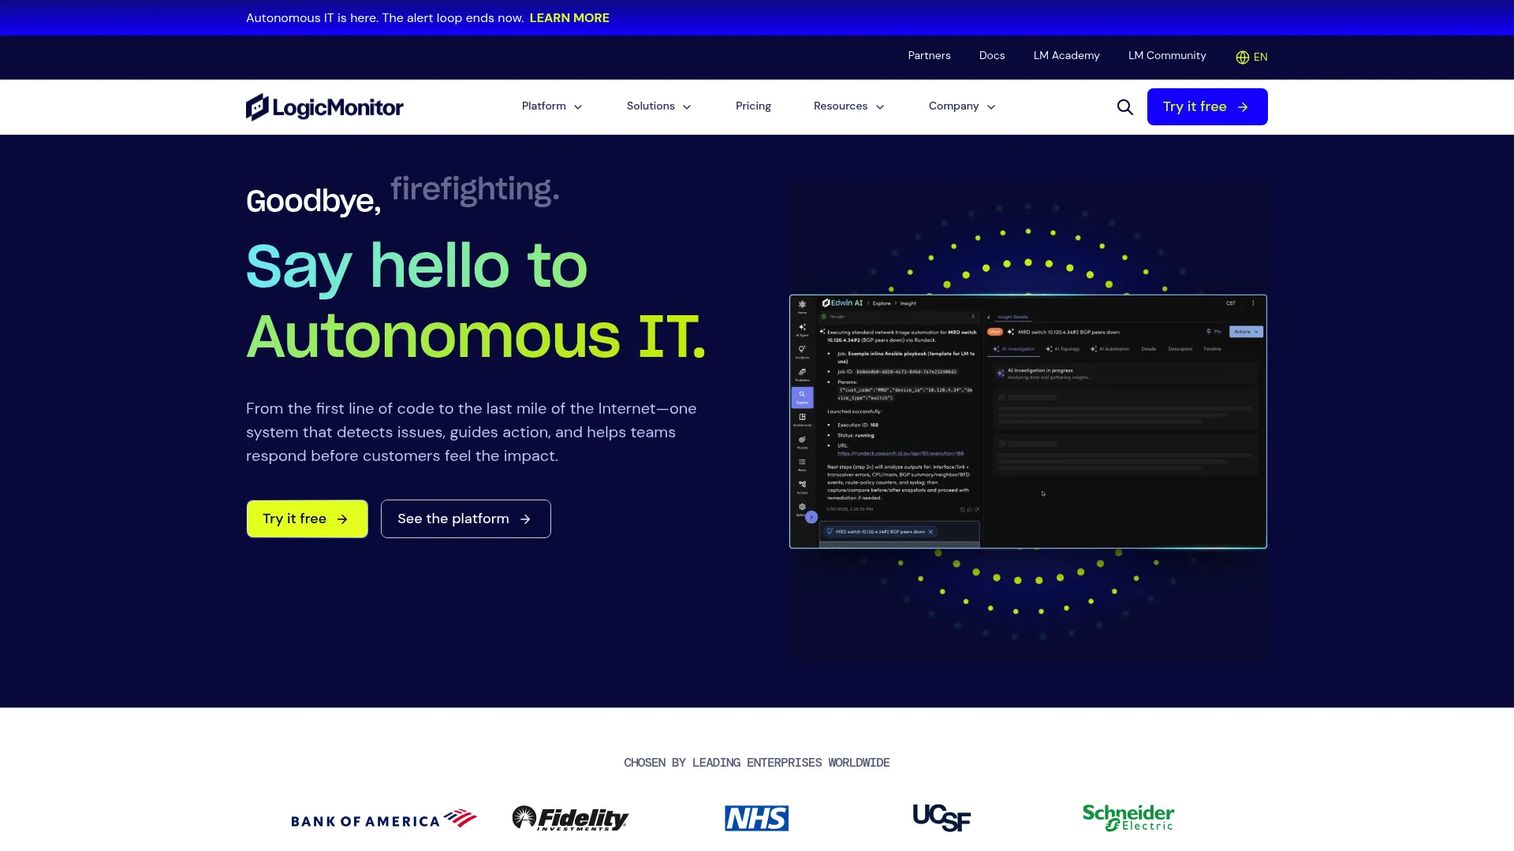
LogicMonitor is an AI-first SaaS observability platform for monitoring hybrid infrastructure, cloud environments, applications, networks, digital experience, and Internet performance. It ships with 3,000+ integrations and its Edwin AI layer adds event intelligence, root cause analysis, anomaly detection, and forecasting across the monitored estate.
Best for: Enterprise IT operations, SRE, and DevOps teams that want SaaS monitoring across hybrid infrastructure without maintaining monitoring servers.
Key features
- Hybrid infrastructure and cloud monitoring
- Agentic AIOps with event intelligence and root cause analysis
- Application performance monitoring including metrics, logs, traces, and synthetics
- 3,000+ integrations with infrastructure, cloud, and ITSM tools
- Customizable dashboards and topology views
Why choose LogicMonitor: LogicMonitor suits teams that need broad integration coverage and want to avoid maintaining monitoring infrastructure. Evaluate pricing units carefully: Hybrid unit counts vary by resource type, and the bill grows with your estate. Review alert routing, integration depth with your ITSM and CI/CD tooling, and how the platform handles distributed multi-site deployments during a proof of concept.
LogicMonitor pricing: Three packages: Essentials at $16 per hybrid unit per month, Advanced at $27 per hybrid unit per month, and Signature + Edwin AI at $53 per hybrid unit per month (all starting monthly list prices). A 15-day free trial is available.
G2 rating: 4.5/5
8. New Relic
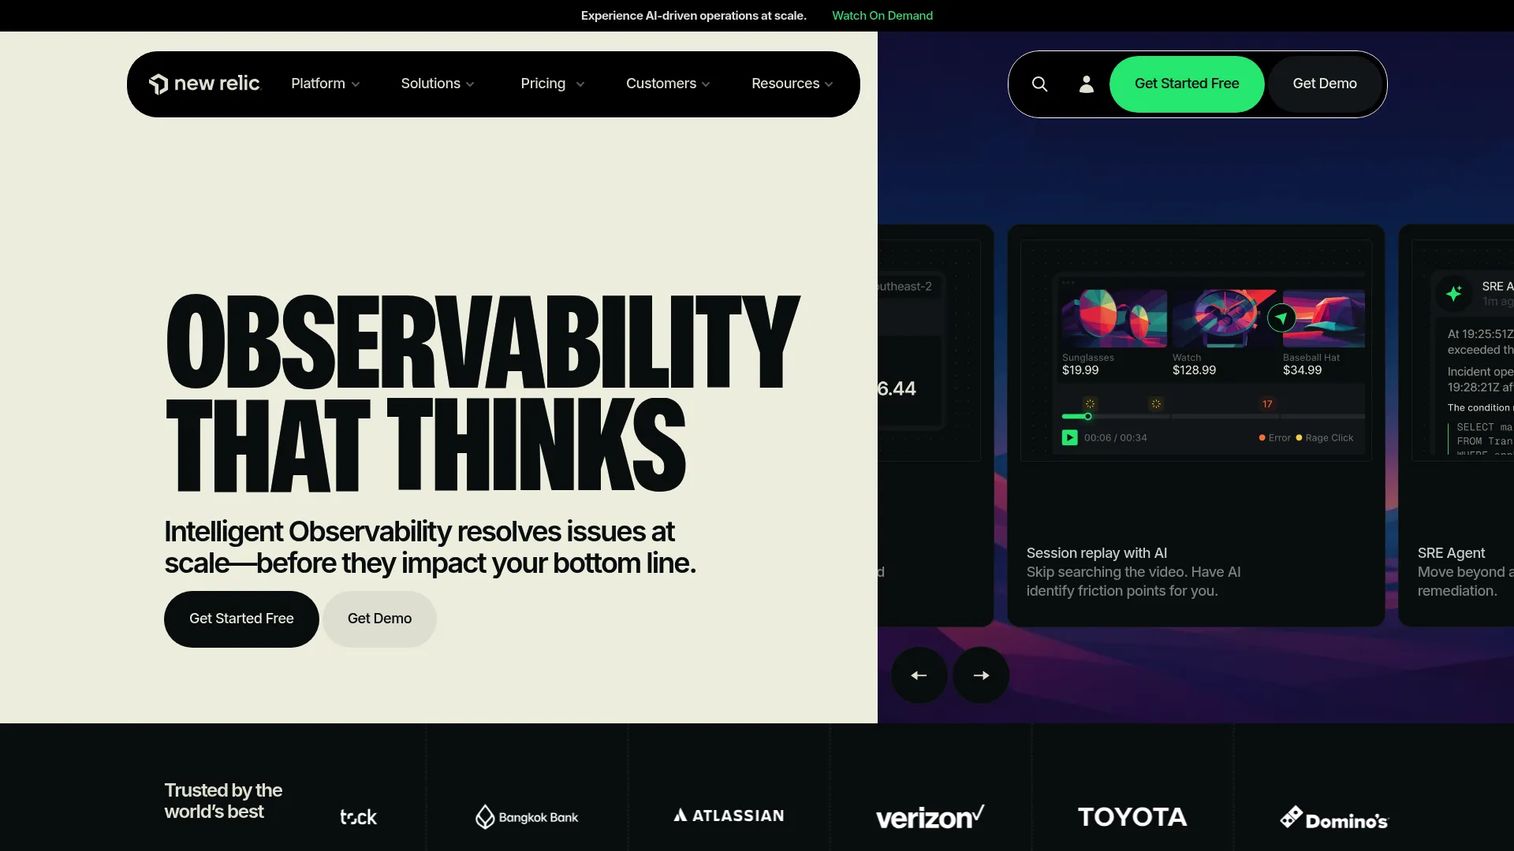
New Relic is a full-stack observability platform covering application performance monitoring, infrastructure monitoring, log management, distributed tracing, browser monitoring, mobile monitoring, synthetic testing, and session replay. It prices around data ingest and user type rather than per host, which benefits teams with large infrastructure but modest data volumes.
Best for: Engineering-led organizations that want application, infrastructure, log, and user-experience telemetry in one platform with developer-friendly query and alerting workflows.
Key features
- APM with distributed tracing, transaction monitoring, and error tracking
- Infrastructure, Kubernetes, cloud, and network monitoring
- Log management with logs-in-context and no-code parsing
- Browser, mobile, synthetic, and session-replay monitoring
- AI-assisted root cause analysis and predictive alerting
Why choose New Relic: New Relic works well when engineering teams need to connect code-level performance to infrastructure health and end-user experience in a single investigation workflow. The user-type and data-ingest pricing model is predictable for teams with stable telemetry volumes, though costs rise with data growth and additional full platform users.
New Relic pricing: Free plan includes 100 GB of data ingest per month and one full platform user. Standard plan starts at $10 per month for the first full platform user, plus $99 per month for each additional. Pro plan starts at $349 per user per month (billed annually). Data ingest beyond the free tier costs $0.40 per GB.
G2 rating: 4.4/5
9. Splunk Enterprise
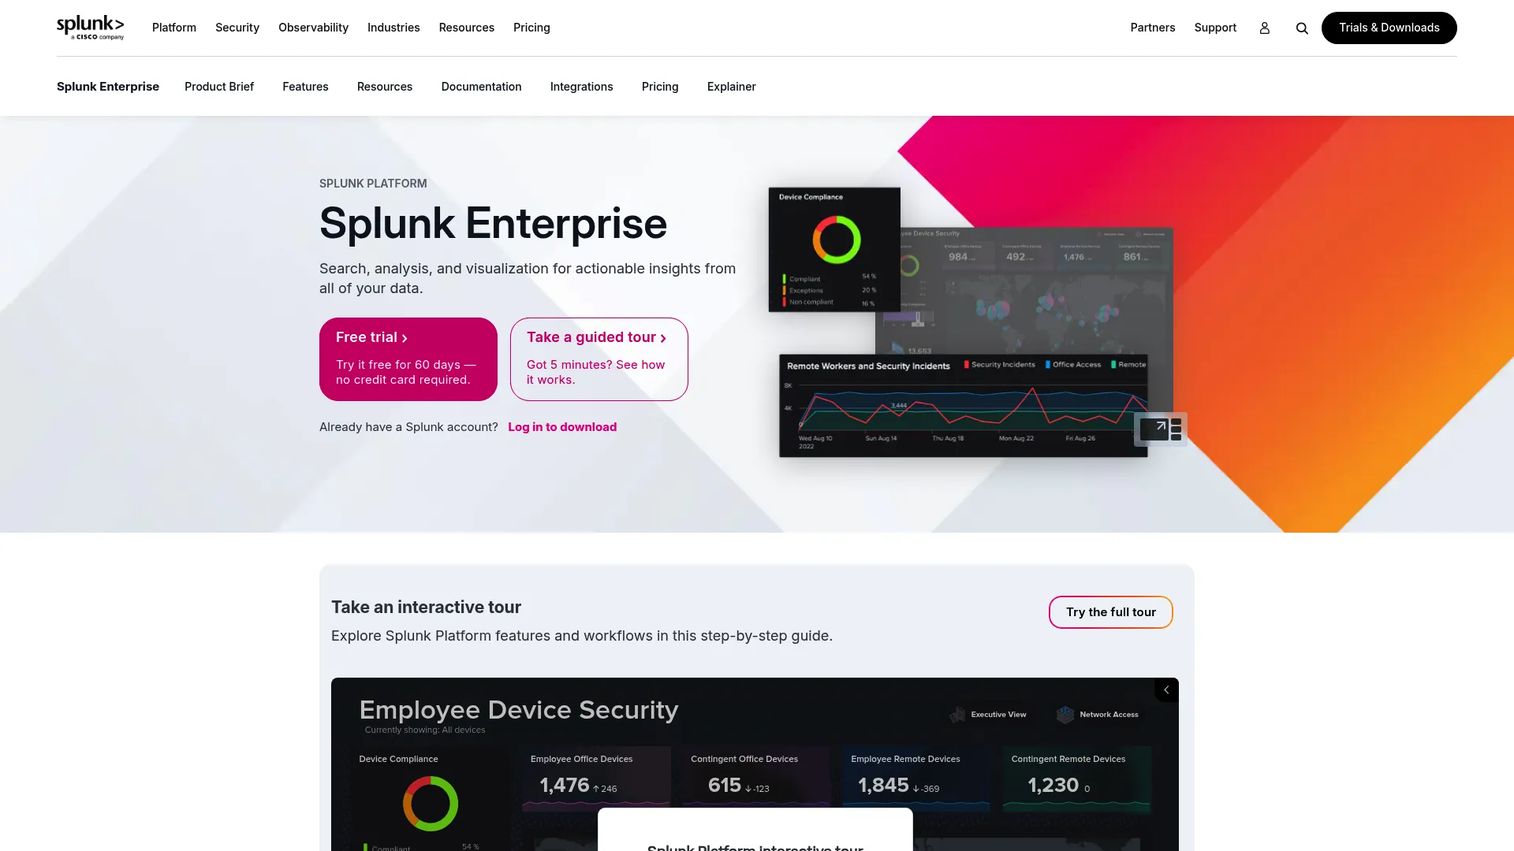
Splunk Enterprise is a data platform for searching, analyzing, visualizing, monitoring, and acting on machine-generated data. Its Search Processing Language (SPL) gives engineers powerful query capabilities across log data, metrics, and events. Teams use it for security operations, IT monitoring, observability, compliance dashboards, and operational intelligence.
Best for: Large organizations with log-heavy monitoring strategies, existing Splunk expertise, and requirements for powerful search, dashboards, and compliance-grade reporting.
Key features
- Search Processing Language for flexible log search and analysis
- Real-time monitoring and threshold alerting
- Custom dashboards and data visualizations
- Data ingestion and indexing from diverse machine-data sources
- Workload management and horizontally scalable architecture
Why choose Splunk Enterprise: Splunk is strong when logs sit at the center of your monitoring strategy and teams need deep investigative capability during incidents. It also fits compliance-driven contexts where audit-quality search and reporting are requirements. Teams should model data ingestion volume, retention periods, and admin overhead carefully before purchase, as total cost of ownership scales with all three.
Splunk Enterprise pricing: Splunk prices by compute capacity or daily data volume under term licenses. A sales conversation is needed to get current pricing for your expected ingest and deployment scale.
G2 rating: 4.3/5
10. IBM Instana
IBM Instana is an AI-powered full-stack observability platform that automatically discovers and maps every application component, service dependency, and infrastructure resource without agent configuration. It covers application performance monitoring, distributed tracing, infrastructure and cloud monitoring, database monitoring, digital experience monitoring, and AI workload observability.
Best for: DevOps, SRE, and engineering teams needing automated, real-time observability across complex microservice architectures and containerized applications.
Key features
- Automatic discovery and dependency mapping without manual configuration
- APM with distributed tracing and code-level diagnostics
- Infrastructure, Kubernetes, and cloud infrastructure monitoring
- Database monitoring and digital experience monitoring
- AI-assisted incident investigation and OpenTelemetry support
Why choose IBM Instana: Instana fits teams where application behavior is the primary incident domain and manual agent configuration is a bottleneck. The automated discovery model reduces setup time for complex distributed systems. Presales and technical evaluators supporting enterprise software purchases will find Instana's dependency maps useful for proving application-level observability before procurement.
IBM Instana pricing: PayPerUse starts at $0.03 per MVS (Managed Virtual Server) hour per month. SaaS plans start at $21.20 per MVS per month. Self-hosted annual subscription starts at $385.20 per MVS per year. A 14-day free trial with full access is available.
G2 rating: 4.4/5
11. Checkmk
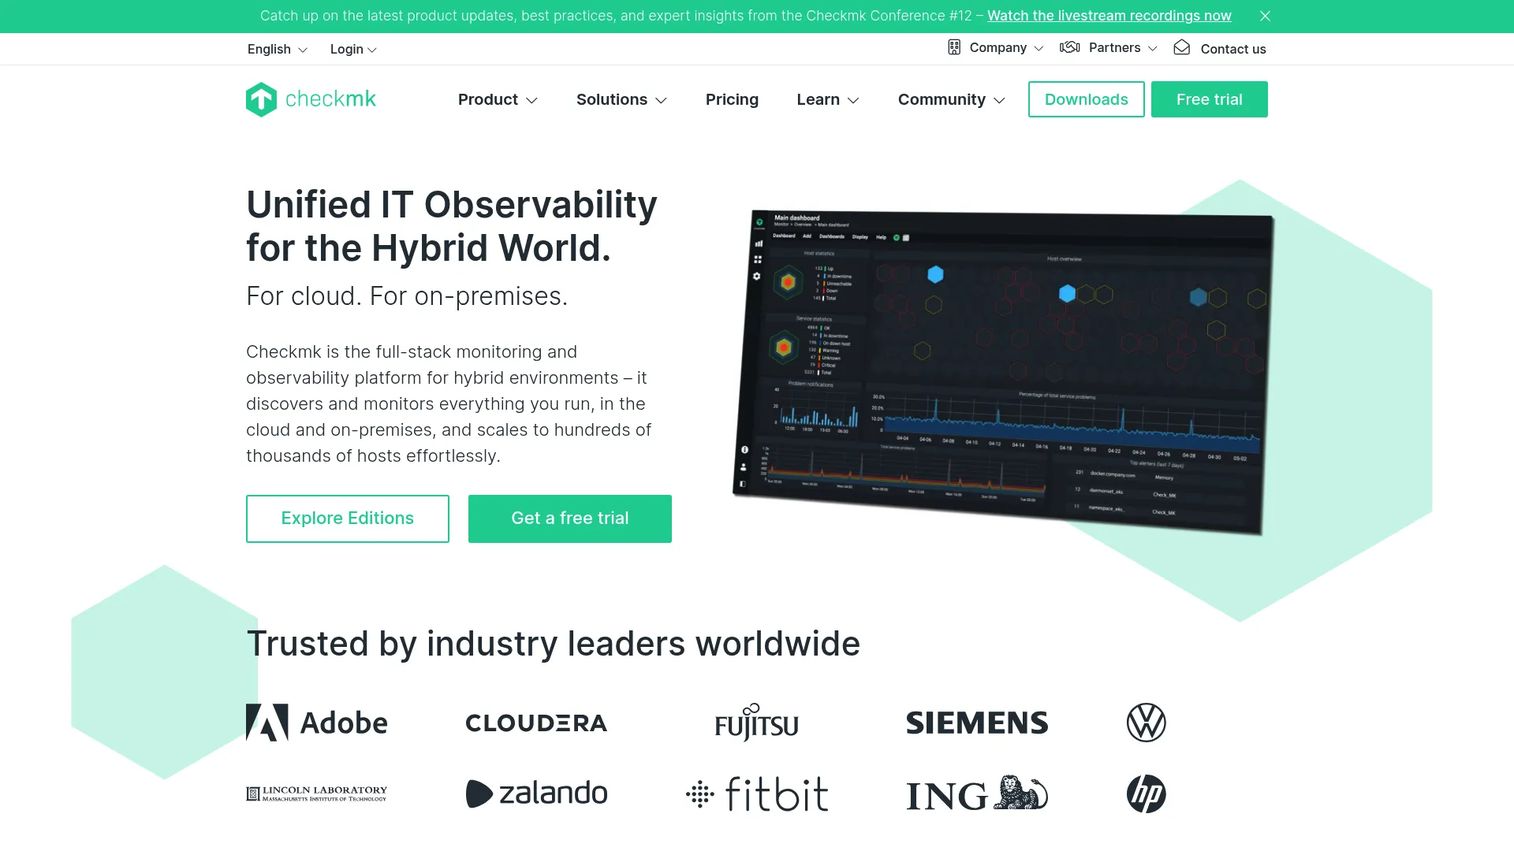
Checkmk is an open-source IT monitoring platform with enterprise editions for organizations that need governance, support, and scale beyond the community build. It covers infrastructure, applications, networks, cloud environments, storage, databases, and containers, with auto-discovery and more than 2,000 built-in integrations. For teams in regulated or security-sensitive contexts, self-hosted monitoring avoids dependency on external SaaS telemetry pipelines.
Best for: IT teams that want strong self-hosted server monitoring software, open-source control over monitoring logic, and the option to add enterprise support as the environment grows.
Key features
- Automated service discovery across infrastructure, network, and cloud
- More than 2,000 built-in integrations for hosts, services, and devices
- Distributed monitoring for multi-site deployments
- Enterprise editions with RBAC, reporting, and commercial support
- On-premises deployment with full data residency control
Why choose Checkmk: Checkmk suits organizations that want to own their monitoring environment and avoid vendor lock-in on telemetry storage. The community edition is genuinely capable for teams with monitoring expertise; the Pro and Ultimate editions add commercial support and governance features for production enterprise deployments. For teams evaluating AIOps tools alongside traditional monitoring, Checkmk integrates with AIOps-adjacent alerting workflows.
Checkmk pricing: Community edition is free. Pro edition starts at €190 per month (billed annually). Ultimate edition starts at €275 per month. Synthetic monitoring includes three free tests.
12. Zabbix
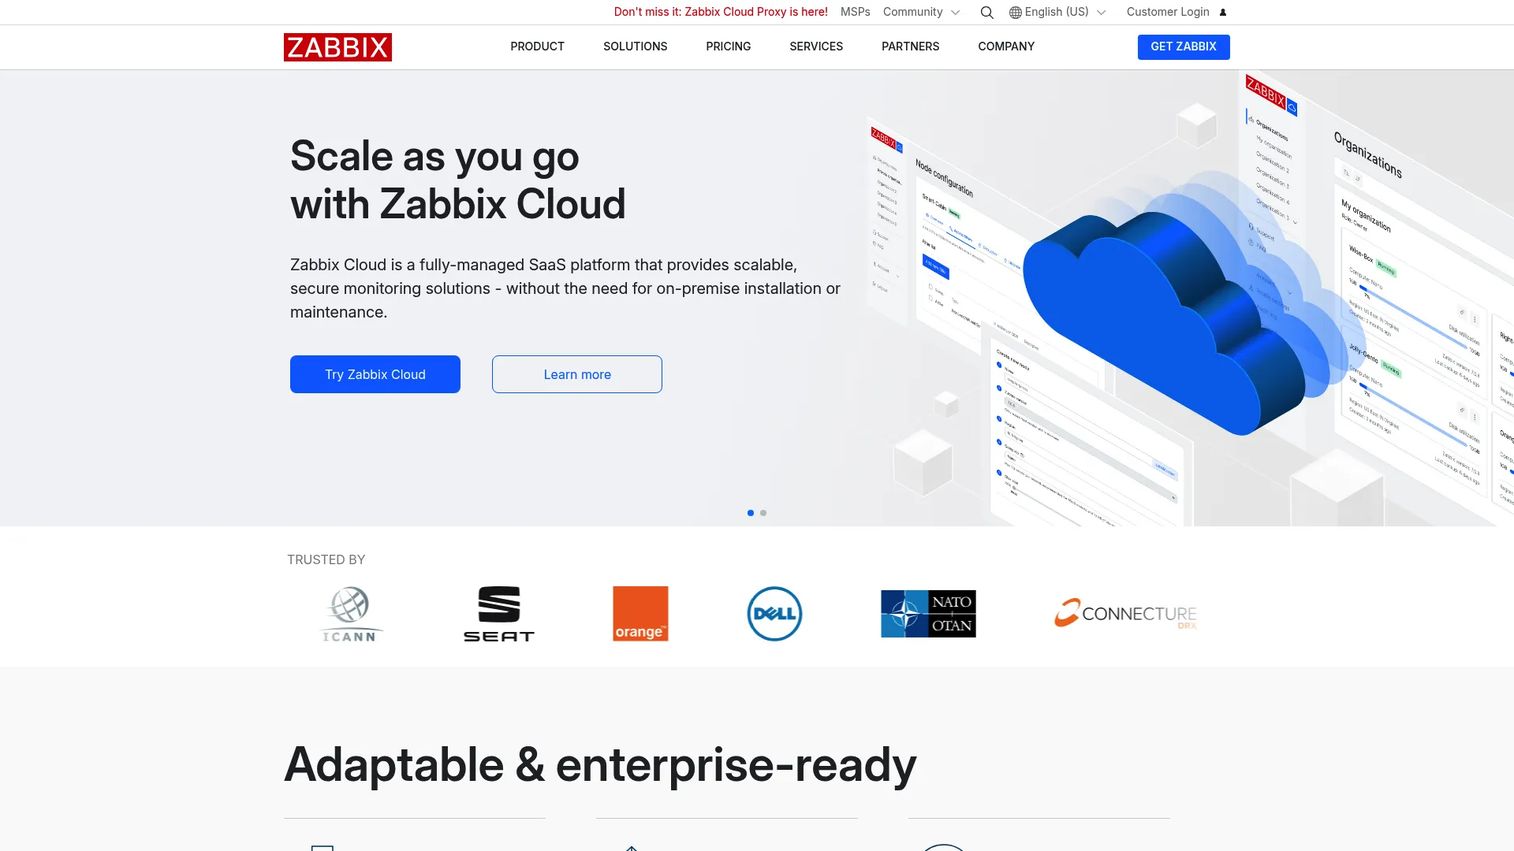
Zabbix is an enterprise-grade open-source monitoring platform for infrastructure, applications, networks, databases, cloud services, containers, and virtual machines. Teams use templates and triggers to define what gets monitored and how alerts fire, with a large community ecosystem providing pre-built templates for common environments.
Best for: Technical teams that want flexible open-source infrastructure monitoring and are comfortable configuring templates, triggers, and alert workflows themselves.
Key features
- Metric collection from networks, cloud, containers, VMs, and applications
- Template-based monitoring with thousands of community templates
- Problem detection, anomaly detection, and trend prediction
- Business service and SLA monitoring
- TLS encryption, RBAC, SSO, LDAP/SAML, MFA, and audit logging
Why choose Zabbix: Zabbix rewards teams with monitoring expertise and clear operational standards. There is no traditional license cost, which matters for budget-constrained teams or large environments where per-host SaaS pricing would compound quickly. The trade-off is ownership: Configuration, upgrades, and template maintenance fall on your team. Pair it with a commercial support subscription when production stability and SLA-backed response are requirements. For teams also evaluating API monitoring tools as part of a broader stack, Zabbix covers API endpoint monitoring natively.
Zabbix pricing: Zabbix software is free to download and deploy. Commercial support subscriptions start at €245 per month (Silver tier, billed annually), with Gold at €660 per month and custom Platinum, Enterprise, and Global tiers above that.
G2 rating: 4.3/5
Considerations when choosing enterprise monitoring software
Coverage across your actual estate
Map your hosts, containers, cloud accounts, network devices, databases, applications, storage, and user-facing services before evaluating any platform. A tool that looks strong on cloud-native environments can fail when it meets legacy network devices or on-premises databases. Test coverage against your real topology, not a reference architecture.
Alert quality and root cause context
Alert volume is cheap. Useful correlation is hard. During a proof of concept, test the platform against a real incident scenario: Does it surface topology context, suppress downstream noise, and point toward root cause, or does it just generate a list of threshold violations? Alert correlation, dependency maps, and escalation paths matter more than alert count.
Pricing predictability
Enterprise monitoring pricing expands through hosts, sensors, metrics, logs, traces, user types, retention periods, and module add-ons. Build a 12-month and 36-month cost model before signing. For usage-based platforms, model your expected telemetry growth conservatively, then add a 30% buffer. Surprises at renewal are common when teams underestimate log volume or custom metric cardinality.
Integration with incident and IT workflows
The best monitoring platform is the one your team uses during a 2 a.m. incident. Evaluate ITSM integrations, chat and ticketing connectors, escalation routing, and CI/CD pipeline hooks. A platform with excellent detection but poor integration with your existing tools creates friction exactly when you need speed.
Governance and enterprise readiness
Cover RBAC, SSO, audit logs, data residency, environment separation, and admin controls before the proof of concept starts. Presales teams supporting enterprise software purchases should surface these requirements early, since security review cycles are the most common cause of evaluation delays. For teams who also need to show complex software value before procurement commits, an interactive demo gives buyers a structured product experience before the first live call.
Conclusion
Choosing enterprise monitoring software requires matching platform strengths to your actual environment, not to a vendor's ideal deployment scenario.
Datadog is the default consolidation choice for cloud-native and multi-cloud estates. Dynatrace brings the most automated intelligence for teams that cannot manually maintain topology maps at scale. SolarWinds Observability SaaS and Paessler PRTG serve hybrid IT and network-heavy teams well, from different delivery models. Grafana Enterprise suits engineering organizations already invested in the open observability stack. New Relic and IBM Instana are strong when applications are the primary incident domain. Splunk Enterprise wins when log analytics and investigative depth drive the monitoring strategy. Checkmk and Zabbix give technically capable teams full control without per-host licensing.
Recommended next step: Shortlist three platforms based on your environment type, infrastructure mix, and primary incident domain. Build a proof-of-concept scorecard covering telemetry coverage, alert quality, integration depth, pricing model, and governance before you sign.
For teams selling complex software who need to show product value during technical evaluations, a sandbox gives buyers hands-on access to product workflows before the live environment conversation starts.
Start your journey with Guideflow today!
FAQs
Enterprise monitoring software is a platform that tracks the health, performance, availability, and usage of large-scale IT systems across infrastructure, networks, applications, cloud services, databases, containers, logs, traces, and user-facing services. It alerts teams when systems degrade, helps engineers investigate incidents, and supports compliance reporting and capacity planning at organizational scale.
Monitoring tracks known signals against defined thresholds: CPU above 90%, latency above 500ms, error rate above 1%. Observability helps engineers investigate unknown failure modes by combining metrics, logs, and traces to answer questions the monitoring system was not pre-configured to ask. Most modern enterprise platforms blend both capabilities, but the distinction matters when evaluating depth of root cause analysis versus breadth of threshold-based alerting.
Hybrid cloud environments need platforms that can monitor cloud accounts, on-premises servers, network devices, and containerized workloads without siloing telemetry. SolarWinds Observability SaaS, Dynatrace, LogicMonitor, and Checkmk each support hybrid deployments. The deciding factors are deployment model preference (SaaS vs. self-hosted), network visibility depth, cloud provider integration coverage, and dependency mapping across the estate boundary.
SolarWinds Observability SaaS, Paessler PRTG, ManageEngine OpManager, Checkmk, and Zabbix all provide strong enterprise network monitoring software capabilities. PRTG and OpManager are particularly strong for device-level network operations. SolarWinds covers network alongside cloud and application telemetry. Checkmk and Zabbix work well for teams that want self-hosted network monitoring with community template support.
Costs vary by platform model. Sensor-based tools like PRTG charge by sensor count. Host-based SaaS tools like Datadog charge per monitored host. Usage-based tools like Dynatrace and New Relic charge by resource consumption or data ingestion. Open-source tools like Zabbix have no software license fee, but carry hosting, administration, and optional support costs. Before committing, model expected hosts, telemetry volume, log ingestion, users, retention requirements, and any module add-ons across a 12-month and 36-month window.
A strong proof of concept for enterprise IT monitoring should cover: Telemetry collection from your actual infrastructure types (not just reference hosts), alerting behavior across a simulated or real incident, dashboard and topology map quality, integration with your ITSM and chat tooling, role-based access control and SSO configuration, data retention settings, and a cost model based on your real usage pattern. For presales teams, the POC is also an opportunity to demonstrate platform fit to security, infrastructure, and operations stakeholders before procurement is involved.
Open source monitoring platforms like Checkmk and Zabbix can handle enterprise-scale environments when teams have the monitoring expertise and operational discipline to maintain them. The meaningful costs are not in software licenses but in configuration, template management, upgrade cycles, and incident response when the monitoring system itself has issues. Enterprise editions of both tools add commercial support, governance features, and SLA-backed response for teams that need that assurance. Evaluate support, governance, compliance requirements, and internal bandwidth honestly before choosing a self-hosted path.
MTTR reduction comes from faster detection and faster diagnosis. On detection, tools with anomaly-based alerting and alert correlation surface incidents earlier and with less noise than threshold-only systems. On diagnosis, topology maps, distributed traces, log correlation, and AI-assisted root cause analysis cut the time between "something is wrong" and "we know why and where." The platforms that do both well, particularly Dynatrace, IBM Instana, and Datadog, show the strongest MTTR impact in complex distributed environments.