

Most ecommerce teams are not short on data. They are short on clarity.
You have Google Analytics in one tab, your Shopify dashboard in another, ad platform numbers in a third, and a spreadsheet someone built last quarter that nobody fully trusts anymore. Each source tells a slightly different story. When the founder asks why revenue dipped last week, you spend two hours reconciling numbers before you can even start answering the actual question.
That gap between collecting data and acting on it is expensive. The global ecommerce analytics market was valued at USD 28.64 billion in 2026 and is projected to reach USD 96.95 billion by 2035, growing at a 14.51% CAGR, according to Business Research Insights (2026). Teams are spending more because fragmented reporting quietly drains margin: wasted ad spend, missed conversion leaks, and decisions made on stale numbers.
The real problem is rarely a missing dashboard. It is too many disconnected ones. If you are evaluating tools that turn raw store and marketing data into defensible reporting, the same evaluation discipline applies to neighboring categories like marketing analytics, customer data platforms, and broader analytics platforms that drive ROI. This guide focuses on the tools that move you from data collection to revenue clarity.
What's inside
This is a buyer-oriented comparison of the best ecommerce analytics tools for 2026, written for digital marketers, growth teams, and ecommerce operators who need to improve ROI and cut reporting chaos.
We selected and ranked tools on five criteria that matter most when you are choosing analytics software for ecommerce:
- Integration depth with stores, ad platforms, CRM, and warehouses
- Reporting depth and dashboard usability for non-analysts
- Attribution across paid, organic, email, and direct
- Segmentation for customers, products, and cohorts
- Speed to insight so you spend less time reconciling and more time optimizing
Each tool below includes who it fits, key strengths, verified pricing where public, and a G2 rating where available.
TL;DR
- Best for teams already deep in the Google stack: Google Analytics (GA4) for free traffic, event, and conversion-path measurement.
- Best for Shopify-native merchants: Shopify Analytics for built-in commerce reporting with zero extra setup.
- Best for enterprise governance and segmentation: Adobe Analytics for mature teams with heavy reporting requirements.
- Best for behavioral and product analytics: Mixpanel for event-based journeys, cohorts, and retention.
- Best for DTC attribution and paid performance: Triple Whale for ad spend visibility and blended ROAS.
- Best for unified, multi-source reporting: Improvado for stitching ad platforms, ecommerce data, and dashboards together.
What is ecommerce analytics?
Ecommerce analytics is the practice of collecting, measuring, and interpreting data across your store, marketing, and customer touchpoints to make better revenue decisions.
The distinction that matters: collecting data is not the same as using it. Most teams already capture clicks, sessions, orders, and ad impressions. The harder job is turning that into ecommerce reporting that tells you what to do next, which channel to fund, which checkout step to fix, which customers to retain.
Strong ecommerce performance analytics revolves around a core metric set:
- Conversion rate: the percentage of visitors who buy
- AOV (average order value): revenue per order
- CLV (customer lifetime value): total value of a customer over time
- CAC (customer acquisition cost): what you pay to win a customer
- Retention and loyalty: how often customers come back
- Campaign ROI: return on each marketing dollar
A capable ecommerce analytics platform should do five things well:
- Unify data from store, ads, email, and support into one view
- Attribute revenue back to channels and campaigns, not just clicks
- Segment customers by behavior, value, and lifecycle stage
- Surface trends fast with real-time data and clear alerts
- Support dashboards and reporting that non-analysts can read
The shift toward this matters now. Business Research Insights (2026) reports a 47% increase in real-time analytics adoption and a 36% adoption rate for predictive analytics among ecommerce businesses, alongside a 40% rise in AI-driven recommendation engines. Analytics for ecommerce is moving from rear-view reporting to forward-looking decisions.
When to use ecommerce analytics tools
Not every team needs the same tool at the same time. Here is how to pattern-match your situation.
Improve attribution across channels
You need attribution support the moment your channels start interacting. A customer sees a paid social ad, searches your brand, clicks an email, then buys direct three days later. Last-click reporting credits the wrong touchpoint and you fund the wrong channel.
Dedicated ecommerce analytics software helps you tie spend back to orders rather than clicks. This matters most when paid, organic, email, and direct traffic all overlap and your CAC math depends on knowing which dollar actually drove the sale.
Spot conversion leaks in the funnel
Every ecommerce funnel leaks somewhere: browse to add-to-cart, cart to checkout, checkout to repeat purchase. Without analytics, you are guessing where.
The right tool shows you exactly where visitors drop off, then lets you test fixes fast. Pair behavioral data with conversion rate optimization and you stop redesigning things that already work and start fixing the steps that actually cost you revenue.
Build a single source of truth
Spreadsheet reporting works until it doesn't. Once marketing, product, support, and ops all need the same numbers, manual reconciliation becomes a tax on every meeting.
A unified analytics platform creates one set of numbers everyone trusts. When the founder, the head of growth, and the CFO all pull from the same source, decisions move faster and arguments about whose dashboard is right disappear.
Comparison table
The table below sorts the best ecommerce analytics tools by relevance to ecommerce marketers and operators. Read it as a shortlist filter: match the "Best for" column to your operating model first, then check pricing and rating. Pricing reflects publicly listed values as of mid-2026; several enterprise tools use quote-based pricing.
| # | Product | Best for | Key differentiation | Pricing | G2 rating |
|---|---|---|---|---|---|
| 1 | Google Analytics | Teams in the Google stack | Free, deep web and app measurement | Free; Analytics 360 contact sales | 4.5/5 |
| 2 | Shopify Analytics | Shopify-native merchants | Built-in commerce reporting | From $39/mo (with Shopify plan) | 4.4/5 |
| 3 | Adobe Analytics | Enterprise governance | Flexible segmentation and attribution | Quote-based | Not listed |
| 4 | Mixpanel | Behavioral / product analytics | Event-based journeys and cohorts | Free; Growth from $0 | 4.5/5 |
| 5 | Woopra | Customer journey analytics | Real-time customer profiles | Pro from $999/mo | 4.4/5 |
| 6 | Contentsquare | Experience analytics | Session replay and journey analysis | Free tier; quote-based paid | 4.6/5 |
| 7 | Hotjar | CRO and UX insight | Heatmaps, recordings, feedback | Free; Plus from $31/mo | 4.3/5 |
| 8 | Triple Whale | DTC attribution | Blended ROAS and ad performance | Free; Foundation from $219/mo | 4.5/5 |
| 9 | Glew | Omnichannel reporting | Commerce data consolidation | Trial; custom pricing | 4.0/5 |
| 10 | Improvado | Unified marketing data | 500+ connectors to warehouses | Quote-based | 4.4/5 |
Best ecommerce analytics tools for 2026
1. Google Analytics
Where GA4 fits best is top-of-funnel and mid-funnel measurement, understanding which channels bring traffic, how that traffic behaves, and where conversions happen. Its predictive capabilities and privacy-safe modeling have improved its forward-looking insight, useful as third-party cookies fade.
Best for: Teams that want free or enterprise-grade website and app measurement from a Google-native platform.
Key strengths
- Predictive capabilities: Forecast purchase probability and churn risk from behavioral signals.
- Proactive insights: Surface anomalies and trends automatically without building every report.
- Privacy-safe modeling: Fill measurement gaps as cookie tracking declines.
Why choose Google Analytics: It is the most accessible entry point into analytics for ecommerce and the common denominator most other tools integrate with. Many teams keep GA4 as their measurement foundation and layer behavioral or attribution tools on top, since GA4 answers "what happened" cleanly but often needs support for "why" and "what to fund next."
Google Analytics pricing: GA4 properties are provided free of charge. Analytics 360, the enterprise version, requires contacting Google sales for a custom contract. There is no public numeric price for the 360 tier.
2. Shopify Analytics
For merchants who want quick operational insight without standing up a separate analytics stack, this is the fastest path. You see purchase trends, top products, and customer reporting directly inside the platform you already manage your store from.
Best for: Merchants who want built-in commerce analytics inside Shopify.
Key strengths
- Pre-built commerce reports: Sales, product, and customer reports ready out of the box.
- Custom dashboards and report creation: Build views tailored to your KPIs.
- Real-time monitoring and Live View: Watch orders and sessions as they occur.
Why choose Shopify Analytics: For Shopify-native teams, it removes the friction of integration entirely. The numbers come straight from your store of record, so there is no sync to question. Teams often pair it with a behavioral or attribution tool once they need cross-channel ROI, but for core commerce reporting it covers the essentials without extra cost or configuration.
Shopify Analytics pricing: Analytics is included with your Shopify subscription rather than sold separately. Shopify plans start at Basic ($39/mo), Grow ($105/mo), and Advanced ($399/mo), billed monthly, with Plus starting at $2,300/mo. Higher tiers unlock deeper reporting.
3. Adobe Analytics
Where it exceeds lighter platforms is in the depth of what you can slice. You can build segments across dozens of dimensions, run advanced attribution models, and govern data access across large, distributed teams. That power is the point, and the reason large retailers standardize on it.
Best for: Large organizations needing enterprise-grade web and mobile analytics with attribution and governance.
Key strengths
- Deep, flexible segmentation: Build granular audiences across many dimensions.
- Journey analysis across digital channels: Trace customer paths from first touch to purchase.
- Advanced reporting and attribution: Run sophisticated, custom attribution models.
Why choose Adobe Analytics: It suits teams that have outgrown self-serve tools and need governance, scale, and analytical depth. The tradeoff is complexity and cost, which is why it lands with enterprise rather than scrappy startups. If you have an analyst team and reporting requirements that span product lines and regions, the depth pays off.
Adobe Analytics pricing: Adobe does not publish a public numeric price. Pricing is quote-based, with packages such as Select, Prime, and Ultimate available through Adobe sales. Expect enterprise contract terms.
4. Mixpanel
It shines for experimentation. With session replay and built-in experiments and feature flagging, you can run A/B tests, watch what users actually do, and iterate on the conversion path. It works best as a complement to a commerce suite rather than a standalone store-reporting tool.
Best for: Teams that need event-based product analytics with replay and experimentation.
Key strengths
- Product analytics: Event-level tracking of every action across web and mobile.
- Session replay: Watch real sessions to understand behavior behind the numbers.
- Experiments and feature flagging: Test and roll out changes with measurement built in.
Why choose Mixpanel: It answers the "why" behind conversion better than most. Growth teams use it to map funnels, isolate drop-off points, and validate experiments before scaling them. It is strongest when paired with a commerce or attribution tool, since it focuses on behavioral depth rather than revenue and inventory reporting.
Mixpanel pricing: Mixpanel offers a Free plan capped at 1M monthly events. The Growth plan starts at $0 with 1M free monthly events, then $0.28 per 1K events after. Enterprise is contact sales, and a startup program is available.
5. Woopra

It covers journey, retention, cohort, and attribution analytics, plus built-in triggers and automations that let you act on behavior, not just report it. With 50+ integrations, it slots into a broader stack and pulls touchpoints together into one customer-level view.
Best for: Teams that want end-to-end customer journey analytics with real-time activation.
Key strengths
- Real-time customer profiles: See each customer's full timeline as it happens.
- Journey, retention, cohort, and attribution analytics: Cover the full lifecycle in one tool.
- Built-in triggers and automations: Turn behavioral signals into automated actions.
Why choose Woopra: It is a fit for teams that want clearer lifecycle reporting and the ability to activate on it. Tying behavior to customer profiles helps you map the path from first visit to repeat purchase. The platform is now listed on G2 as Appier AIRIS (formerly Woopra), with a 4.4/5 rating across reviews.
Woopra pricing: Public pricing shows a Pro plan starting at $999/mo, with Enterprise priced custom. The pricing page also references a free Core option and a 30-day Pro trial.
6. Contentsquare
Its journey analysis maps how visitors move through your store and where they hesitate or abandon. That makes it strong for ecommerce optimization and customer experience work, especially for teams running continuous CRO programs at scale.
Best for: Enterprise teams analyzing web and app behavior and customer experience.
Key strengths
- Session Replay: Watch real user sessions to spot friction and confusion.
- Heatmaps: See where attention, clicks, and scrolls concentrate.
- Journey Analysis: Map full paths and identify high-drop-off steps.
Why choose Contentsquare: It bridges quantitative reporting and qualitative behavior, which is exactly what conversion teams need to decide what to fix next. The AI-powered experience layer helps prioritize the issues that cost the most revenue. It carries a strong 4.6/5 G2 rating, the highest on this list.
Contentsquare pricing: Contentsquare lists Free, Growth, Pro, and Enterprise plans across its products, though numeric prices are not publicly displayed. Paid tiers are quote-based; contact sales for current figures.
7. Hotjar
It is most often used alongside a more complete analytics stack rather than as the system of record. Where GA4 tells you a page has a high exit rate, Hotjar shows you the rage-clicks and dead zones causing it. That pairing makes it a CRO and UX team favorite.
Best for: Teams that want visual user-behavior insights and qualitative feedback in one tool.
Key strengths
- Heatmaps: Visualize clicks, scrolls, and attention on any page.
- Recordings / session replay: Watch individual sessions to diagnose friction.
- Surveys and feedback widgets: Ask visitors why directly, on-page.
Why choose Hotjar: It delivers fast qualitative insight that quantitative tools miss. When you know a checkout step underperforms but not why, Hotjar fills the gap quickly. It works best layered onto a primary analytics platform, providing the behavioral color behind the conversion rate numbers.
Hotjar pricing: Hotjar offers a free Basic plan, with paid tiers including Plus (from $31/mo), Business (from $79/mo), and Scale (from $170/mo), billed monthly. Pricing varies across its Observe, Ask, and Engage product lines.
8. Triple Whale
Its AI assistant, Moby 2, helps analyze data and surface actions, while dashboards and reports pull ad platforms and store data together. For brands optimizing daily against ad performance, that consolidation is the whole point.
Best for: Ecommerce brands that want attribution, analytics, and AI-assisted growth workflows in one platform.
Key strengths
- Multi-touch attribution and unified measurement: Tie revenue to channels, not just clicks.
- AI assistant Moby 2: Analyze data and trigger actions through an AI agent.
- Data platform with dashboards and activation tools: Centralize reporting and act on it.
Why choose Triple Whale: For DTC teams running heavy paid acquisition, it answers the question that keeps marketers up at night: which spend actually drove revenue. Pulling Meta, Google, and store data into one attribution view replaces the spreadsheet reconciliation that eats hours every week. It carries a 4.5/5 G2 rating.
Triple Whale pricing: Triple Whale offers a Free plan at $0/mo and a Foundation plan at $219/mo. Higher tiers scale with GMV and billing cadence, with prices based on a 12-month commitment. Check the pricing page for the tier matching your revenue.
9. Glew
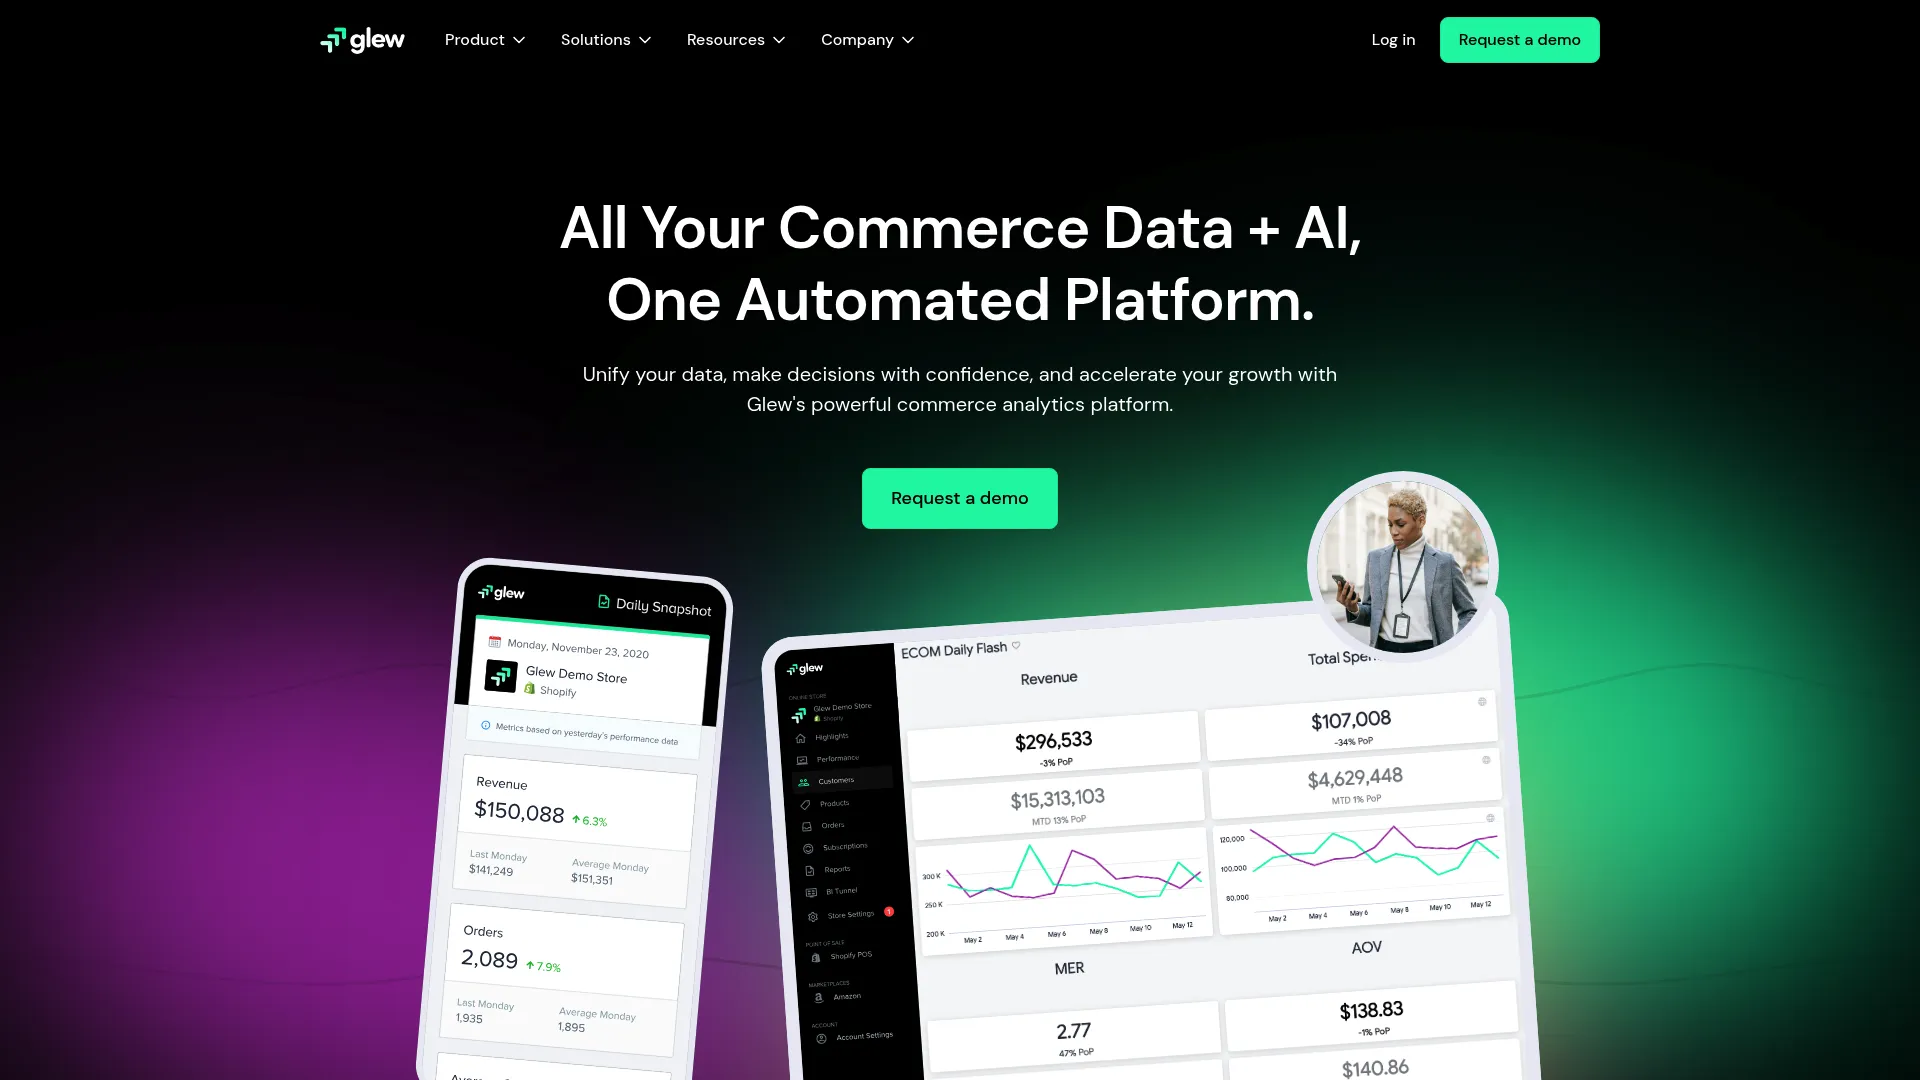
Its Daily Snapshot automated KPI reports keep teams aligned on the numbers without manual pulls, and custom reports powered by Looker give analysts room to dig deeper. For omnichannel merchants juggling several platforms, that consolidation is the draw.
Best for: Commerce teams needing unified ecommerce analytics and reporting.
Key strengths
- Daily Snapshot automated KPI reports: Get key metrics delivered automatically.
- Custom reports powered by Looker: Build deeper analyses for analyst teams.
- 170+ integrations: Consolidate data across your full commerce stack.
Why choose Glew: It is built for merchants who sell across multiple channels and need one place to see customer, inventory, and revenue data together. The automated reporting reduces manual work, and the integration breadth means you are not stitching exports by hand. It carries a 4.0/5 G2 rating.
Glew pricing: Glew lists Glew Pro and Glew Plus plans. Glew Plus is custom pricing through a quote or demo, while Glew Pro does not display a public dollar amount and requires annual prepayment. A free trial is available for Glew Pro.
10. Improvado
It suits mid-to-large marketing teams and agencies that need centralized data pipelines and attribution visibility across many sources. Where point tools each own a slice of the picture, Improvado pulls them into one governed reporting environment.
Best for: Mid-to-large marketing teams and agencies needing centralized marketing data pipelines and reporting.
Key strengths
- 500+ pre-built data sources: Connect nearly any platform without custom engineering.
- Data extraction, transformation, and loading: Pipe clean data to your warehouse.
- AI Agent and reporting dashboards: Generate insights and reports automatically.
Why choose Improvado: It directly addresses the pain at the heart of this guide: too many disconnected dashboards. If your team spends more time reconciling data than acting on it, Improvado centralizes the pipeline and gives leadership one source of truth. It carries a 4.4/5 G2 rating.
Improvado pricing: Improvado lists Growth, Advanced, and Enterprise tiers, but does not publish public prices. Pricing is quote-based and the site routes you to book a demo for current figures.
Considerations
Before you commit, run your shortlist through these criteria. The best tool is the one that fits your stack, your team, and your reporting pain, not the one with the longest feature list.
Integration depth
The right choice depends on what the tool must connect to: Shopify, Google Ads, your CRM, support tools, BI, or a warehouse. An integration existing is not the same as it working cleanly. Verify how reliable the data sync actually is, how often it refreshes, and whether the numbers reconcile with your source of record. A messy sync produces dashboards nobody trusts.
Attribution model fit
Evaluate whether the tool supports the attribution you actually need: last-click, multi-touch, blended, or custom. Attribution requirements differ across teams. A paid social team needs multi-touch and blended ROAS; an SEO or retention team cares about different signals. Match the model to your channel mix rather than accepting whatever the tool defaults to.
Reporting speed and usability
A fast dashboard is useless if nobody can read it. Assess self-serve usability for marketers, not just analysts. Can a growth marketer build the report they need without filing a ticket? Real-time data only helps if the people making decisions can interpret it without a translator. Usability often matters more than raw depth.
Behavioral depth
Decide how much sessions, heatmaps, journeys, and recordings matter to you. If conversion optimization and UX debugging are priorities, behavioral tools earn their place. If you mainly need revenue and channel reporting, you may not need session-level depth. Match behavioral capability to the questions you actually ask.
Scalability and governance
Growing teams need permissions, consistency, and a reporting model that survives more stakeholders. Consider data quality and ownership early: who controls the numbers, who can edit reports, and how access scales. A tool that works for three people can break down at thirty without governance built in.
Conclusion
The best ecommerce analytics tools come down to a simple question: what reporting pain are you solving, and where does your stack sit today?
If you want a free, capable baseline, start with Google Analytics. If you run on Shopify and want zero-setup commerce reporting, Shopify Analytics covers it. For enterprise governance and deep segmentation, Adobe Analytics is the heavyweight. When you need behavioral depth and experimentation, Mixpanel and Woopra lead. For UX and CRO insight, Contentsquare and Hotjar show you the why behind the numbers. And when attribution or tool sprawl is the problem, Triple Whale handles DTC paid performance while Improvado unifies multi-source reporting.
Most teams do not need more dashboards. They need fewer disconnected ones. Start with the tool that matches your current stack maturity and your loudest reporting pain, then layer behavioral or attribution depth as you grow. Pick the one that gets you to defensible numbers fastest, and resist adding tools until a real gap forces the decision.
FAQs
Ecommerce analytics is the practice of collecting and interpreting data across your store, marketing, and customer touchpoints to understand sales performance and customer behavior. It helps teams see what is driving revenue, where customers drop off, and which channels and campaigns actually pay back, so decisions rest on numbers rather than guesses.
It depends on your stack and maturity. Shopify-native merchants often start with Shopify Analytics, while teams in the Google ecosystem lean on GA4. As you grow, behavioral tools like Mixpanel or attribution platforms like Triple Whale add depth. The best option is the one that fits your current reporting pain, not the one with the most features.
For DTC and paid-heavy brands, Triple Whale is purpose-built for blended ROAS and multi-touch attribution. For broader multi-source attribution across many platforms, Improvado centralizes the data. Native reporting in GA4 or Shopify covers basic attribution, but dedicated tools handle complex, overlapping channel mixes far better. Choice depends on your channel complexity.
Track conversion rate, AOV, CAC, CLV, retention, and campaign ROI as your core set. Conversion rate and AOV show how well your store sells. CAC and CLV reveal whether acquisition is profitable over time. Retention shows loyalty, and campaign ROI ties marketing spend to revenue. Together they give a defensible picture of performance.
Often, yes. Many teams pair a baseline analytics platform with a behavioral or attribution tool because each answers different questions. GA4 tells you what happened, Hotjar shows why, and Triple Whale ties spend to revenue. The risk is overlapping dashboards that conflict, so consolidate where you can and add tools only when a real gap appears.
Ecommerce analytics focuses on commerce reporting: sales, products, orders, and revenue. Product analytics, like Mixpanel, focuses on behavioral journeys, cohorts, and retention at the event level. They overlap on funnels and conversion, but commerce reporting answers "what sold," while product analytics answers "why users behaved that way." Many teams use both for a complete view.
Prioritize integration depth, dashboard quality, attribution, segmentation, and real-time visibility. Verify that integrations sync cleanly, that marketers can build reports without an analyst, and that attribution matches your channel mix. Also weigh implementation speed and usability, since the fastest tool to defensible numbers is usually the right starting point for your team.
.avif)