You can't troubleshoot a pod that disappeared five minutes ago with a dashboard built for static servers. That's the core problem containerized infrastructure creates for every DevOps, SRE, and platform team running Kubernetes at scale.
Containers are ephemeral by design. They restart, reschedule across nodes, and vanish before a traditional alert even fires. According to the CNCF Annual Cloud Native Survey (2025), 82% of container users run Kubernetes in production, and 56% of organizations use containers for most or all production applications. The monitoring infrastructure beneath those workloads has to keep up.
Finding a container monitoring tool that correlates metrics, container logs, and traces without drowning a team in telemetry cost or operational overhead is the actual challenge. Most organizations report less than 50% visibility into containerized and serverless workloads, per Chronosphere's Scaling Observability and Reliability (2025).
This guide covers 14 container monitoring tools with verified pricing, G2 ratings, and practical guidance for evaluating each during a POC.
What's inside
This guide compares 14 container monitoring tools for Kubernetes, Docker, and cloud-native environments, covering open-source building blocks alongside commercial observability platforms.
- Who it's for: DevOps engineers, SREs, platform teams, cloud infrastructure leads, and presales teams supporting technical infrastructure evaluations
- Selection criteria: Visibility across metrics, logs, traces, alerts, and workload state
- Evaluation factors: Setup effort, scalability, integrations, and pricing model
- POC angle: Criteria you can turn into a validation scorecard before committing to a pilot
TL;DR
- Best overall commercial platform: Datadog for teams that want metrics, logs, traces, Kubernetes events, and alerting in one managed platform
- Best open-source metrics foundation: Prometheus for Kubernetes-native metrics collection and PromQL-based alerting
- Best visualization layer: Grafana for dashboards across Prometheus, Loki, Tempo, and other telemetry sources
- Best for runtime security plus monitoring: Sysdig for teams that need container visibility tied to security context
- Best OpenTelemetry-native option: SigNoz for teams standardizing on OpenTelemetry with an open-source backend
- Best for container management plus visibility: Portainer for teams that need Docker and Kubernetes administration with workload inspection
Use the comparison table and considerations checklist below to build a POC scorecard before any pilot commitment.
What is container monitoring software?
Container monitoring software tracks the health, performance, resource usage, logs, events, and behavior of containerized applications across Docker, Kubernetes, and other container runtime environments.
Core signals container monitoring tools collect
- CPU usage and throttling
- Memory usage and out-of-memory kills
- Network traffic, latency, and packet errors
- Container restart counts
- Pod status and deployment state
- Logs and Kubernetes events
- Application traces and service dependencies
- Error rates and response times
- Runtime security signals
- Capacity and cost data
Why containers change the monitoring problem
Containers are short-lived and often replaced before an engineer can investigate. Kubernetes adds scheduling, nodes, pods, namespaces, and controllers on top of the workload itself. A CPU spike on a host tells you little when the relevant pod has already restarted on a different node. Traditional VM-level monitoring misses that workload context entirely.
Teams need correlation across metrics, logs, traces, and Kubernetes events to investigate effectively. That correlation is what separates container monitoring from host monitoring.
Container monitoring versus container observability
Monitoring tells teams whether known systems are healthy. Observability helps teams investigate failure modes they didn't anticipate. Modern tools often combine both: Dashboards for known metrics alongside distributed tracing, anomaly detection, and flexible query languages for novel failures. OpenTelemetry has accelerated this convergence by standardizing how telemetry is collected and exported across backends.
When to use container monitoring tools
Monitor Kubernetes clusters without losing pod context
Kubernetes workloads move across nodes, restart on failure, and scale horizontally. Without a tool that tracks pod lifecycle, namespace hierarchy, deployment state, and node-level resource usage, an engineer investigating an incident is reconstructing context from incomplete logs. Choose a container monitoring tool that preserves that workload context across pod restarts and node migrations.
Investigate production incidents faster
A typical on-call workflow goes: Alert fires, engineer checks a dashboard, drills into logs or traces, identifies the failing pod or service dependency, then routes the fix. Every gap between those steps adds minutes to mean time to resolution. Container monitoring tools with correlated metrics, traces, and logs cut the investigation loop. For application performance monitoring tools that extend into infrastructure, this correlation is the core value.
Control infrastructure cost and capacity
CPU requests, memory limits, and autoscaling policies affect both reliability and cloud spend. Over-provisioned workloads waste money; under-provisioned ones cause throttling and OOM kills. Monitoring tools that surface utilization data, right-sizing recommendations, and telemetry cost drivers help teams treat observability as a cost control function, not just an uptime insurance policy. Presales teams supporting infrastructure tool evaluations should model telemetry volume and retention costs as part of the POC scorecard.
Container monitoring tools comparison
The table below covers all 14 tools with verified pricing and G2 ratings. Pricing reflects each vendor's current pricing page. Tools without a verified G2 product listing show N/A.
| # | Product | Best for | Key differentiator | Pricing | G2 rating |
|---|---|---|---|---|---|
| 1 | Datadog | Full-stack managed container observability | Unified Kubernetes, logs, traces, APM, and alerting | From $15/host/mo (Infrastructure Pro, annual) | 4.4/5 |
| 2 | Prometheus | Open-source Kubernetes metrics | Pull-based metrics, PromQL, Kubernetes-native adoption | Free and open source | 4.5/5 |
| 3 | Grafana | Visualization across multiple telemetry sources | Multi-source dashboards: Metrics, logs, and traces | Free (OSS); Cloud from $19/mo | 4.5/5 |
| 4 | New Relic | APM and infrastructure in one platform | Application traces plus infrastructure metrics together | Free tier; paid from $10/mo | 4.4/5 |
| 5 | Dynatrace | Enterprise AI-powered observability | Automated discovery and causal root cause analysis | Consumption-based; from $0.04/host-hour | 4.5/5 |
| 6 | Sysdig | Runtime security tied to container monitoring | Container visibility with security event context | Contact for quote | 4.7/5 |
| 7 | SigNoz | OpenTelemetry-native observability | Open-source metrics, traces, and logs on one platform | Free (self-hosted); Cloud from $49/mo | N/A |
| 8 | Portainer | Container management and operational visibility | Docker and Kubernetes administration with workload inspection | Free (3 nodes); paid from $1,045/yr | 4.8/5 |
| 9 | Splunk | Log-heavy enterprise observability | Log search, event analytics, and large-scale correlation | Observability Cloud from $15/host/mo (annual) | 4.4/5 |
| 10 | Elastic Observability | Search-based logs and observability | Elastic Stack for logs, metrics, traces, and APM | Consumption-based (serverless) | 4.2/5 |
| 11 | Sematext | Hosted logs and infrastructure monitoring | Unified log, metric, and event correlation at lower cost | From $1.68/host/mo; Logs from $5/mo | 4.7/5 |
| 12 | Instana | Automated application observability | Dependency mapping and automated discovery | From $0.03/MVS-hour (usage-based) | 4.4/5 |
| 13 | Zabbix | Open-source infrastructure monitoring | Traditional infrastructure monitoring extended to containers | Open source free; Cloud from $50/mo | 4.3/5 |
| 14 | OpenTelemetry | Vendor-neutral telemetry standard | Instrumentation and collection across backends | Free and open source | N/A |
Best 14 container monitoring tools for 2026
1. Datadog
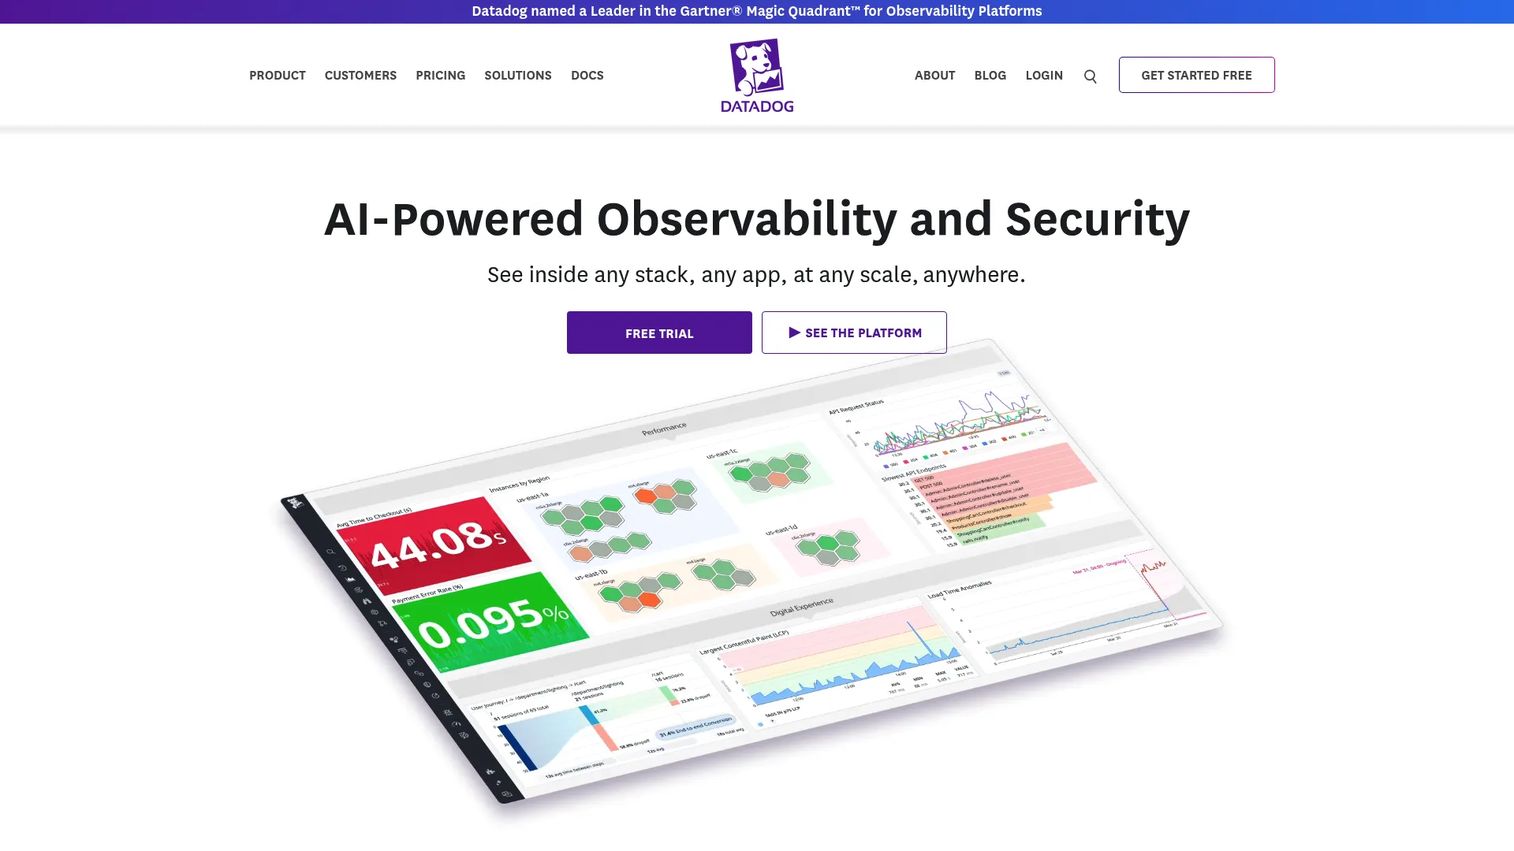
Datadog is a managed observability platform that covers container infrastructure, Kubernetes cluster monitoring, cloud services, logs, traces, APM, dashboards, and alerting without requiring teams to assemble separate open-source components. It fits organizations that want a commercial platform with broad coverage from day one. Datadog connects workload context, service maps, and infrastructure events in a single interface, which reduces the tool-switching an on-call engineer deals with during an incident.
Best for: DevOps, SRE, and platform teams that want managed, full-stack container observability across cloud and Kubernetes environments.
Key features
- Kubernetes cluster maps and pod-level metrics
- Container resource metrics with throttling and OOM visibility
- Log and trace correlation across services
- Anomaly detection and composite alerting
- Broad cloud integration library for AWS, GCP, and Azure
Why choose Datadog: Choose Datadog when your team wants to skip infrastructure assembly and start with correlated telemetry across logs, traces, and metrics. Model telemetry volume, log ingest, host count, and retention carefully before committing, as costs scale with usage.
Datadog pricing: Infrastructure Pro runs $15 per host per month billed annually, and APM starts at $31 per APM host per month billed annually. Log ingest, custom metrics, and premium features are billed separately by usage.
G2 rating: 4.4/5
2. Prometheus
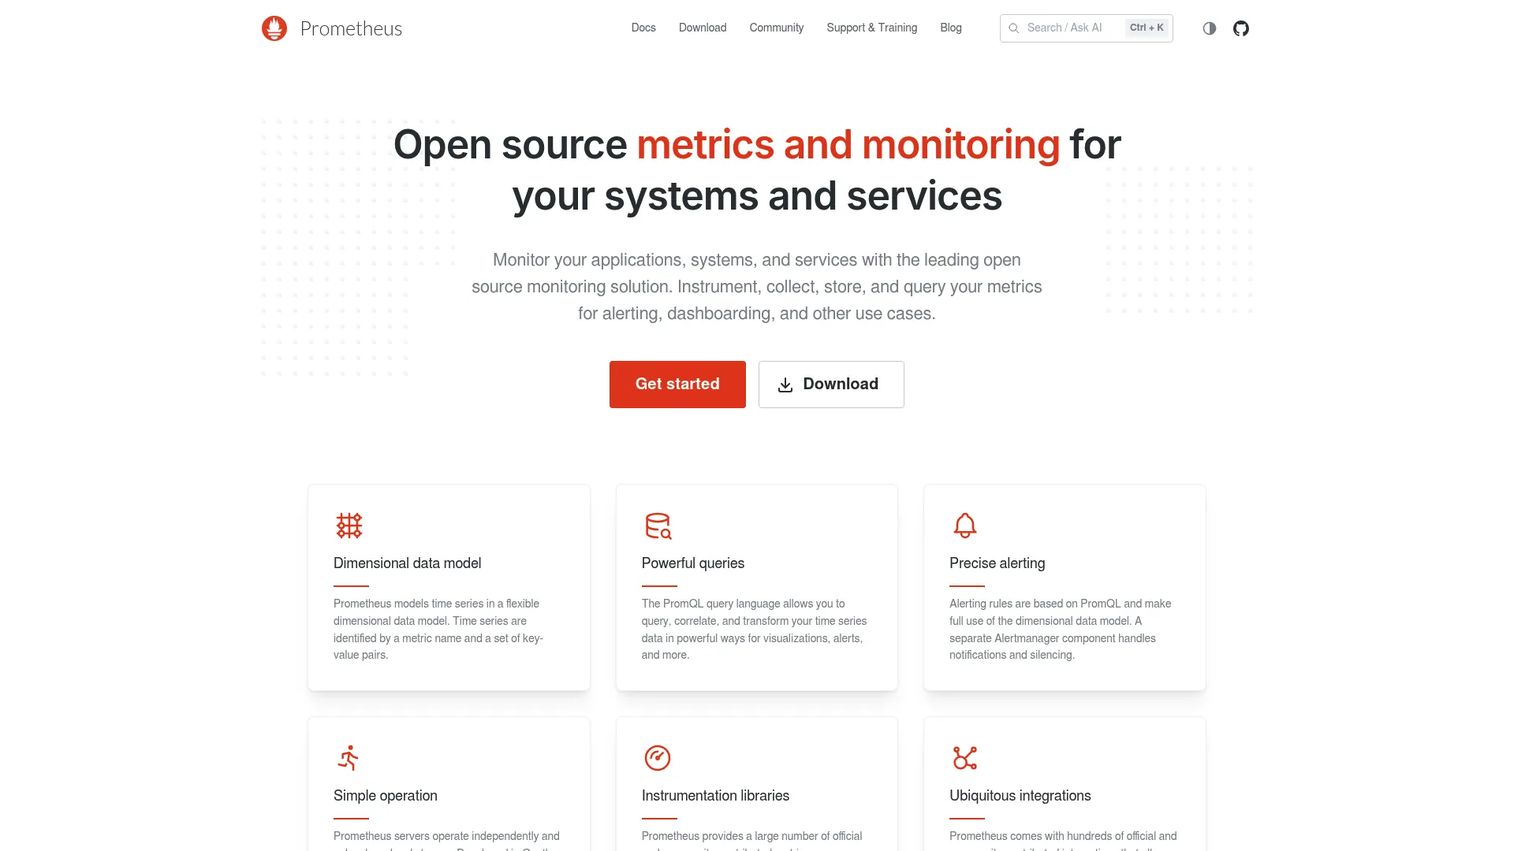
Prometheus is the open-source metrics foundation for Kubernetes and cloud-native monitoring. Its pull-based collection model scrapes targets on a defined interval, and PromQL gives engineers a flexible query language for aggregation, rate calculations, and threshold-based alerting via Alertmanager. Kubernetes service discovery makes target configuration straightforward in cluster environments. Prometheus is the most widely deployed metrics layer in the CNCF ecosystem.
Best for: Engineering teams that want an open-source metrics engine with full control over storage, scrape intervals, and alerting rules.
Key features
- Pull-based metrics collection with configurable scrape intervals
- PromQL for aggregation, rate calculations, and custom queries
- Kubernetes service discovery for automatic target management
- Alertmanager integration for routing and silencing
- Exporter ecosystem for databases, queues, and custom applications
Why choose Prometheus: Choose Prometheus when Kubernetes-native metrics and broad community adoption matter. Long-term storage, high availability, dashboards, and log aggregation require pairing it with additional components such as Grafana and Loki.
Prometheus pricing: Prometheus is free and open source. The real costs come from storage infrastructure, engineering time for setup and operations, and any managed hosting layer.
G2 rating: 4.5/5
3. Grafana
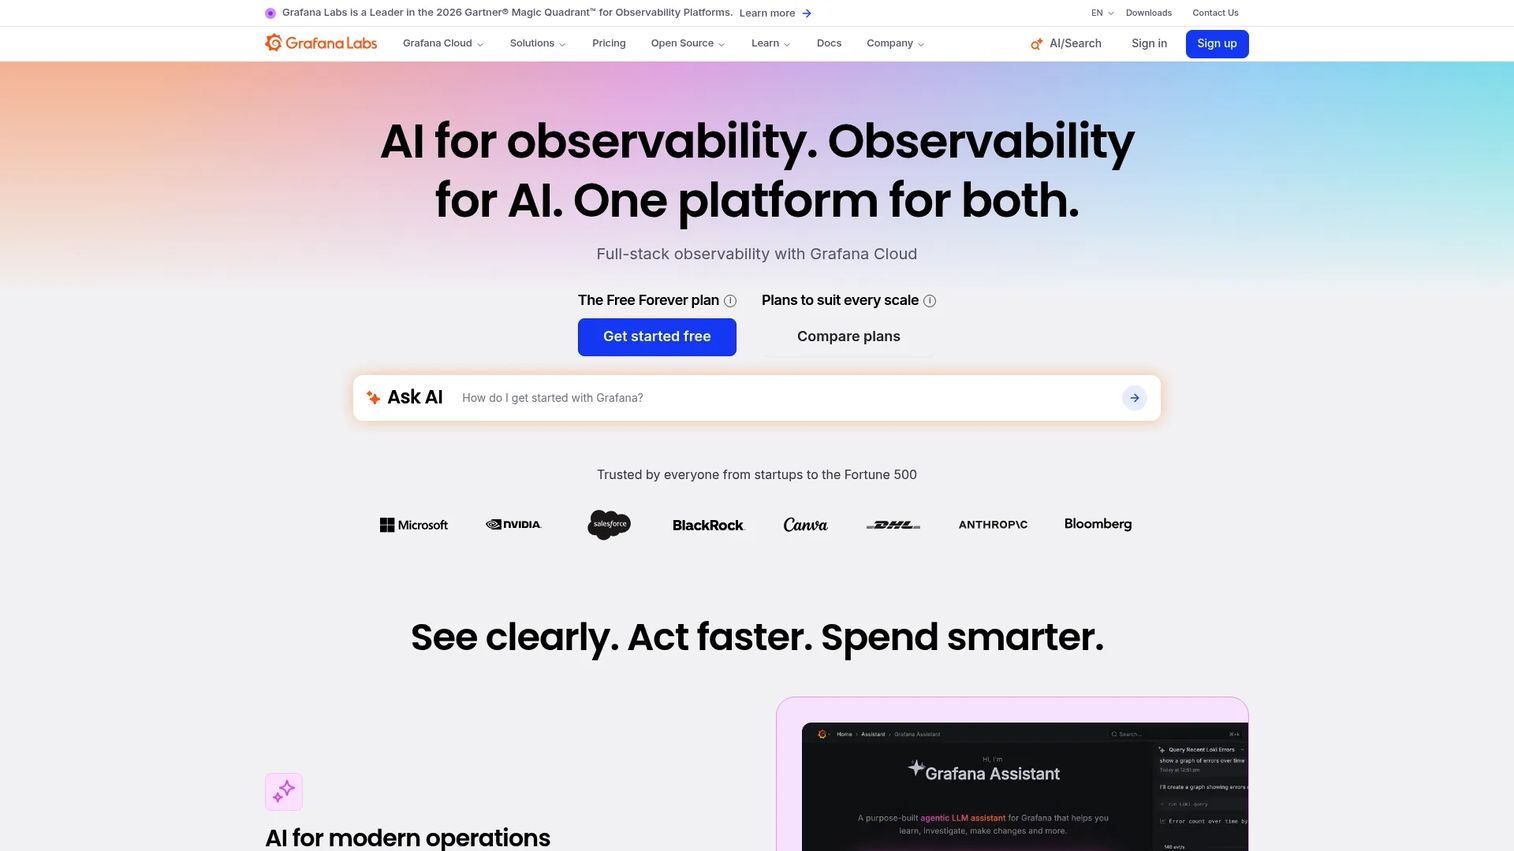
Grafana is a visualization and observability interface used alongside Prometheus, Loki, Tempo, Graphite, Elasticsearch, cloud monitoring services, and many other data sources. It is rarely deployed alone; instead, it serves as the dashboard and alerting layer on top of existing telemetry backends. Grafana dashboards for Kubernetes are well-documented and available in the community library, covering cluster health, pod metrics, node utilization, and namespace-level views.
Best for: Teams that need flexible Kubernetes dashboards across multiple telemetry sources and already have a metrics or logging backend in place.
Key features
- Multi-source dashboards across metrics, logs, and traces
- Alerting rules with routing, grouping, and notification channels
- Pre-built Kubernetes dashboards via the community library
- Loki log integration for correlated log and metric views
- Tempo distributed trace exploration
Why choose Grafana: Choose Grafana when dashboard flexibility and multi-source correlation matter more than purchasing a managed platform. The open-source edition is free and self-hosted, but the team still needs to select, configure, and operate telemetry backends.
Grafana pricing: Grafana OSS is free. Grafana Cloud has a free tier and a Pro plan starting at $19 per month plus usage-based charges for metrics, logs, and traces. Enterprise pricing starts at a $25,000 annual minimum commit.
G2 rating: 4.5/5
4. New Relic
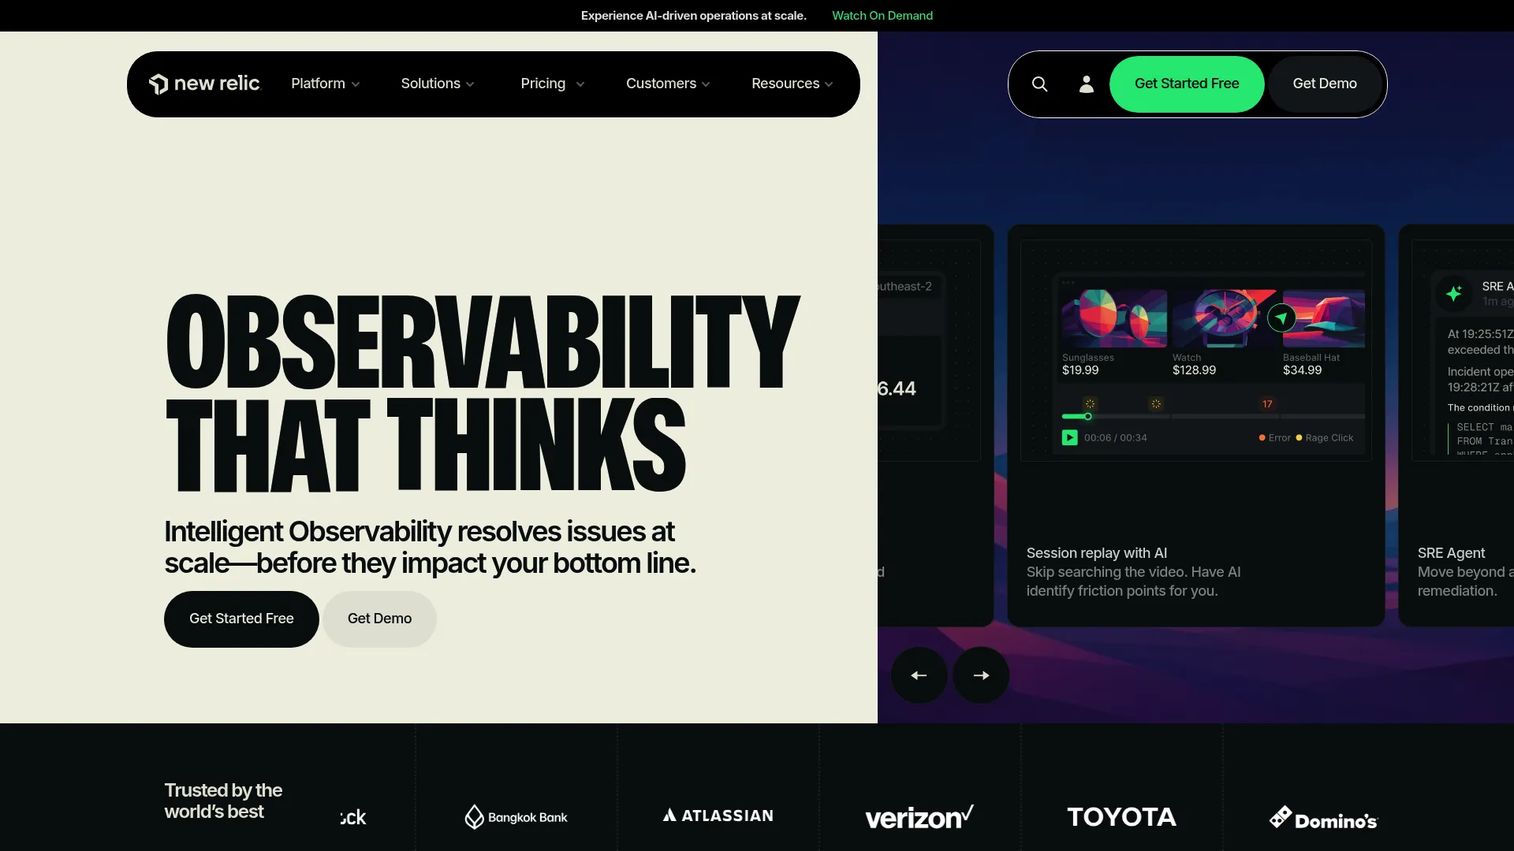
New Relic combines APM, infrastructure monitoring, log management, distributed traces, dashboards, error tracking, and alerting in a single commercial observability platform. Its Kubernetes integration surfaces pod health, node resource usage, deployment events, and cluster-level data alongside application performance. For teams where application latency and container health are evaluated together, New Relic reduces the number of tools needed in that workflow.
Best for: Teams that want application performance and container infrastructure context in the same platform without maintaining separate APM and infrastructure tools.
Key features
- Kubernetes integration with pod, node, and namespace visibility
- APM with distributed transaction traces and error rates
- Infrastructure metrics alongside application performance data
- Log management with search and alerting
- Query-based dashboards using NRQL
Why choose New Relic: Choose New Relic when application performance is as important as container health, and when the team wants both in one interface. Model pricing around data ingest volume and user count before the POC ends, as both drive cost at scale.
New Relic pricing: A free tier covers 100 GB of data ingest per month. Paid plans start at $10 per month for the first full platform user. Additional ingest runs $0.40 per GB for standard data. Pro user pricing starts at $349 per user per month on annual commitment.
G2 rating: 4.4/5
5. Dynatrace
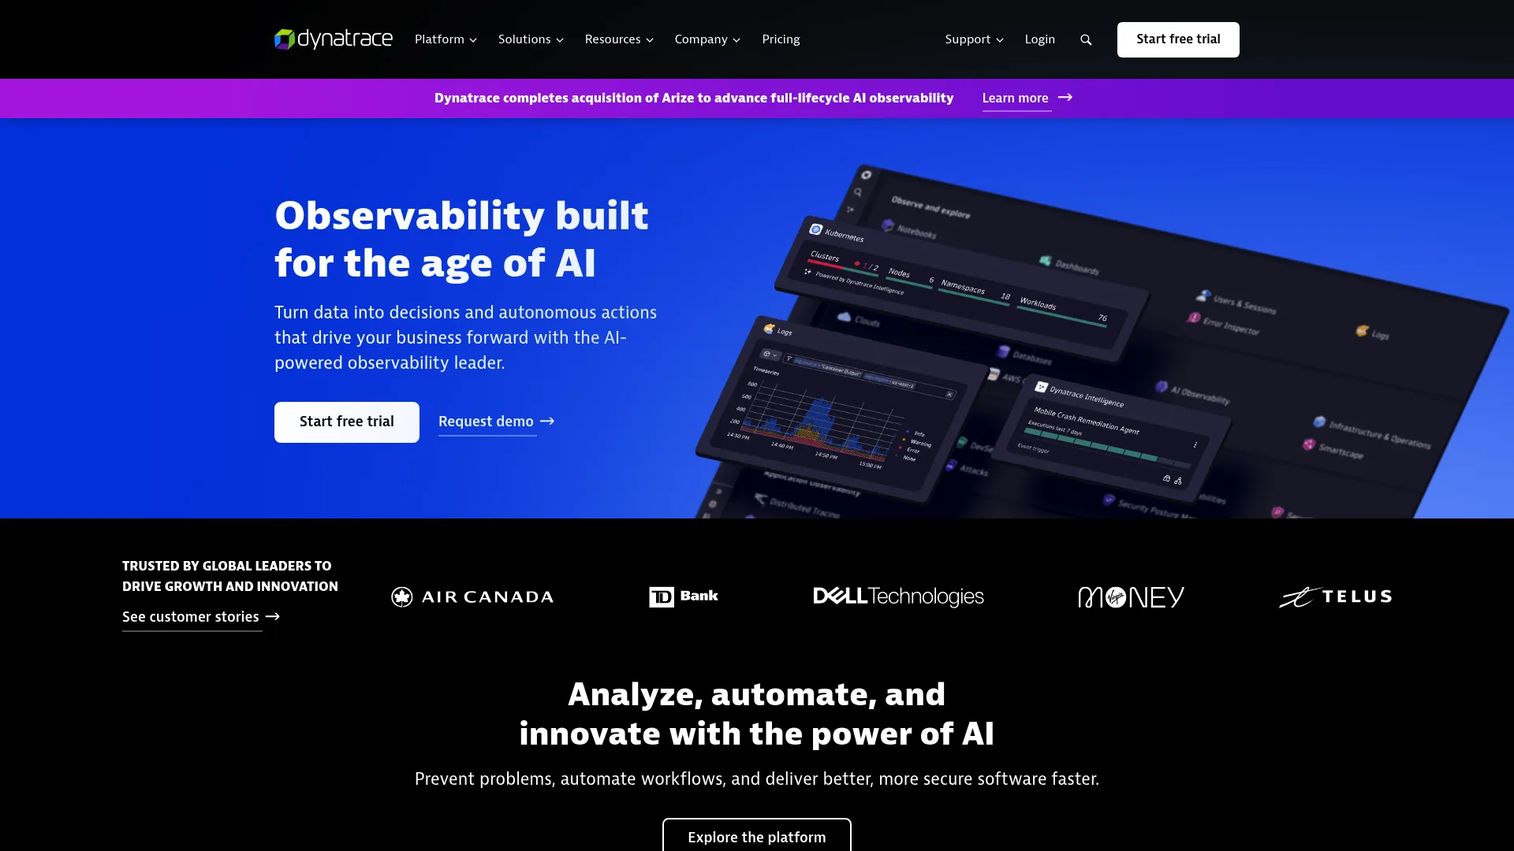
Dynatrace is an enterprise observability platform built for complex cloud-native environments. Its OneAgent automatically discovers and instruments services, containers, Kubernetes workloads, and cloud infrastructure without manual configuration. The platform's AI engine, Davis, performs causal root cause analysis and surfaces the sequence of events leading to an incident rather than listing correlating symptoms. Dynatrace also covers AI/LLM observability and security signals alongside traditional infrastructure metrics.
Best for: Enterprise teams running large Kubernetes estates who need automated discovery, dependency mapping, and AI-assisted root cause analysis.
Key features
- Automatic service discovery via OneAgent instrumentation
- Kubernetes observability with workload, pod, and namespace context
- Causal AI root cause analysis for faster incident resolution
- Code-level diagnostics and distributed tracing
- Security context and vulnerability signals alongside monitoring data
Why choose Dynatrace: Choose Dynatrace when the environment is too large or dynamic for manually assembled dashboards to stay current. Validate pricing units, platform modules, and deployment model during the pilot, since consumption-based billing requires careful capacity planning.
Dynatrace pricing: Infrastructure monitoring runs $0.04 per host-hour. Real user monitoring starts at $0.00225 per session. A 15-day free trial is available. Overall cost depends on the mix of capabilities used.
G2 rating: 4.5/5
6. Sysdig
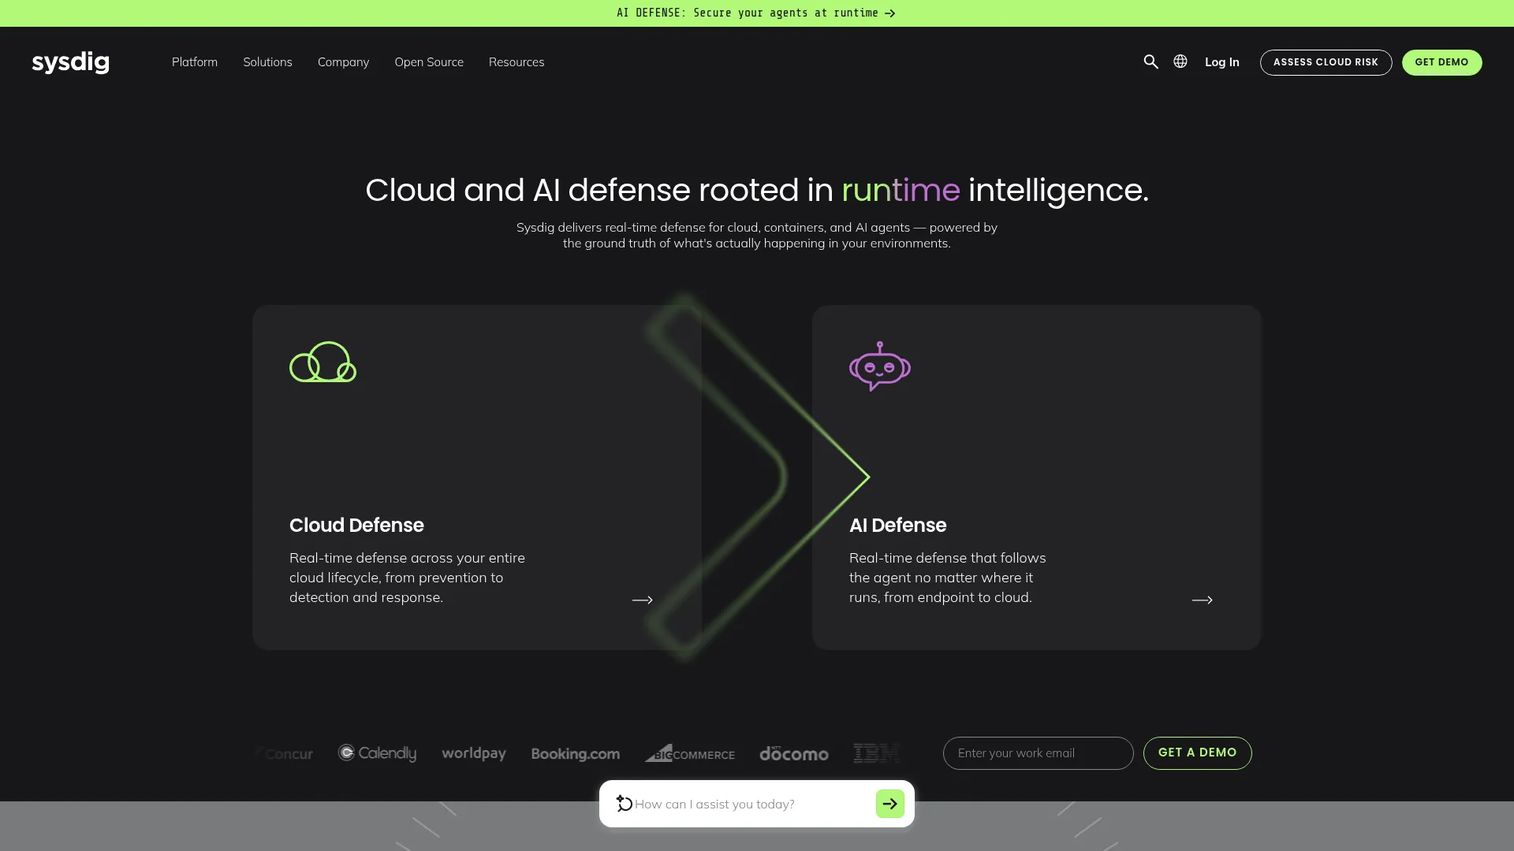
Sysdig is a container and Kubernetes monitoring platform with deep roots in runtime security. It surfaces container performance metrics alongside runtime threat detection, vulnerability management, cloud posture data, and compliance reporting in a unified interface. Sysdig also offers managed Prometheus monitoring, giving teams Prometheus-compatible metrics collection without the operational overhead. For security engineers who need container visibility tied to risk context, Sysdig keeps those signals in the same place as performance data.
Best for: Teams that evaluate container monitoring and container security together, and want a single platform for both reliability and runtime risk signals.
Key features
- Runtime threat detection and container security event monitoring
- Kubernetes workload and pod-level performance metrics
- Managed Prometheus monitoring with PromQL support
- Vulnerability management with risk prioritization
- Compliance reporting and cloud posture visibility
Why choose Sysdig: Choose Sysdig when the security team and the platform team share responsibility for containerized workloads. Teams focused only on basic performance metrics may find the full platform broader than their immediate need.
Sysdig pricing: Pricing requires requesting a quote from Sysdig directly. The official pricing page does not display a starting figure.
G2 rating: 4.7/5
7. SigNoz
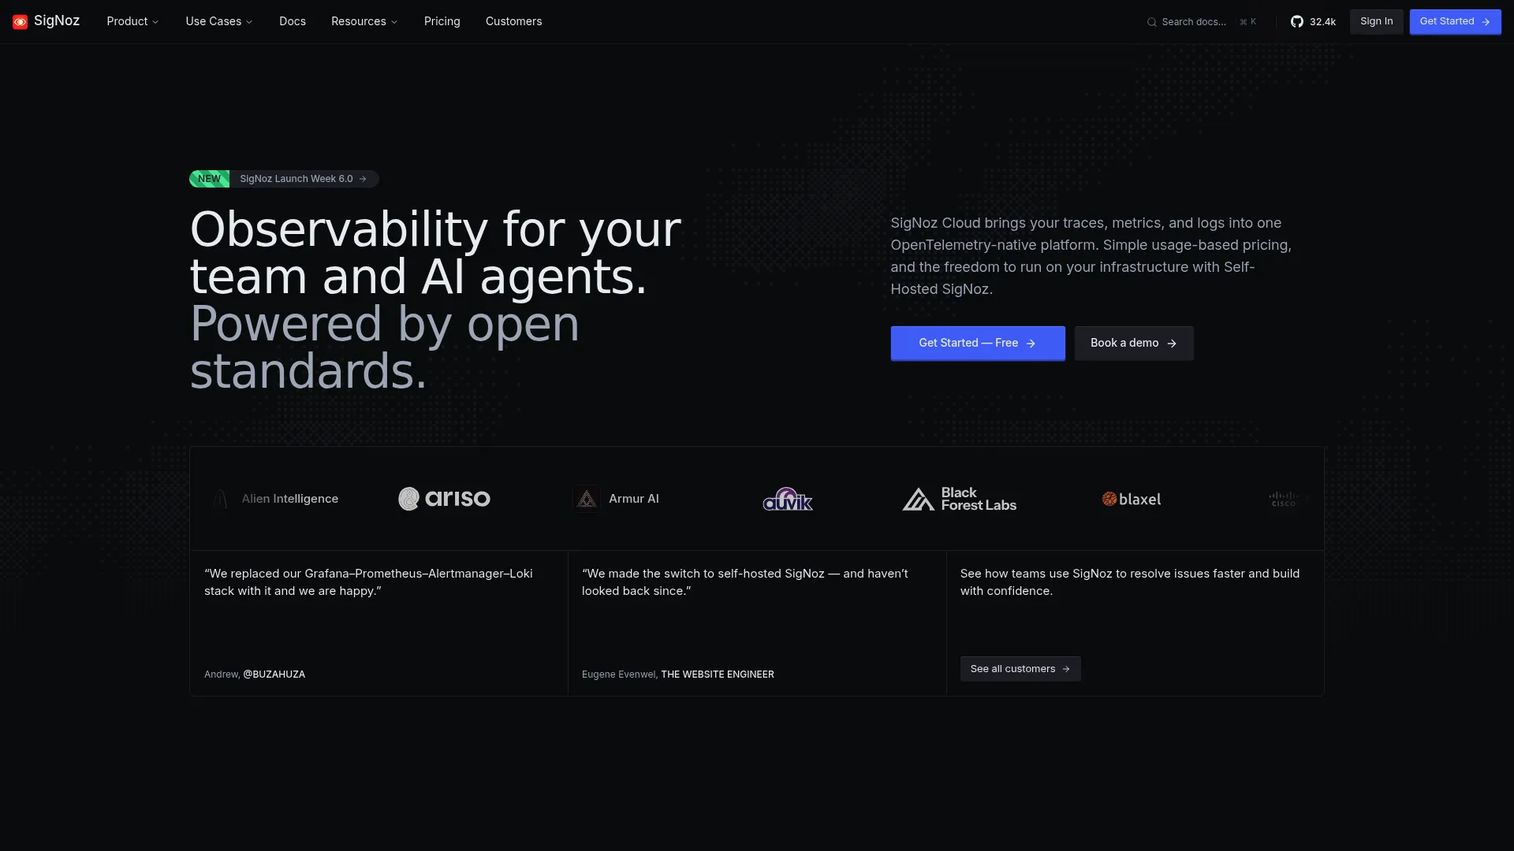
SigNoz is an open-source, OpenTelemetry-native observability platform covering metrics, logs, traces, exceptions, dashboards, and alerting. It ingests data in the OpenTelemetry Protocol natively, which means teams standardizing on OpenTelemetry can send data to SigNoz without additional translation layers. The self-hosted community edition has no license cost, while the cloud version provides a managed option for teams that want less operational overhead. SigNoz is a practical alternative for teams looking to avoid vendor lock-in while keeping observability data under their control.
Best for: Engineering and platform teams standardizing on OpenTelemetry and wanting an open-source observability platform for metrics, traces, and logs together.
Key features
- Native OpenTelemetry Protocol ingestion across signals
- Distributed tracing with service dependency views
- Metrics dashboards with threshold and anomaly alerting
- Log management with search and correlation
- Query Builder for custom analysis and dashboards
Why choose SigNoz: Choose SigNoz when OpenTelemetry is central to your telemetry strategy and you want to avoid backend vendor lock-in. Self-hosted teams still need to plan storage, scaling, and upgrade operations.
SigNoz pricing: The self-hosted Community Edition carries no license cost. The cloud Teams plan starts at $49 per month, with additional usage at $0.30 per GB for logs and traces and $0.10 per million metric samples. Enterprise starts at $4,000 per month.
8. Portainer
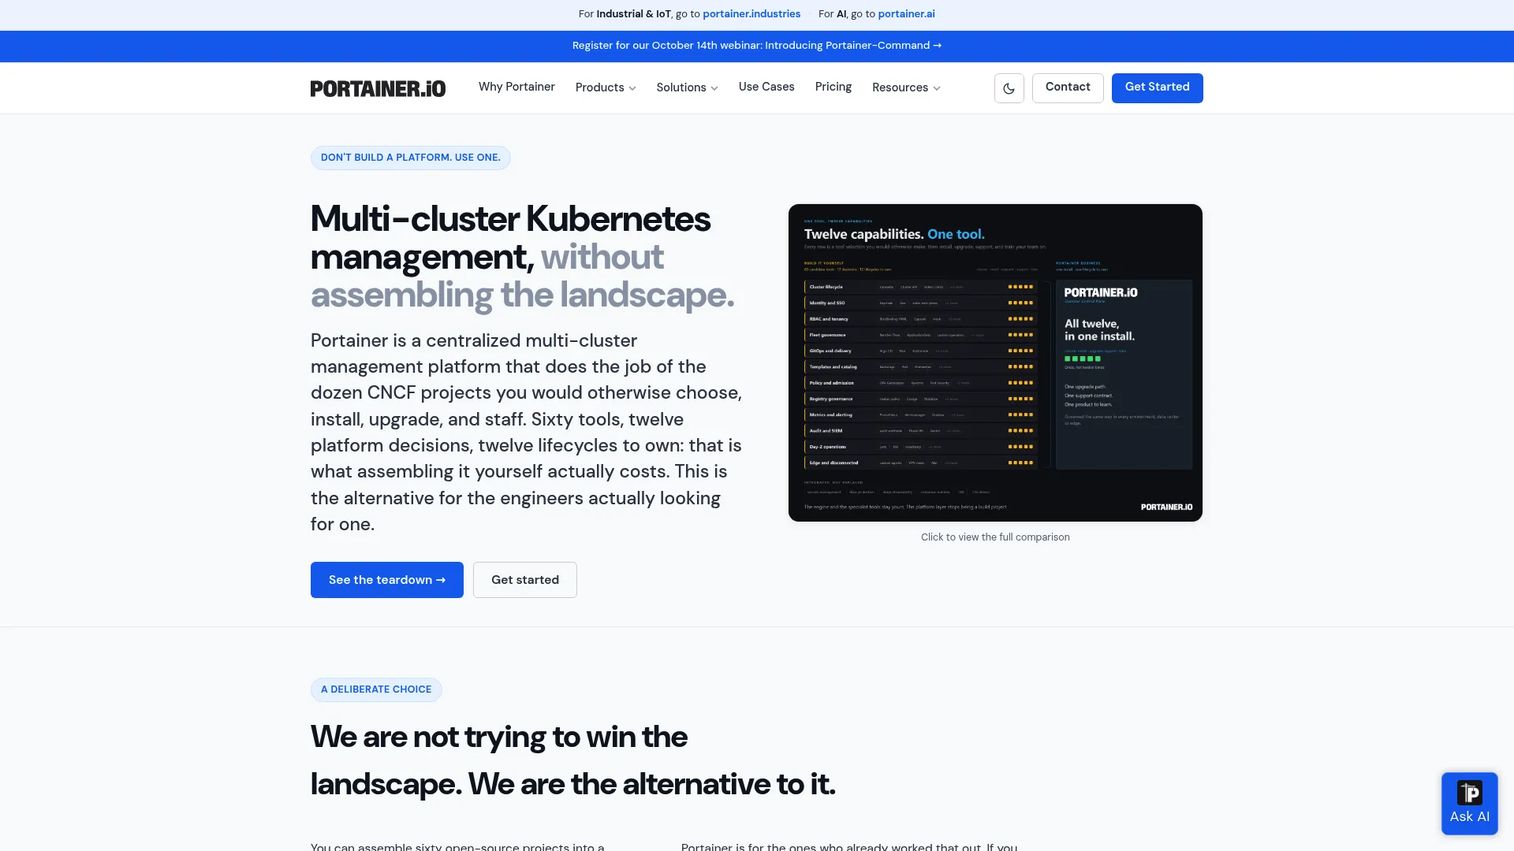
Portainer is a container management control plane for Docker and Kubernetes environments. It is not a pure observability suite; instead, it gives teams practical operational visibility into workloads, container logs, console access, RBAC, and environment governance from a single web interface. DevOps and platform teams running mixed Docker and Kubernetes fleets use Portainer to reduce direct CLI access and standardize deployment workflows. Its fit for monitoring is strongest at the workload inspection layer rather than at the metrics or tracing layer.
Best for: Teams that need centralized container administration and governance alongside practical workload inspection for Docker and Kubernetes environments.
Key features
- Multi-cluster management for Docker and Kubernetes fleets
- Container log access and console from the browser interface
- Role-based access control and environment governance
- GitOps deployment workflows with webhook support
- Kubernetes workload, volume, and networking management
Why choose Portainer: Choose Portainer when container operations and administration matter as much as observability. Teams needing distributed traces, long-term metrics retention, or anomaly detection will pair it with a dedicated observability platform.
Portainer pricing: Business Edition is free for up to 3 nodes. The Starter plan runs $1,045 per year, and Scale runs $2,095 per year. Enterprise pricing is custom.
G2 rating: 4.8/5
9. Splunk
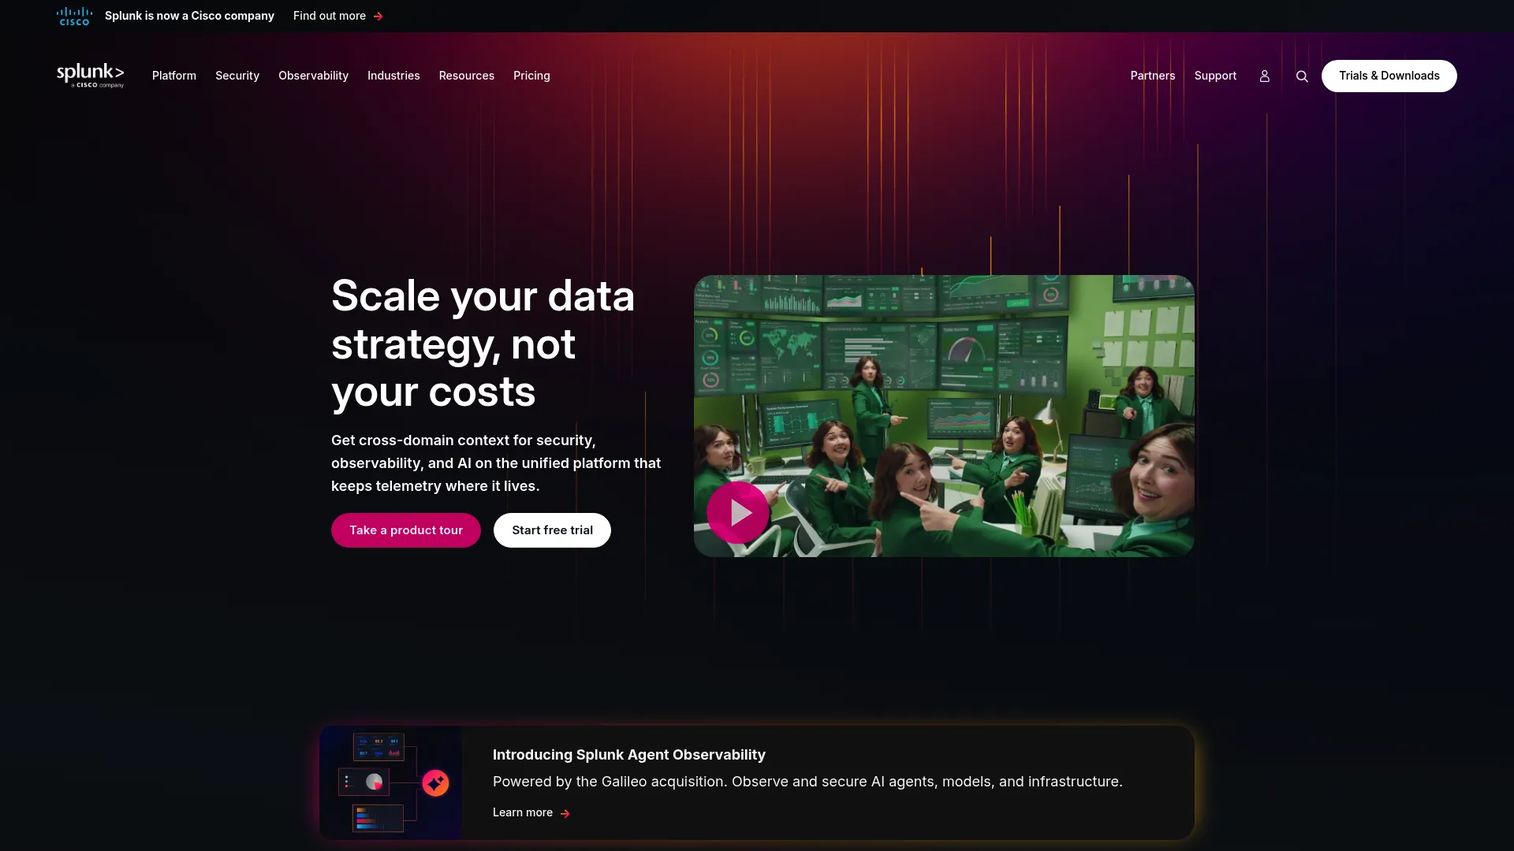
Splunk is an enterprise platform for log search, event analytics, observability, and security operations. Its Observability Cloud covers container and Kubernetes infrastructure monitoring, APM traces, real user monitoring, and synthetic monitoring alongside Splunk's core log analytics capabilities. For organizations where container monitoring must fit inside a broader enterprise logging or security operations model, Splunk connects those surfaces. Its search-based analysis is particularly strong for high-volume log environments and complex event correlation.
Best for: Enterprises that rely on log search and event analytics as the backbone of their observability and security operations workflows.
Key features
- Log search and analytics across high-volume container environments
- Kubernetes and infrastructure metrics via Observability Cloud
- APM with distributed traces and service health
- Alerting with customizable routing and automated actions
- Incident investigation workflows for on-call teams
Why choose Splunk: Choose Splunk when container monitoring needs to live inside a larger enterprise logging or security operations model. Cost modeling matters: Ingest volume, retention, and host count all drive pricing, so plan those numbers before the POC ends.
Splunk pricing: Splunk Observability Cloud Infrastructure starts at $15 per host per month billed annually. App and Infra combined starts at $60 per host per month. End-to-end observability starts at $75 per host per month. The Splunk Platform itself uses quote-based ingest or workload pricing.
G2 rating: 4.4/5
10. Elastic Observability
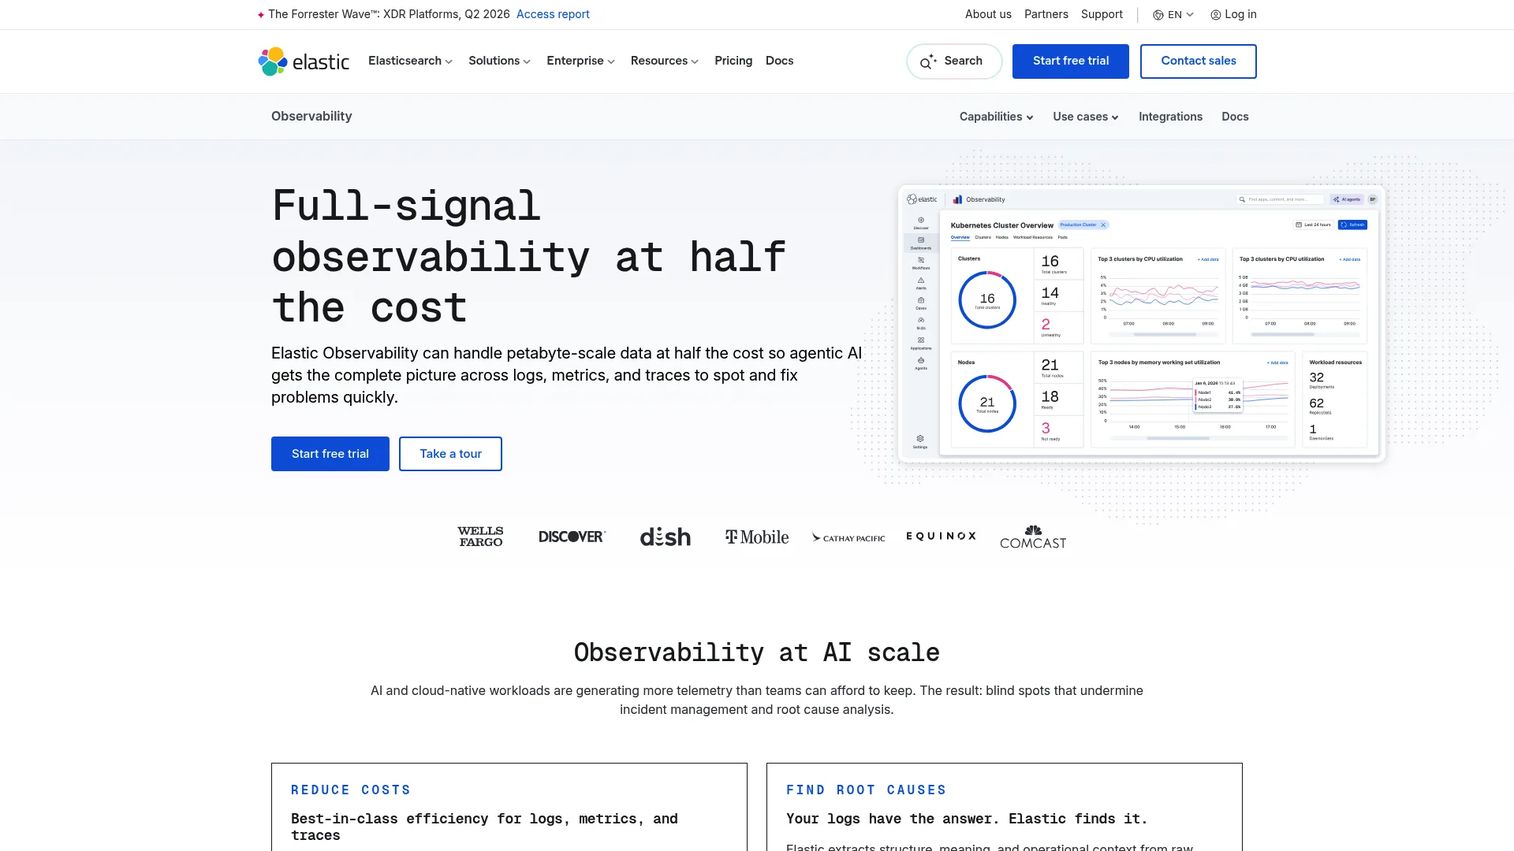
Elastic Observability is the observability layer built on the Elastic Stack, covering logs, metrics, traces, APM, uptime monitoring, digital experience monitoring, and Kubernetes infrastructure visibility. Teams already using Elasticsearch and Kibana for log analysis find Elastic Observability a natural extension into APM and infrastructure context. OpenTelemetry support and Elastic Agent integrations make telemetry collection flexible across containerized and hybrid environments. For presales teams at companies selling application security testing software or adjacent infrastructure tools, Elastic's search-based model is a common buyer reference point.
Best for: Teams invested in the Elastic Stack that want to extend from log analytics into full container and application observability.
Key features
- Logs, metrics, and APM traces on the Elastic Stack
- Kubernetes and cloud infrastructure integration via Elastic Agent
- OpenTelemetry support for vendor-neutral telemetry ingestion
- Kibana dashboards with alerting and anomaly detection
- Service-level objectives and LLM observability
Why choose Elastic Observability: Choose it when log search and flexible analysis are already central to your team's workflow. Self-managed deployments need careful storage and cluster operations planning; Elastic Cloud reduces that burden with consumption-based serverless options.
Elastic Observability pricing: Elastic Observability Serverless uses consumption-based billing with no single publicly displayed starting price. Costs depend on data ingest, storage, and usage. A self-managed option is available for teams that run their own Elasticsearch clusters.
G2 rating: 4.2/5
11. Sematext
Sematext is a full-stack hosted monitoring and logging platform covering infrastructure metrics, container and Kubernetes monitoring, log management, distributed traces, real user monitoring, and synthetic monitoring. It works well for DevOps and engineering teams that want practical log and metric coverage without deploying a full enterprise observability stack. The pricing model is usage-metered with low entry points, and a 14-day free trial requires no credit card. For small and mid-market teams, Sematext reduces platform complexity while still correlating metrics, logs, traces, and events.
Best for: Small and mid-market teams that need hosted container monitoring and log management without the cost or operational overhead of larger enterprise platforms.
Key features
- Container and Kubernetes monitoring with dashboards and alerting
- Centralized log management with search and correlation
- OpenTelemetry-based distributed tracing
- Real user and synthetic monitoring for application health
- Metric, log, trace, and event correlation in one interface
Why choose Sematext: Choose Sematext when the team wants practical observability coverage at a lower entry cost. Very large enterprises should validate governance, multi-tenant controls, and ecosystem depth before committing.
Sematext pricing: Infrastructure monitoring starts at $1.68 per host per month. Logs Basic starts at $5 per month. A 14-day free trial is available with no credit card required.
G2 rating: 4.7/5
12. Instana
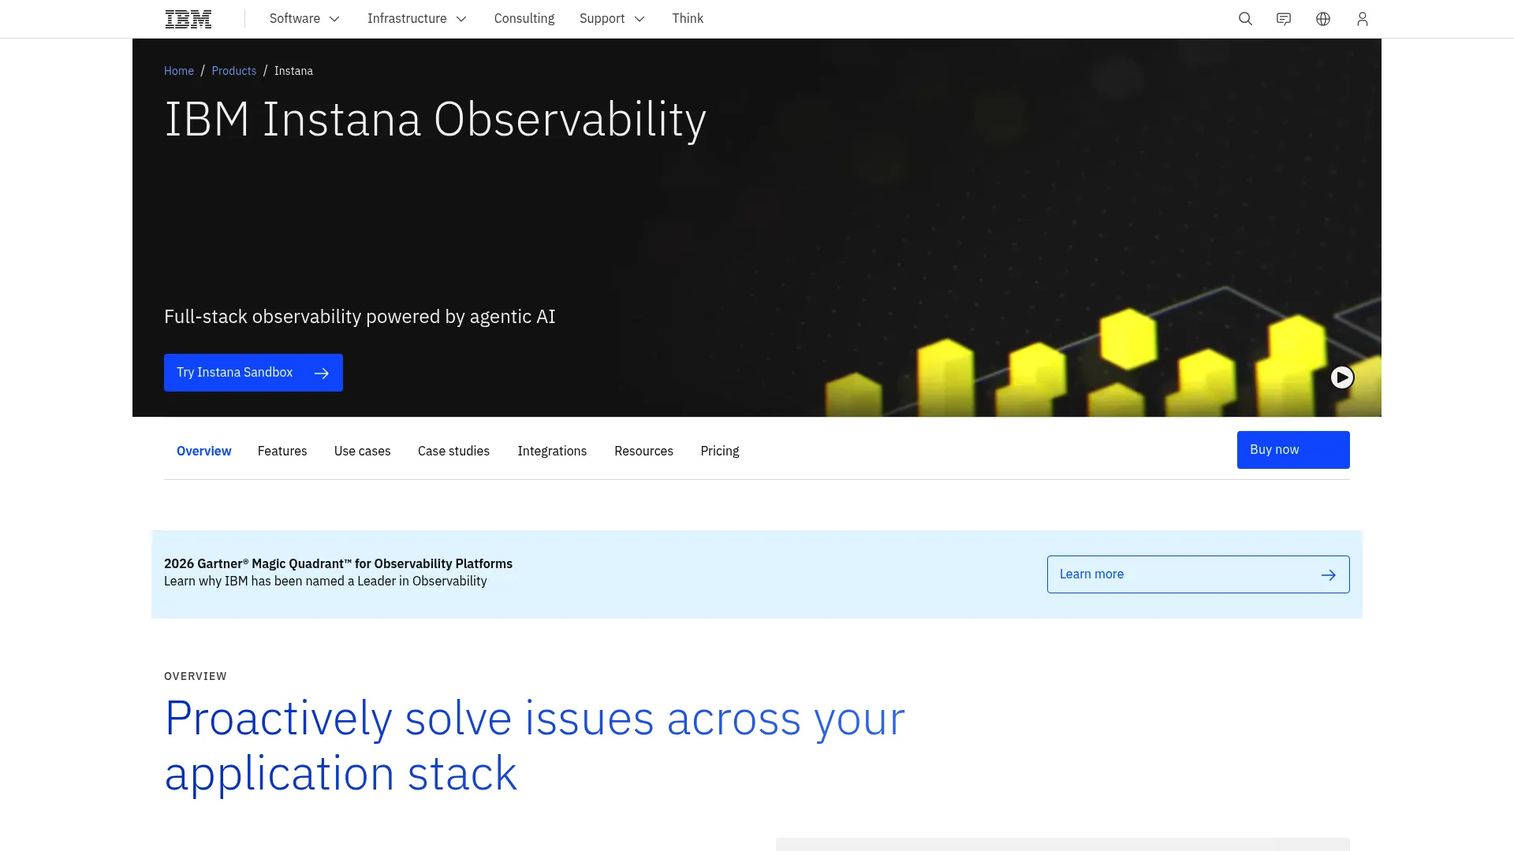
IBM Instana is an automated full-stack observability platform focused on application performance, real-time dependency mapping, and dynamic environment discovery. Instana's agent automatically discovers and instruments containerized services, microservices, databases, and infrastructure without requiring manual configuration of every component. For teams running complex microservices architectures in Kubernetes, automated discovery reduces the time to get meaningful dependency maps. Its agentic AI incident investigation provides root cause analysis and intelligent remediation guidance.
Best for: DevOps and platform teams that need automated service discovery and real-time application dependency visibility across complex containerized environments.
Key features
- Automatic discovery and real-time dependency mapping
- Kubernetes and container performance monitoring
- Distributed APM traces with root cause analysis
- Log management and unbounded log analytics
- Agentic AI incident investigation and remediation guidance
Why choose Instana: Choose Instana when understanding service relationships quickly matters more than building those maps manually. Validate the pricing model, deployment option (SaaS or self-hosted), and integration fit during the pilot.
Instana pricing: Usage-based PayPerUse starts at $0.03 per MVS hour per month. The SaaS plan starts at $21.20 per MVS per month. A self-hosted annual subscription starts at $385.20 per MVS per year. A 14-day free trial is available.
G2 rating: 4.4/5
13. Zabbix
Zabbix is an open-source infrastructure monitoring and observability platform that covers servers, networks, applications, cloud environments, and container workloads through agents, templates, integrations, and custom configuration. It supports SNMP, IPMI, JMX, VMware, HTTP, Prometheus metrics ingestion, and agent-based collection, giving teams flexibility in how they gather data from heterogeneous environments. For Docker monitoring and basic container health tracking, Zabbix templates and integrations extend its traditional infrastructure strengths into containerized workloads.
Best for: Teams that want a self-hosted open-source monitoring platform with broad infrastructure coverage and prefer operational control over a managed service.
Key features
- Open-source infrastructure and container monitoring
- Pre-built templates for servers, networks, and applications
- Flexible alerting engine with threshold and anomaly detection
- Agent-based and agentless collection methods
- Zabbix API and ITSM integrations for existing workflows
Why choose Zabbix: Choose Zabbix when traditional infrastructure monitoring, cost control, and self-hosted ownership matter. Container-native workflows, particularly deep Kubernetes observability, may require more configuration work compared to Kubernetes-first tools.
Zabbix pricing: The Zabbix on-premise software is free and open source. Zabbix Cloud starts at $50 per month for the Nano tier. Paid support subscriptions start at €245 per month billed annually for Silver.
G2 rating: 4.3/5
14. OpenTelemetry
OpenTelemetry is a vendor-neutral, open-source observability framework and toolkit for generating, collecting, processing, and exporting telemetry data: Metrics, logs, traces, and context propagation. It is not a full monitoring product by itself. OpenTelemetry supplies instrumentation libraries, language-specific SDKs, and the OpenTelemetry Collector, which receives telemetry from instrumented services and exports it to backends including Grafana, SigNoz, Elastic, Datadog, New Relic, or others. For CI/CD tools and pipeline observability use cases, OpenTelemetry's Kubernetes Operator and receivers make it the standard telemetry layer in cloud-native stacks.
Best for: Engineering and platform teams seeking vendor-neutral, open-source instrumentation and telemetry pipelines that send data to any compatible backend.
Key features
- Vendor-neutral instrumentation with automatic and zero-code options
- OpenTelemetry Collector for receiving, processing, and exporting telemetry
- Language-specific APIs and SDKs across major programming languages
- Kubernetes Operator and receivers for pod and node telemetry
- Backend-agnostic pipelines using the OpenTelemetry Protocol
Why choose OpenTelemetry: Choose OpenTelemetry when portability and standardization matter more than buying into a single vendor's data format. Teams still need to choose storage backends, dashboards, alerting, and incident workflows to complete the observability stack.
OpenTelemetry pricing: OpenTelemetry is free and open source. Costs come from the backend, infrastructure, storage, and operations model the team selects.
Considerations when choosing container monitoring tools
Match the tool to your container runtime
A tool that handles Docker logs well may not address Kubernetes workload state, namespace hierarchy, or scheduler events. Clarify whether your environment is Docker only, managed Kubernetes (EKS, GKE, AKS), self-managed Kubernetes, serverless containers, or a mix. Each adds context requirements that narrow the shortlist before a POC begins.
Decide between open-source and managed observability
Open-source tools like Prometheus, Grafana, SigNoz, and Zabbix give you control and avoid subscription costs, but you own storage, scaling, upgrades, and alert tuning. Managed platforms like Datadog, New Relic, and Dynatrace reduce that maintenance overhead, but introduce subscription and telemetry cost at scale. Neither option is automatically cheaper: Compare license cost against engineering time and infrastructure spend for each.
Test metrics, logs, and traces together before deciding
A dashboard showing CPU usage is not enough for incident investigation. During a POC, test whether the tool connects a resource spike to correlated logs, application traces, deployment events, and Kubernetes context. Run a noisy workload, force a pod restart, and measure how quickly an engineer can reach the root cause. For API monitoring tools, this correlation often matters most at the service boundary.
Model the full cost before the POC ends
Telemetry costs in commercial platforms depend on host count, container count, custom metrics volume, log ingest rate, trace volume, user seats, retention period, and any premium features. Build a cost model using realistic workload numbers before signing a contract. Presales teams should turn this into a POC scorecard: If the buyer can't answer these questions, the evaluation isn't finished.
Validate security and governance requirements
Check for RBAC, SSO, audit logs, data retention controls, and access management. For teams evaluating container security alongside monitoring, confirm whether the tool covers runtime security signals, vulnerability context, or compliance reporting. Reach out to the vendor's security team for documentation. Container monitoring visibility does not make a deployment compliant with any regulatory framework.
Conclusion
The right container monitoring tool depends on your team's operational maturity, Kubernetes adoption depth, open-source appetite, and cost tolerance.
Datadog, New Relic, Dynatrace, Splunk, and Elastic Observability fit teams that want broad commercial observability platforms with managed infrastructure and unified telemetry. Prometheus, Grafana, SigNoz, Zabbix, and OpenTelemetry fit teams with stronger open-source skills or vendor-neutral goals who are willing to own the operational layer. Sysdig leads when container monitoring and runtime security overlap. Portainer is the right choice when container operations and day-to-day administration matter alongside workload inspection. Sematext and Instana are practical options for teams with specific hosted monitoring or automated discovery requirements.
Before picking a winner, run the POC with real workloads, noisy deployments, and pod restarts. Test alert routing, cost forecasting, and RBAC under realistic conditions.
If your team sells infrastructure or developer tools, buyers in these evaluations need to understand complex workflows before they trust the platform. Use interactive product experiences to show technical value without rebuilding a live environment for every conversation.
Start your journey with Guideflow today!
FAQs
Container monitoring tools track the health, performance, resource usage, logs, events, and behavior of containerized applications across Docker, Kubernetes, and other container runtime environments. They collect signals such as CPU usage, memory consumption, restart counts, pod status, application traces, and network metrics. Alerting, dashboards, and incident investigation workflows are typically included alongside data collection.
Core container metrics include CPU usage and throttling, memory usage and out-of-memory kill events, network traffic and latency, container restart counts, and error rates. Kubernetes teams should also monitor pod status, deployment state, node resource utilization, namespace-level resource quotas, and cluster events. Application-level metrics such as request latency and trace latency add context that infrastructure metrics alone can't provide.
Prometheus and Grafana together form the most widely used open-source Kubernetes monitoring foundation, covering metrics collection and dashboards. For managed commercial platforms, Datadog, New Relic, and Dynatrace each combine Kubernetes visibility with APM traces and alerting in one interface. Sysdig adds runtime security context. The best fit depends on whether the team prioritizes open-source control, managed convenience, or security integration.
Container monitoring tracks individual container runtime behavior: Resource usage, restarts, logs, and health. Kubernetes monitoring adds cluster-level context: Pod scheduling, node capacity, deployment rollouts, namespace resource quotas, controller state, and control plane health. Most modern container monitoring tools cover both layers, but the depth of Kubernetes-native context varies significantly between open-source and commercial options.
Open-source tools can be sufficient for experienced teams. Prometheus handles Kubernetes metrics at scale, Grafana covers visualization and alerting, SigNoz covers traces and logs in an OpenTelemetry-native platform, and Zabbix covers traditional infrastructure extended to containers. The real question is operational capacity: Someone must manage storage, scaling, upgrades, and alert tuning. Commercial platforms reduce that burden at the cost of subscription and ingest fees.
Monitoring tools reduce incident response time by correlating alerts with dashboards, logs, distributed traces, Kubernetes events, and dependency maps. When an alert fires, an engineer can move from symptom to root cause without switching between disconnected tools. Features like anomaly detection, automated root cause analysis (in Dynatrace and Instana), and correlated log search reduce mean time to resolution on containerized workloads.
Test the tool against real workloads, not clean demo environments. Force pod restarts, generate log spikes, simulate a noisy neighbor workload, and measure how quickly an engineer reaches the root cause. Validate alert routing, RBAC and access controls, cost forecasting under realistic ingest volumes, and integration with your existing incident and CRM tools. Build a scorecard before the POC starts so success criteria are agreed upon before anyone sees a dashboard. Teams supporting infrastructure tool evaluations should treat this checklist the same way a presales team treats a technical validation criteria doc.
Some tools include runtime security as part of the platform. Sysdig combines container monitoring with runtime threat detection, vulnerability management, and compliance reporting. Datadog and Dynatrace include security signals alongside performance monitoring. Others focus exclusively on reliability and performance, leaving runtime security to a separate platform. Confirm which signals a tool actually covers before assuming security and monitoring are handled in one place.