
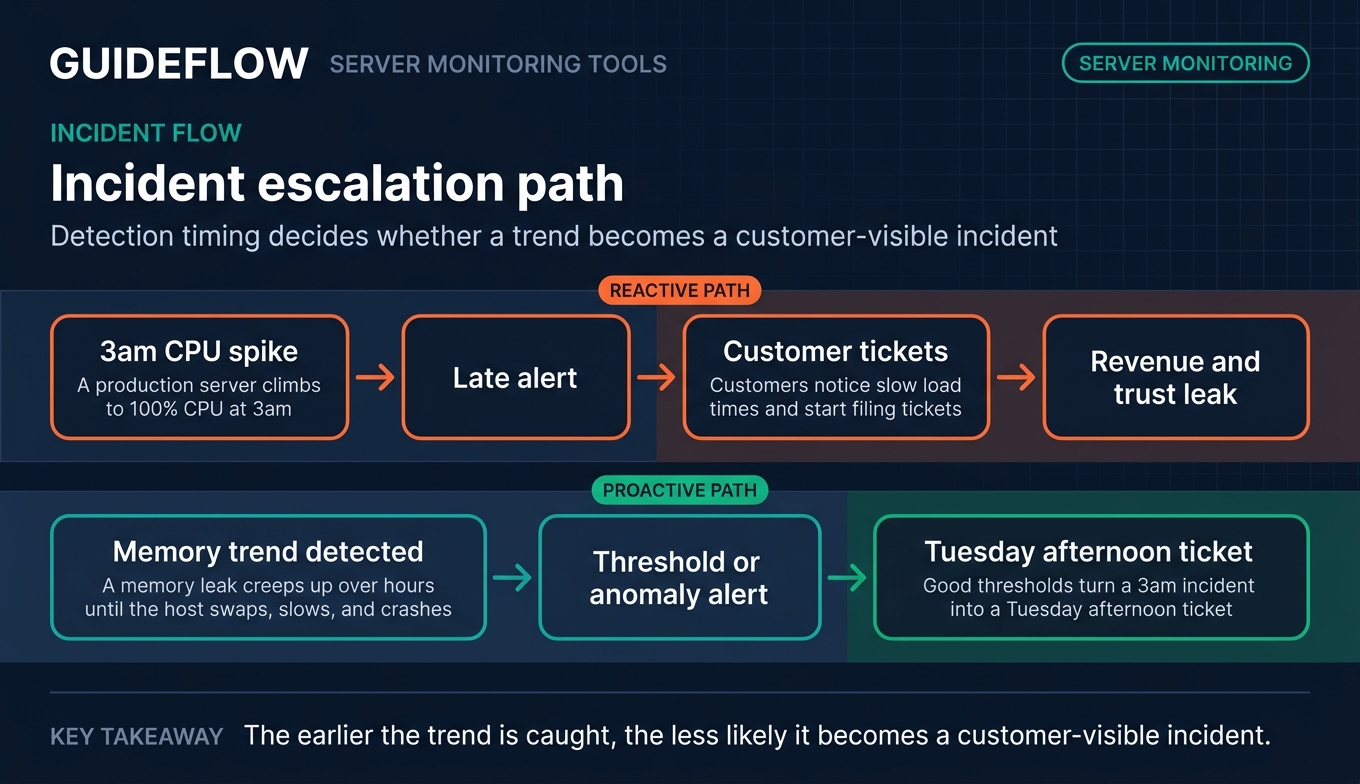
It is 3am. A production server quietly climbs to 100% CPU. The alert fires late. By the time anyone wakes up, customers have already noticed the slow load times and started filing tickets. That gap, between when something breaks and when you find out, is where revenue and trust leak.
The cost is real and measurable. The Uptime Institute's 2023 Outage Analysis found that over 60% of outages cost at least $100,000, and nearly 15% cost more than $1 million. Most of those incidents start small: a disk filling up, a memory leak creeping over hours, a service that stops responding. The teams that catch them early have one thing in common. They run good server monitoring tools, and they tuned them properly.
Server monitoring software watches CPU, memory, disk, network, and uptime across your fleet, then tells you before users do. The challenge is not whether you need it. It is which tool fits your stack, your scale, and your budget. A lean three-person IT team has different needs than an MSP managing 400 endpoints or an SRE org running Kubernetes at scale.
This guide ranks 25 server monitoring tools for 2026, covering free, paid, and open source options in one place. We cut through vendor marketing and give you the honest trade-offs: where each tool shines, and where it is the wrong call.
What's inside
This guide is for DevOps engineers, SREs, system administrators, IT operations managers, MSP technicians, and infrastructure leads who are evaluating server monitoring software right now. We picked 25 tools and ranked them by relevance to real buying decisions, not by who paid for placement.
We judged every tool against four criteria:
- Metric coverage and architecture: agent-based, agentless, SNMP, WMI, and what it actually measures.
- Alerting and anomaly detection: thresholds, dynamic baselines, and noise control.
- Cloud, on-prem, and hybrid coverage: where your servers live and whether the tool reaches them.
- Pricing transparency and free-tier availability: what it costs and whether you can start free.
TL;DR
Short on time? Here are the decision shortcuts.
- Best for free and open source: Zabbix and Prometheus, both genuinely free with deep customization.
- Best for enterprise observability: Datadog and Dynatrace for AI-driven, full-stack coverage at scale.
- Best for MSPs: Atera and NinjaOne, built around per-technician RMM and endpoint monitoring.
- Best all-in-one infrastructure monitoring: Site24x7 and ManageEngine OpManager for server plus network in one console.
- Best for small and lean IT teams: Paessler PRTG Network Monitor with its free 100-sensor edition.
- Best for hybrid cloud: LogicMonitor and New Relic for unified on-prem and multi-cloud visibility.
Background: what server monitoring tools are
Server monitoring tools are software that continuously track the health, performance, and availability of physical, virtual, and cloud servers. They collect metrics on a schedule, compare them to thresholds, and alert your team when something drifts out of range. Splunk frames server monitoring as the server's heartbeat: ensuring it stays online and operational, even when it is not perfectly healthy.
The category overlaps with infrastructure monitoring and broader observability. Many tools that started as server performance monitoring software now cover containers, cloud services, and applications in one platform. The global IT infrastructure monitoring market reflects this, projected to reach roughly $8 to 9 billion by the late 2020s as hybrid cloud and microservices adoption climbs.
Here is what server monitoring software typically does:
- Core metrics tracked: CPU usage, memory and RAM, disk space and I/O, network throughput, uptime, response time, and overall server health.
- Data collection methods: agent-based, agentless, SNMP, WMI, sensors, and synthetic checks.
- Alerting and intelligence: thresholds, dynamic baselines, anomaly detection, and AIOps for noise reduction.
- Dashboards and reporting: real-time visualization, historical trends, and scheduled reports.
- Environment coverage: cloud, on-premises, virtual, and hybrid servers from one place.
The strongest tools correlate these signals. A spike in disk I/O alongside rising response time tells a clearer story than either metric alone. That correlation is the difference between a useful alert and a pager that everyone learns to ignore.
Modern monitoring software also leans on machine learning. Tools like Netdata and Datadog use anomaly detection to flag patterns that static thresholds miss. That matters as fleets grow and manual threshold tuning stops scaling. Teams evaluating broader observability stacks often pair these with the best product analytics software to connect infrastructure signals to user behavior.
How server monitoring works: agents, agentless, SNMP, and synthetic
Before you pick a tool, map it to how it collects data. The architecture decides what you can monitor and how much overhead you carry.
Agent-based monitoring installs lightweight software on each server. It reads deep metrics directly from the host: process-level detail, custom application data, and granular system internals. Agentless monitoring skips installs and polls servers over protocols like SNMP, WMI, or APIs. It is faster to deploy across many devices but usually shallower.
SNMP suits network gear and devices where you cannot install software. WMI is the Windows equivalent for servers and services. Synthetic monitoring is different: it simulates user requests from external nodes to test uptime and response time from the outside in. Infrastructure monitoring watches the inside; synthetic watches what users experience.
Most teams blend approaches. Agents on critical servers, agentless polling for the long tail, synthetic checks on public endpoints.
| Method | Best for | Trade-off |
|---|---|---|
| Agent-based | Deep host and application metrics | Install and maintain agents per server |
| Agentless (SNMP/WMI) | Fast coverage across many devices | Shallower data depth |
| Synthetic checks | External uptime and response time | Does not see internal host health |
When to use server monitoring tools
Server monitoring earns its keep in three recurring situations. If any of these sound like your week, you need a tool dialed in.
Catch performance issues before users do
A memory leak rarely announces itself. It creeps up over hours until the host swaps, slows, and crashes. Server performance monitoring catches the trend line early, so you act on a warning instead of an outage. Good thresholds turn a 3am incident into a Tuesday afternoon ticket.
Monitor hybrid and multi-cloud infrastructure from one console
Few teams run pure on-prem or pure cloud anymore. You have VMs in a data center, workloads in AWS, and a Kubernetes cluster somewhere in between. Server network monitoring across all of it from one console beats stitching together four dashboards. Unified visibility is the whole point of modern infrastructure monitoring.
Reduce alert fatigue with smart thresholds and anomaly detection
The fastest way to miss a real incident is to drown in false ones. When every minor blip pages someone, the team stops trusting alerts. Dynamic baselines and anomaly detection learn normal behavior and flag genuine deviations. That keeps your on-call rotation focused on what actually matters.
Comparison table
The table below ranks all 25 server monitoring tools by relevance to a typical buyer evaluating server monitoring software. Read it as a shortlist filter. The Intent column tells you the tool's center of gravity, Key use case tells you who it fits, and Pricing shows the entry point. G2 ratings reflect current listings where a verified score exists. Pricing and ratings move, so confirm both on the vendor's live pages before you commit budget.
| # | Product | Intent | Key use case | Pricing | G2 rating |
|---|---|---|---|---|---|
| 1 | Datadog | Cloud observability | Cloud-native infra and APM at scale | Free; Pro from $15/host/mo | 4.4/5 |
| 2 | Dynatrace | Enterprise AIOps | AI-driven full-stack observability | From $7/host/mo | 4.5/5 |
| 3 | SolarWinds SAM | Hybrid IT ops | Server and application monitoring | From $8/node/mo | Not listed |
| 4 | Paessler PRTG | Sensor-based | Lean SMB on-prem monitoring | Free 100 sensors; from $200/mo | 4.7/5 |
| 5 | ManageEngine OpManager | Infra and network | Device-based server and network | Free 3 devices; from $245 | 4.6/5 |
| 6 | Site24x7 | All-in-one SaaS | Server, network, APM, synthetic | From $9/mo | 4.6/5 |
| 7 | New Relic | Usage-based observability | Full-stack with generous free tier | Free; usage-based | 4.4/5 |
| 8 | Zabbix | Open source | Customizable enterprise monitoring | Free; Cloud from $50/mo | 4.4/5 |
| 9 | Prometheus | Open source metrics | Kubernetes-native metrics and alerting | Free, open source | 4.5/5 |
| 10 | Grafana Cloud | Visualization and observability | Open-standard dashboards and metrics | Free; Pro from $19/mo | 4.5/5 |
| 11 | Nagios XI | Legacy standard | Plugin-driven on-prem monitoring | Free up to 7 nodes; from $2,595 | Not listed |
| 12 | LogicMonitor | Hybrid observability | AI-assisted hybrid infrastructure | From $16/hybrid unit | 4.5/5 |
| 13 | Checkmk | Hybrid open source | Fast-setup infra monitoring | Free; Pro from $275/mo | 4.7/5 |
| 14 | Icinga | Open source | Flexible Nagios-fork monitoring | Free; subscriptions available | 4.4/5 |
| 15 | Netdata | Real-time metrics | Per-second lightweight monitoring | Free; Business $4.50/node/mo | 4.6/5 |
| 16 | Elastic Observability | Logs and metrics | OpenTelemetry full-stack | From $0.07/GB ingested | 4.2/5 |
| 17 | AppDynamics | Enterprise APM | Business-transaction monitoring | From $6/vCPU/mo | 4.3/5 |
| 18 | Progress WhatsUp Gold | Network and server | Windows-friendly SMB monitoring | From $1,229/yr | 4.4/5 |
| 19 | Centreon | Open source and enterprise | Business-service monitoring | Free up to 100 hosts | 4.6/5 |
| 20 | Pandora FMS | Flexible monitoring | Broad device-based coverage | Free; ONE from 2,447 EUR | 4.6/5 |
| 21 | Atera | MSP RMM | Per-technician IT management | Per-technician, contact sales | 4.6/5 |
| 22 | NinjaOne | Unified IT ops | RMM and endpoint monitoring | Per-device, contact sales | 4.7/5 |
| 23 | LibreNMS | Open source | SNMP auto-discovery monitoring | Free, open source | 4.6/5 |
| 24 | Sensu Go | Monitoring-as-code | Observability pipelines | Free; Pro $3/node/mo | Not listed |
| 25 | Microsoft SCOM | Windows enterprise | On-prem System Center monitoring | From $1,455 | 4.3/5 |
The 25 best server monitoring tools for 2026
1. Datadog
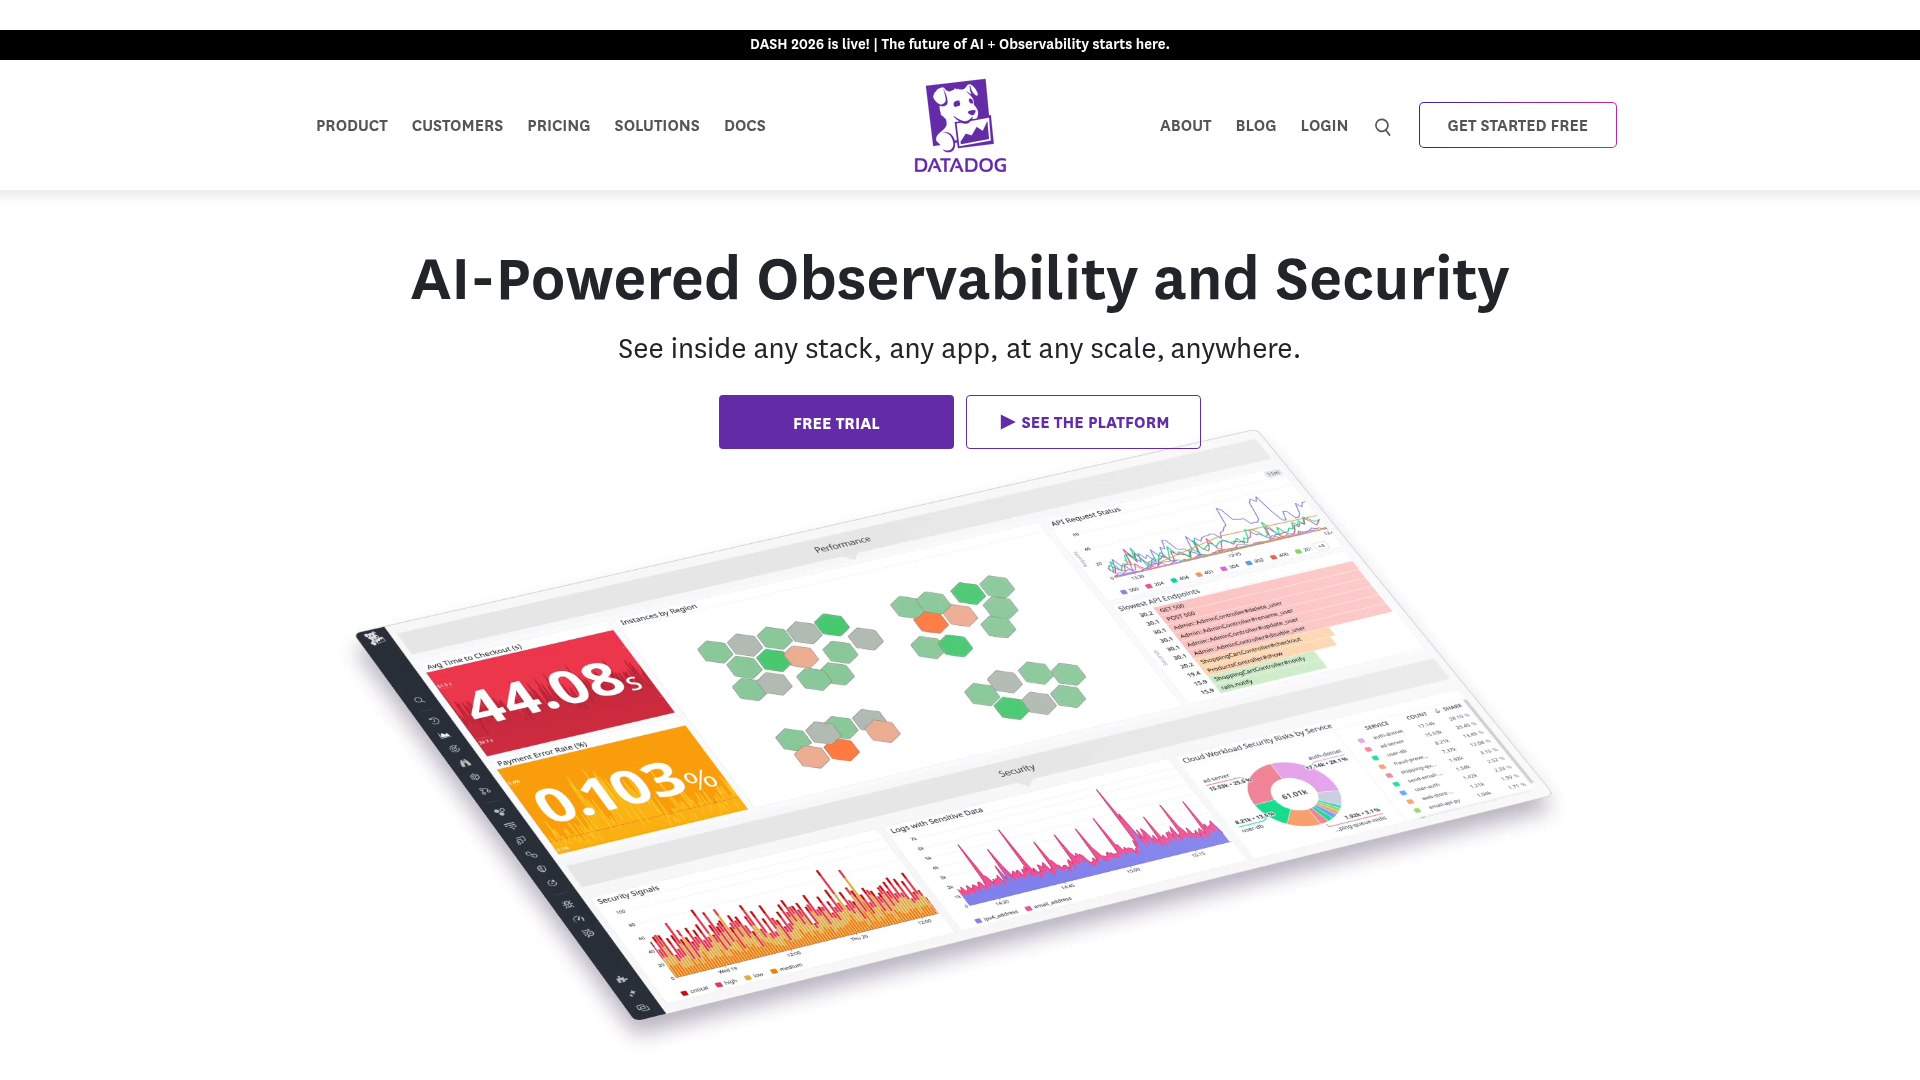
Datadog is an AI-powered observability and security platform for monitoring infrastructure, applications, logs, user experience, software delivery, and security. It scales by host and ships with out-of-the-box dashboards and over 1,000 integrations. Engineering, IT operations, DevOps, and security teams use it to unify metrics, traces, and logs in one place.
Best for: Engineering and DevOps teams needing unified observability across cloud-scale infrastructure and applications.
Key strengths
- Infrastructure monitoring: Out-of-the-box dashboards and 1,000+ integrations cover servers fast.
- Log management: Ingest, process, search, alert, and dashboard on logs in one platform.
- Application performance monitoring: Monitor, optimize, and investigate application performance alongside infrastructure.
Why choose Datadog: Datadog is the strong pick when you run cloud-native infrastructure and want infra, APM, and logs correlated automatically. It is less ideal if you run a small static fleet on a tight budget, because per-host pricing across multiple modules can climb quickly as usage grows. Watch the bill as you add products.
Datadog pricing: Infrastructure has a free tier for up to 5 hosts with 1-day metric retention. Infrastructure Pro starts at $15 per host per month billed annually, or $18 on-demand. Enterprise runs $23 per host per month billed annually. Other products like Log Management and APM carry separate usage-based pricing.
2. Dynatrace
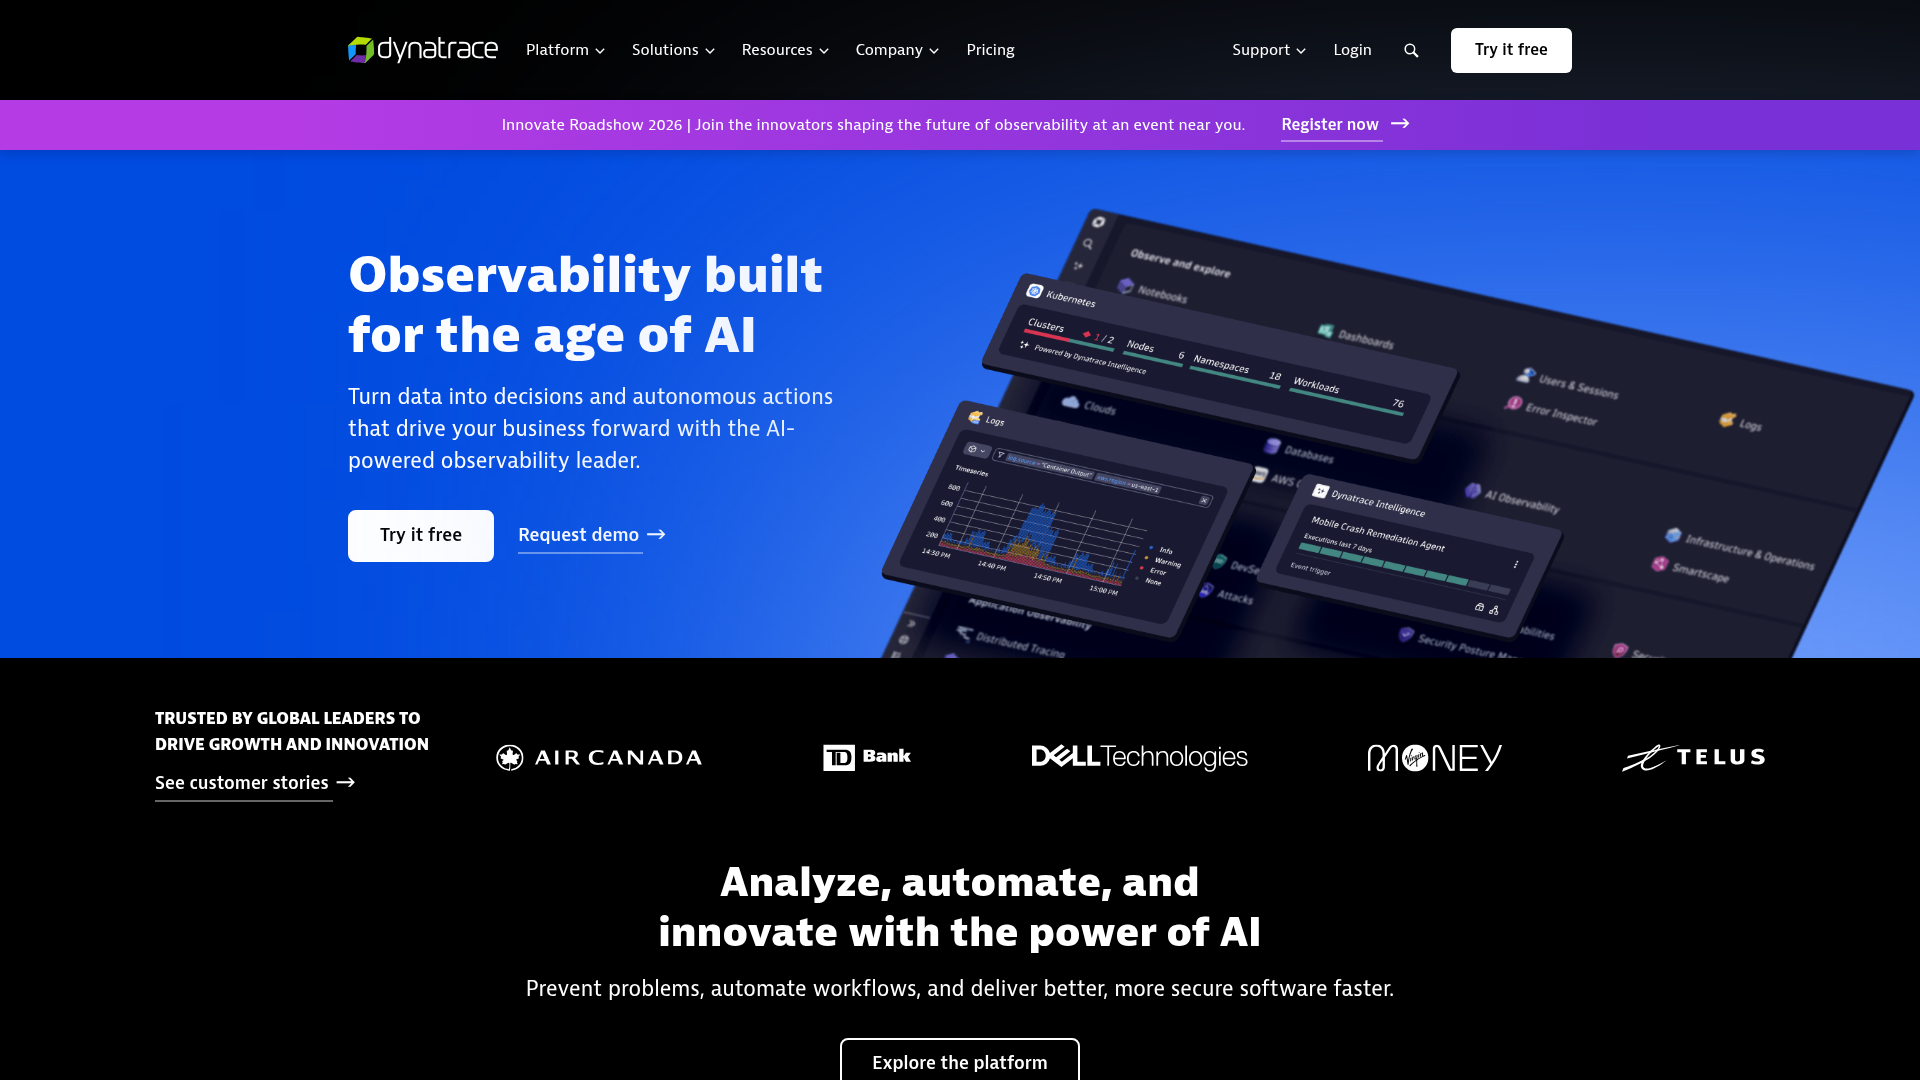
Dynatrace is an AI-powered observability platform for monitoring, securing, analyzing, and automating complex cloud, application, and infrastructure environments. Its OneAgent collects data automatically, and the Davis AI engine drives root-cause analysis. Enterprise teams use it for full-stack observability across large hybrid and cloud-native estates.
Best for: Enterprise teams needing AI-assisted full-stack observability and automated root-cause analysis.
Key strengths
- Automated root-cause analysis: Davis AI surfaces the cause, not just the symptom, across the stack.
- Grail data analytics: Logs, metrics, traces, and events ingested and queried in one store.
- Digital experience monitoring: Real user monitoring, session replay, and synthetic checks built in.
Why choose Dynatrace: Dynatrace fits enterprises that want AI to cut through alert noise and pinpoint causation across thousands of components. It is less ideal for small teams or simple stacks, where the platform depth and consumption-based pricing exceed what you need. The value scales with environment complexity.
Dynatrace pricing: Foundation and Discovery starts at $7 per month per host, billed at $0.01 per hour. Infrastructure Monitoring runs $29 per month per host. Full-Stack Monitoring is $58 per month per 8 GiB host. Kubernetes Platform Monitoring is $1.40 per month per pod. Pricing is consumption-based with volume discounts.
3. SolarWinds Server & Application Monitor
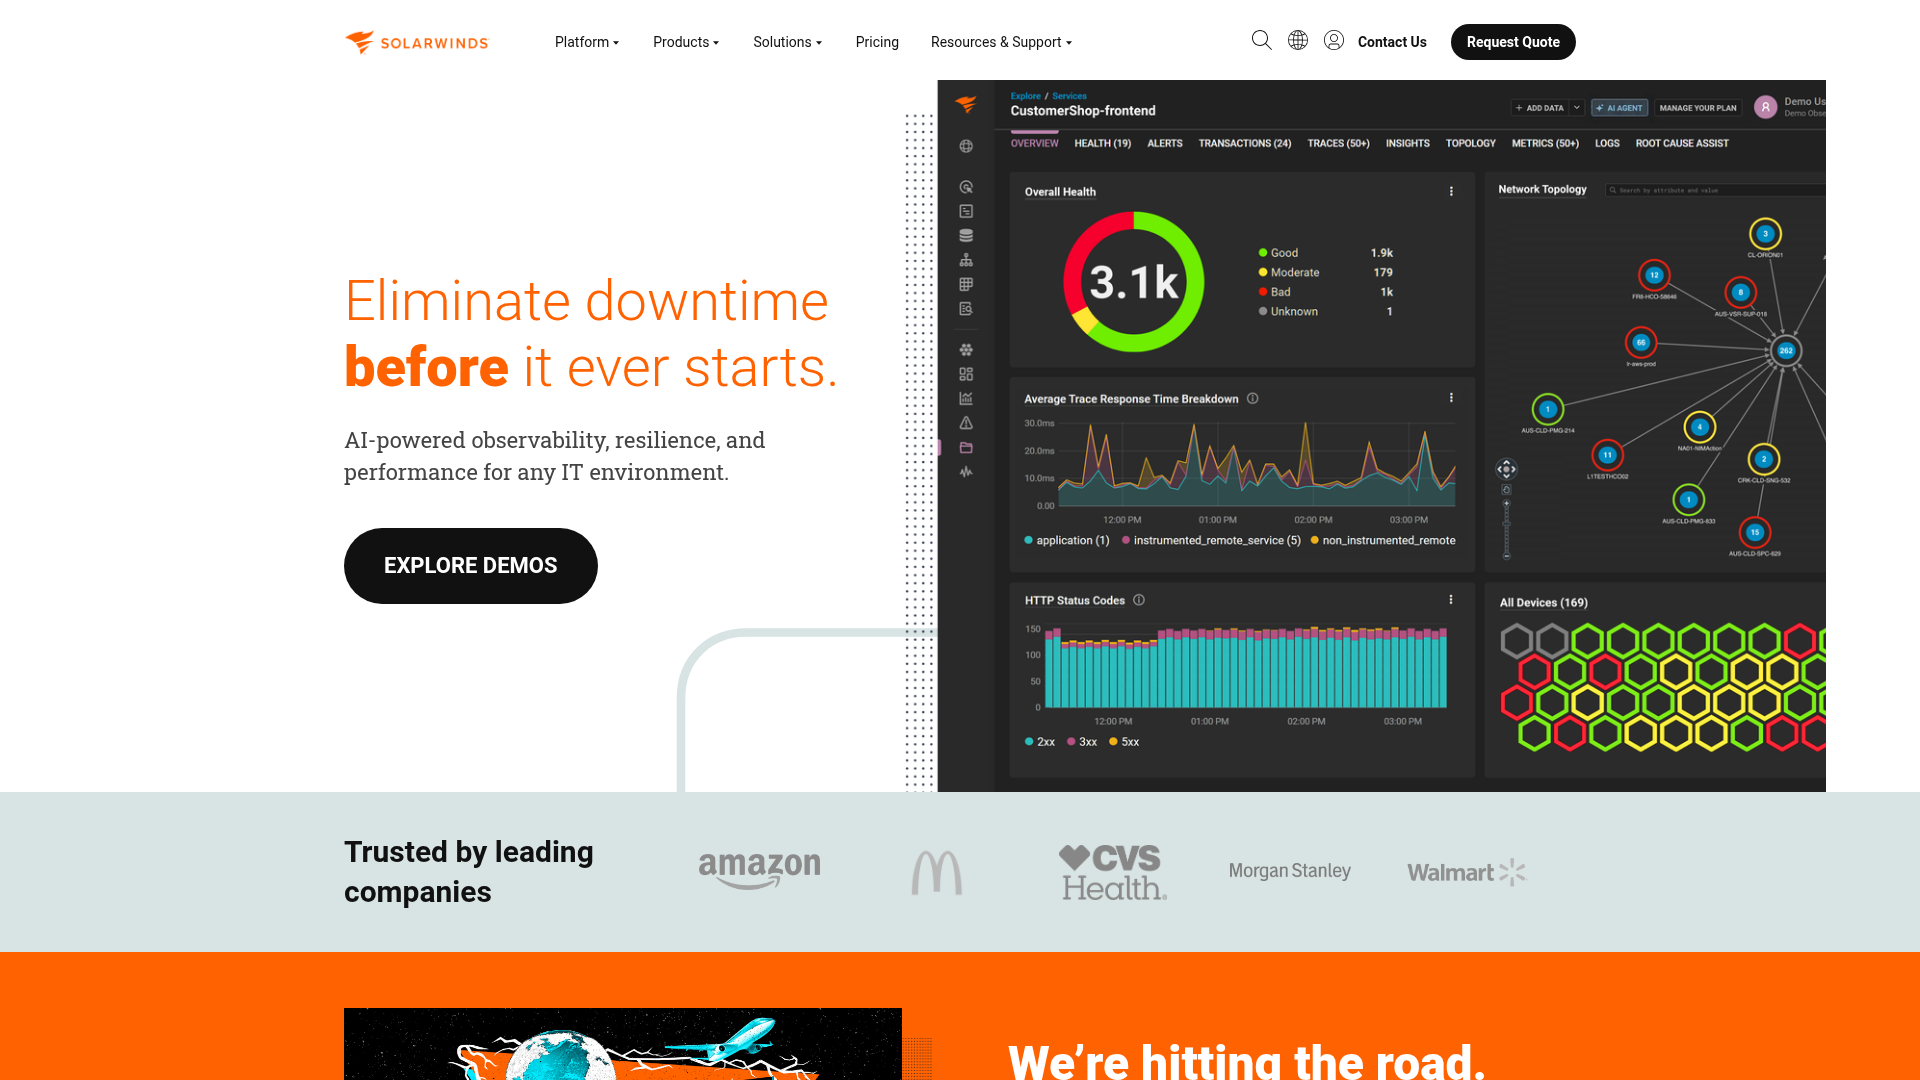
SolarWinds Server & Application Monitor is server application monitoring software for tracking and optimizing performance across hybrid IT environments. It supports agent and agentless (WMI) data collection and provides cross-stack correlation. IT operations teams use it for server and application visibility on-premises and in hybrid setups.
Best for: IT operations teams needing server and application monitoring with dependency visibility across hybrid environments.
Key strengths
- Cross-stack correlation: Continuous server monitoring ties hybrid IT data together for faster troubleshooting.
- Application monitoring templates: Custom and commercial application templates speed up coverage.
- Application dependency mapping: Visualize how servers and applications relate before issues cascade.
Why choose SolarWinds SAM: SolarWinds SAM suits teams already invested in the Orion platform who want server and application monitoring in one console. It is less ideal for cloud-native shops wanting usage-based SaaS pricing, since SAM leans toward traditional licensing and self-hosted deployment. Ask sales for a custom quote on the standalone module.
SolarWinds SAM pricing: SolarWinds Observability Self-Hosted, where SAM features are a key part, starts at $8 per node per month, with multi-year contracts billed annually. The standalone SAM Orion module is quoted through sales rather than published as a public price. Contact SolarWinds for an environment-specific quote.
4. Paessler PRTG Network Monitor
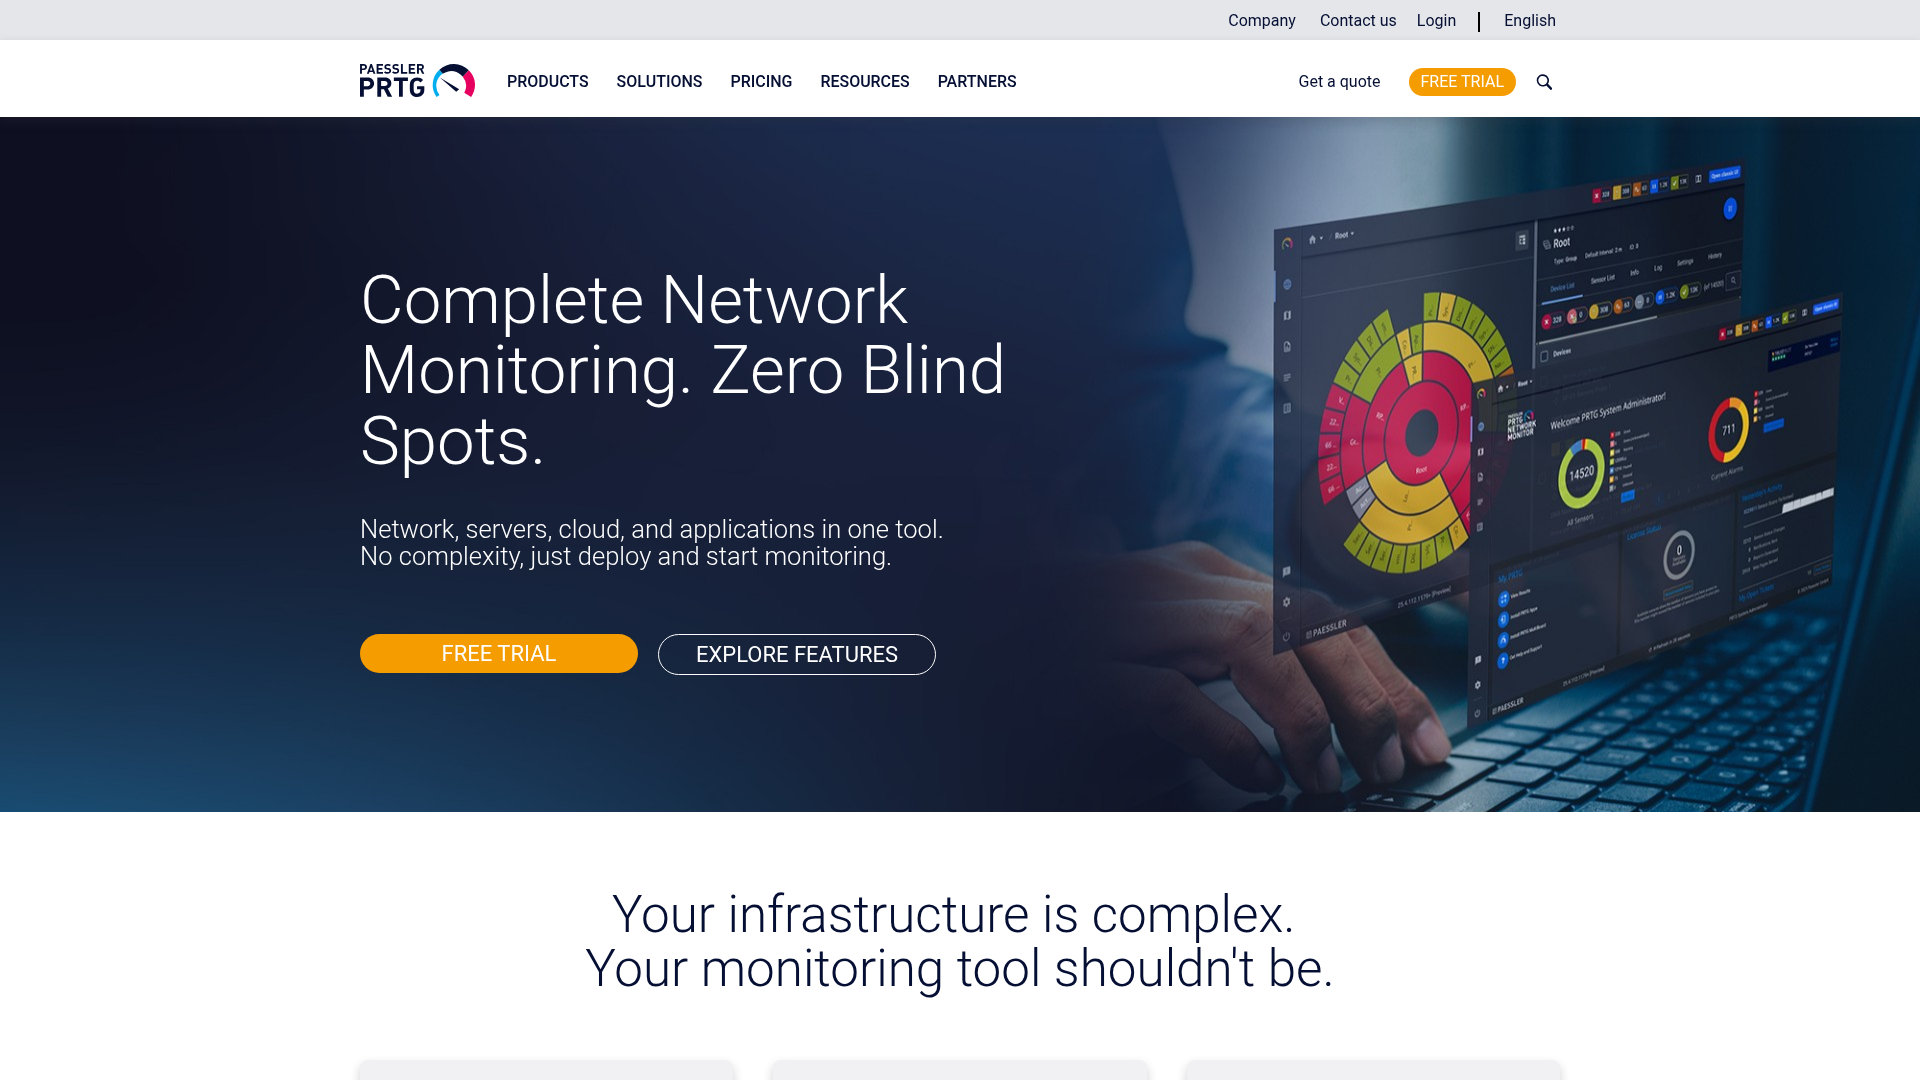
Paessler PRTG Network Monitor is on-premises network monitoring software for IT, OT, and IoT infrastructure, covering systems, devices, traffic, applications, and services. It uses a sensor-based model with automatic network discovery. Small and medium IT teams rely on it for broad coverage without complex setup.
Best for: Small and medium IT teams needing sensor-based on-premises monitoring across networks and servers.
Key strengths
- Automatic network discovery: Map your environment without manual device entry.
- Custom maps and dashboards: Build views that match how your team thinks about infrastructure.
- Real-time alerts: Get notified the moment a sensor crosses a threshold.
Why choose PRTG: PRTG is a strong free server monitoring option for lean teams, since the freeware edition covers up to 100 sensors at no cost. It is less ideal for large cloud-native fleets, because the on-premises sensor model fits physical and hybrid environments better than ephemeral cloud workloads. Start free and scale into a paid license as you grow.
PRTG pricing: PRTG runs unlimited for 30 days, then reverts to the free edition for up to 100 sensors. Paid licenses start with PRTG 500 at $200 per month paid annually for up to 500 monitored aspects. Larger tiers run up to PRTG 10000 at $1,642 per month. All prices are net for business customers.
5. ManageEngine OpManager

ManageEngine OpManager is network and server monitoring software for routers, switches, firewalls, servers, VMs, printers, and storage devices. It monitors physical and virtual servers across Hyper-V, VMware, Citrix, Xen, and Nutanix. IT teams use it for device-based monitoring with strong network visualization.
Best for: IT teams needing device-based monitoring across networks, servers, virtual infrastructure, and storage.
Key strengths
- Network performance monitoring: Dashboards, alerts, and reporting for the full network layer.
- Virtual server monitoring: Coverage across Hyper-V, VMware, Citrix, Xen, and Nutanix HCI.
- Network visualization: Layer 2 maps, virtual topology, business views, and 3D rack views.
Why choose OpManager: OpManager delivers strong mid-market value for teams that want server and network monitoring together with device-based licensing. It is less ideal for pure SaaS-first teams, since it leans toward on-premises and self-managed deployment. The free edition for up to 3 devices is a low-risk way to test fit.
OpManager pricing: A free edition monitors up to 3 devices. The Standard Edition starts at $245 for 25 devices, and the Professional Edition starts at $345 for 25 devices. The Enterprise Edition starts at $4,595 for 250 devices. OpManager Plus bundles add network traffic and configuration management.
6. Site24x7
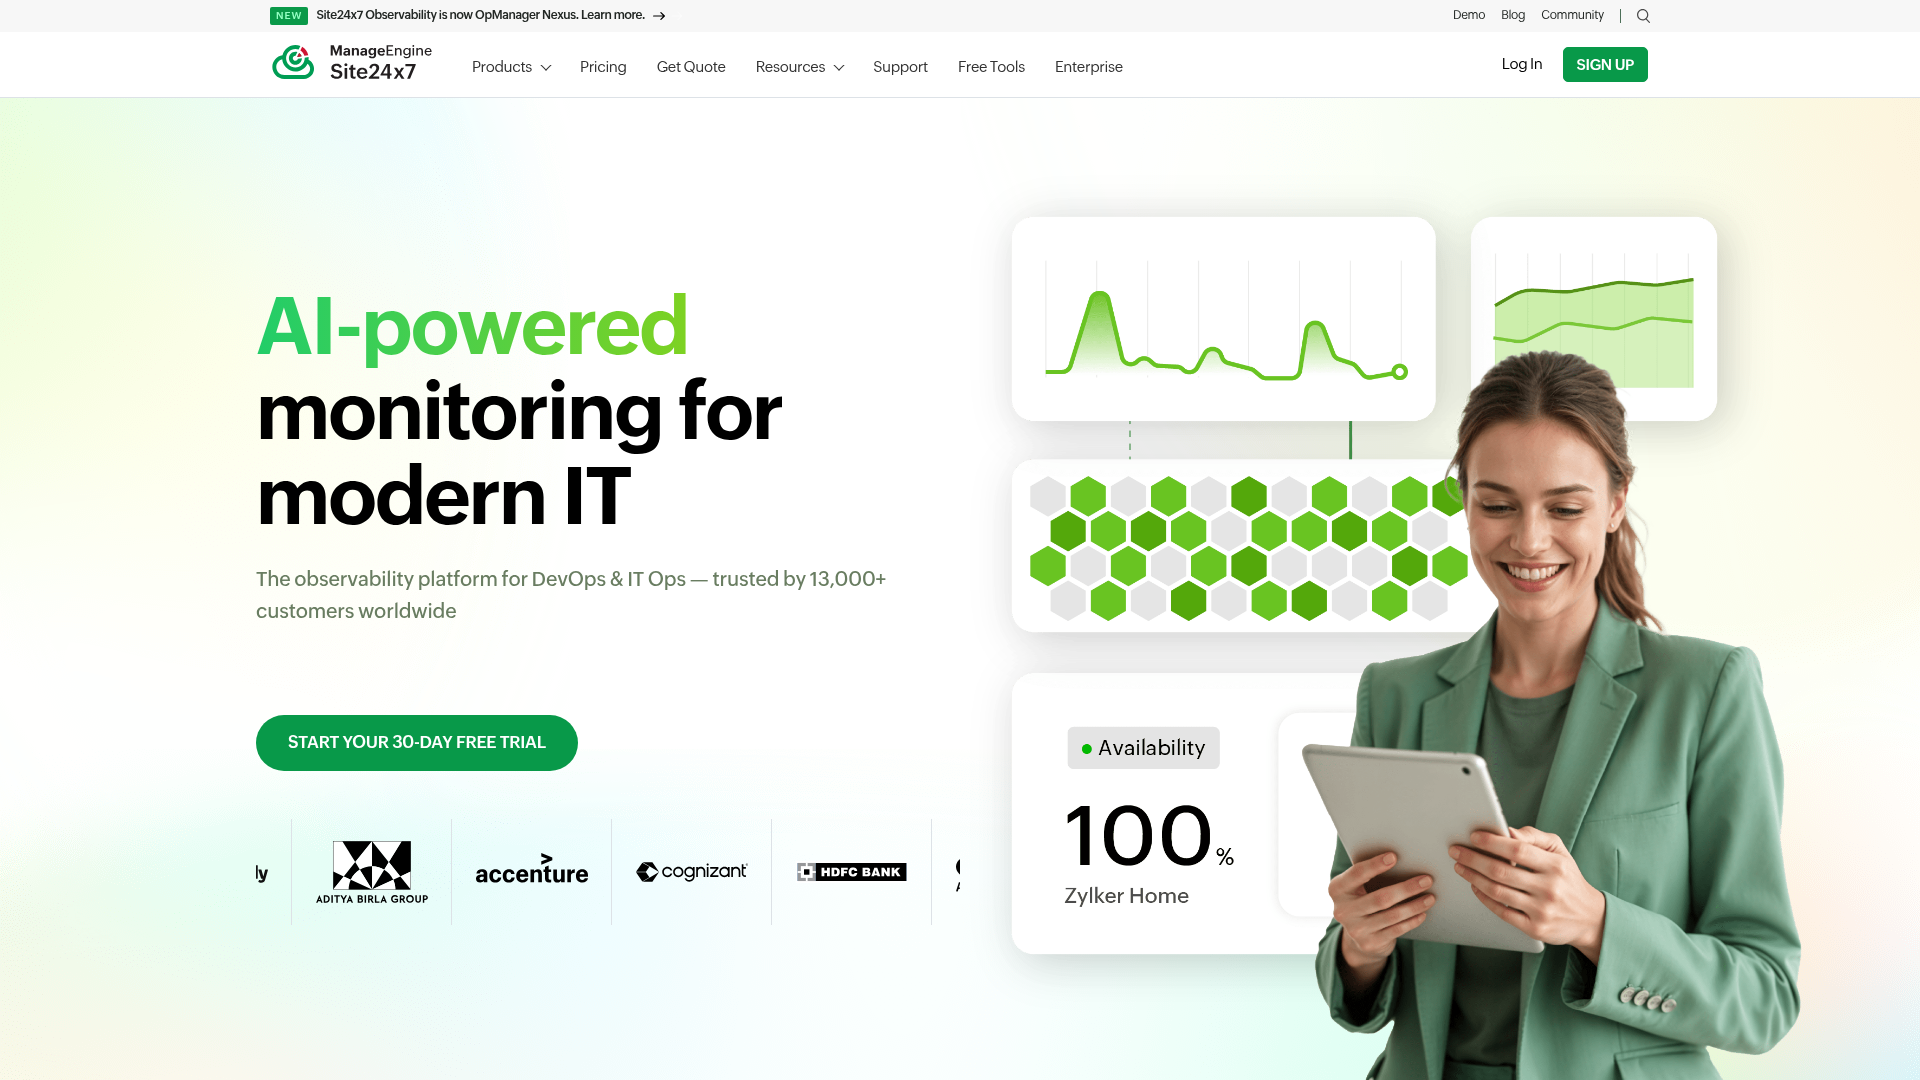
Site24x7 is an all-in-one, full-stack IT monitoring and observability platform covering digital experience, infrastructure, network, cloud, application performance, and logs. It bundles server, network, APM, and synthetic monitoring in one SaaS product. IT operations, DevOps, and MSP teams use it for unified visibility.
Best for: IT operations, DevOps, and MSP teams needing unified monitoring across servers, cloud, network, and user experience.
Key strengths
- Synthetic monitoring: Website, web transaction, real user, and API checks from global locations.
- Infrastructure coverage: Server, cloud, Kubernetes, virtualization, and network monitoring together.
- Logs and AIOps: Log management, alerts, dashboards, and third-party integrations in one place.
Why choose Site24x7: Site24x7 is a strong all-in-one for SMBs and MSPs that want server, network, APM, and synthetic monitoring without stitching tools together. It is less ideal if you need deep, specialized observability in a single domain, where a focused tool may go further. The SMB-friendly entry price lowers the barrier to start.
Site24x7 pricing: Infrastructure monitoring starts with the Lite plan at $9 per month paid annually. The Professional plan runs $42 per month, and the Enterprise plan is $625 per month. MSP Pro starts at $54 per month. Website monitoring plans start at $9 per month, and usage-based add-ons cover cloud, APM, and logs.
7. New Relic
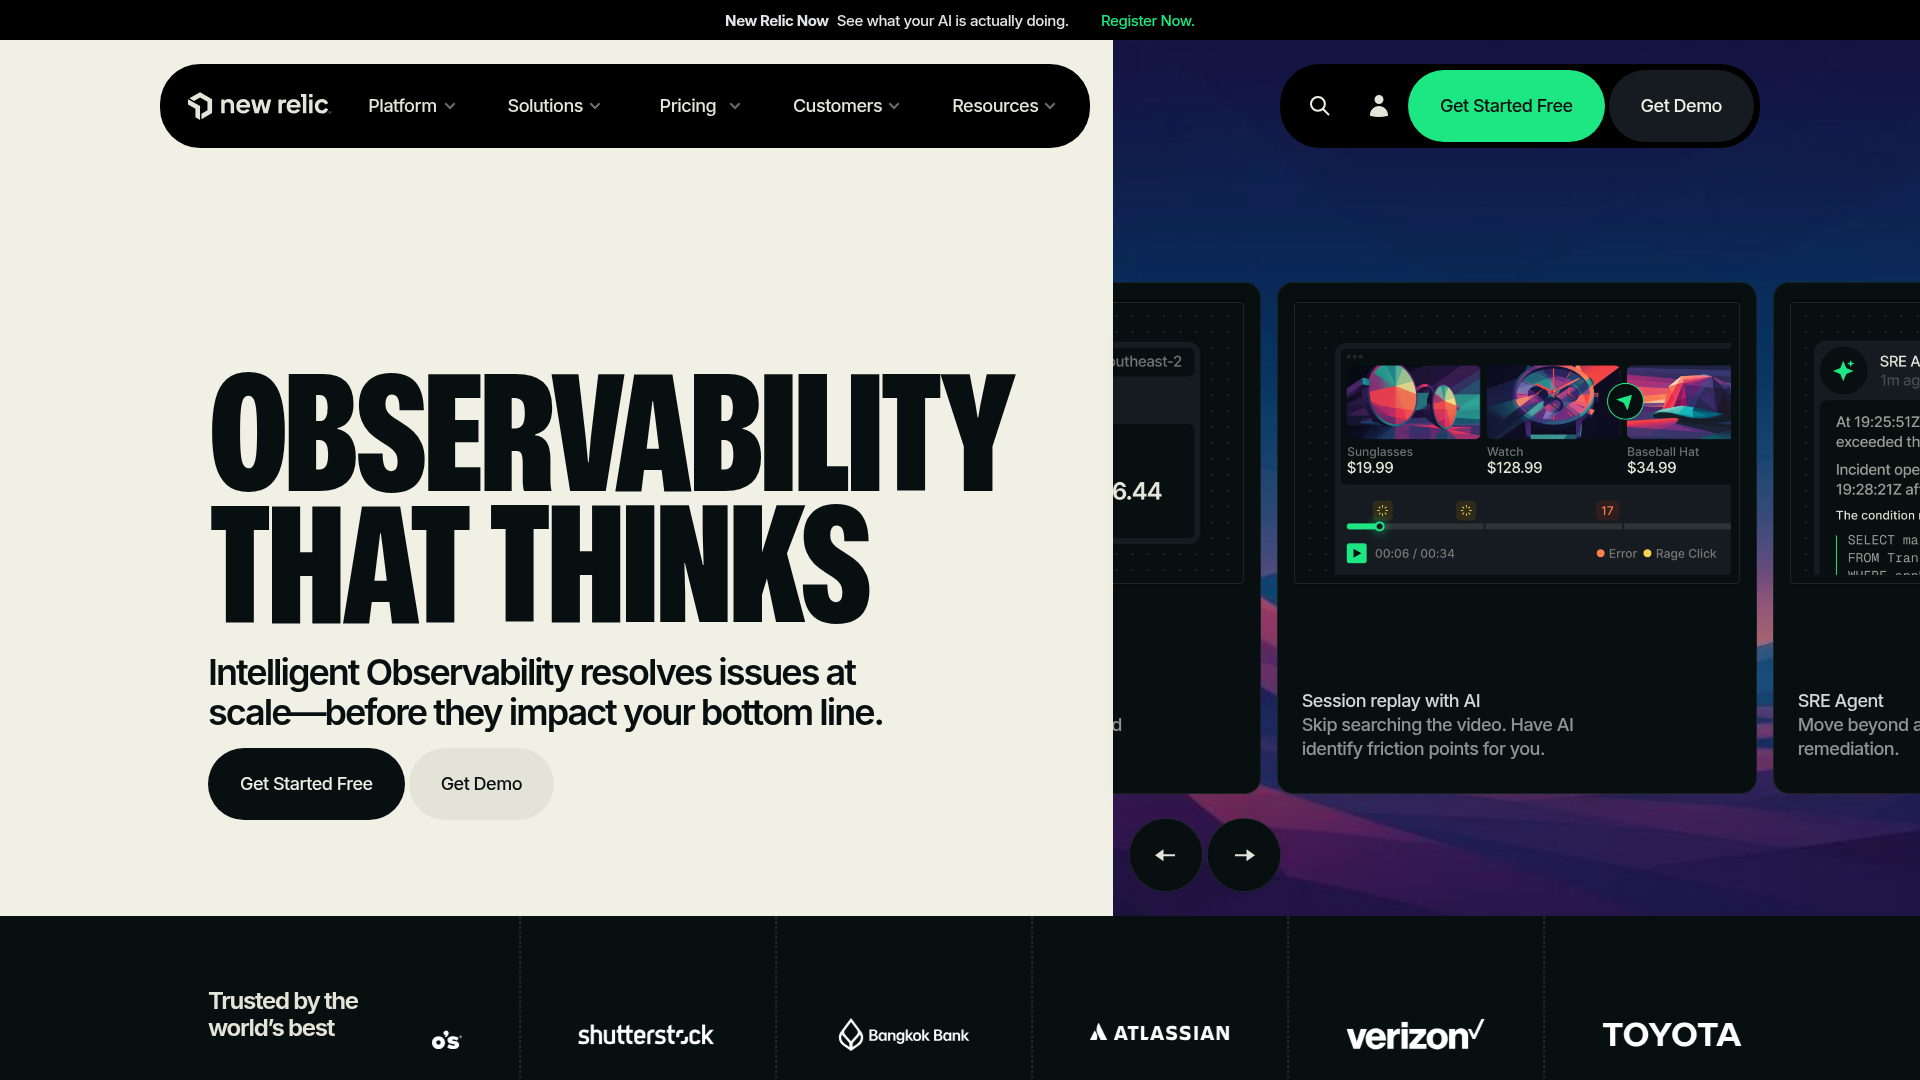
New Relic is an intelligent observability platform for monitoring and improving software performance across applications, infrastructure, logs, and digital experiences. Its infrastructure agent pairs with APM and a usage-based pricing model. Engineering, DevOps, and SRE teams use it for unified full-stack observability.
Best for: Engineering, DevOps, and SRE teams needing full-stack observability with a generous free tier.
Key strengths
- Application performance monitoring: Distributed tracing connects requests across services.
- Infrastructure monitoring: Server, host, and log data unified with dashboards and AIOps.
- Digital experience monitoring: Browser, mobile, and synthetic monitoring in one platform.
Why choose New Relic: New Relic fits teams that want a generous free tier and pricing tied to data and users rather than hosts. It is less ideal for teams that prefer predictable flat-rate billing, since usage-based costs can vary month to month. The free 100 GB monthly ingest makes it easy to evaluate before committing.
New Relic pricing: The Free tier includes 100 GB of data ingest per month, unlimited basic users, and one free full-platform user. Beyond the free limit, data costs $0.40 per GB on Standard and Pro. Full-platform user pricing varies by edition, and Enterprise pricing is custom through sales.
8. Zabbix
Zabbix is an enterprise-class open source monitoring and observability solution for infrastructure, networks, applications, services, cloud, and edge environments. It supports agent-based and agentless collection across SNMP, IPMI, JMX, and more. ITOps, DevOps, MSP, and enterprise teams use it for scalable, customizable monitoring.
Best for: ITOps, DevOps, and enterprise teams needing scalable open source monitoring across hybrid environments.
Key strengths
- Flexible collection: Agent-based and agentless via SNMP, IPMI, JMX, VMware, web, and API.
- Problem detection: Alerting, root cause analysis, anomaly detection, and trend prediction.
- Distributed monitoring: Proxies, dashboards, geo-maps, and API automation at scale.
Why choose Zabbix: Zabbix is a top free server monitoring tool for teams with the in-house skill to run and tune it. It is less ideal for teams that want turnkey SaaS with minimal setup, since the open source core rewards configuration effort. Budget engineering time for the initial build, then enjoy zero licensing cost.
Zabbix pricing: Zabbix On-Premise is free and open source. Zabbix Cloud starts at $50 per month for the Nano tier with 10 GB of storage included, scaling through seven tiers to 2xLarge at $5,000 per month. Paid support subscriptions are also available for self-hosted deployments.
9. Prometheus
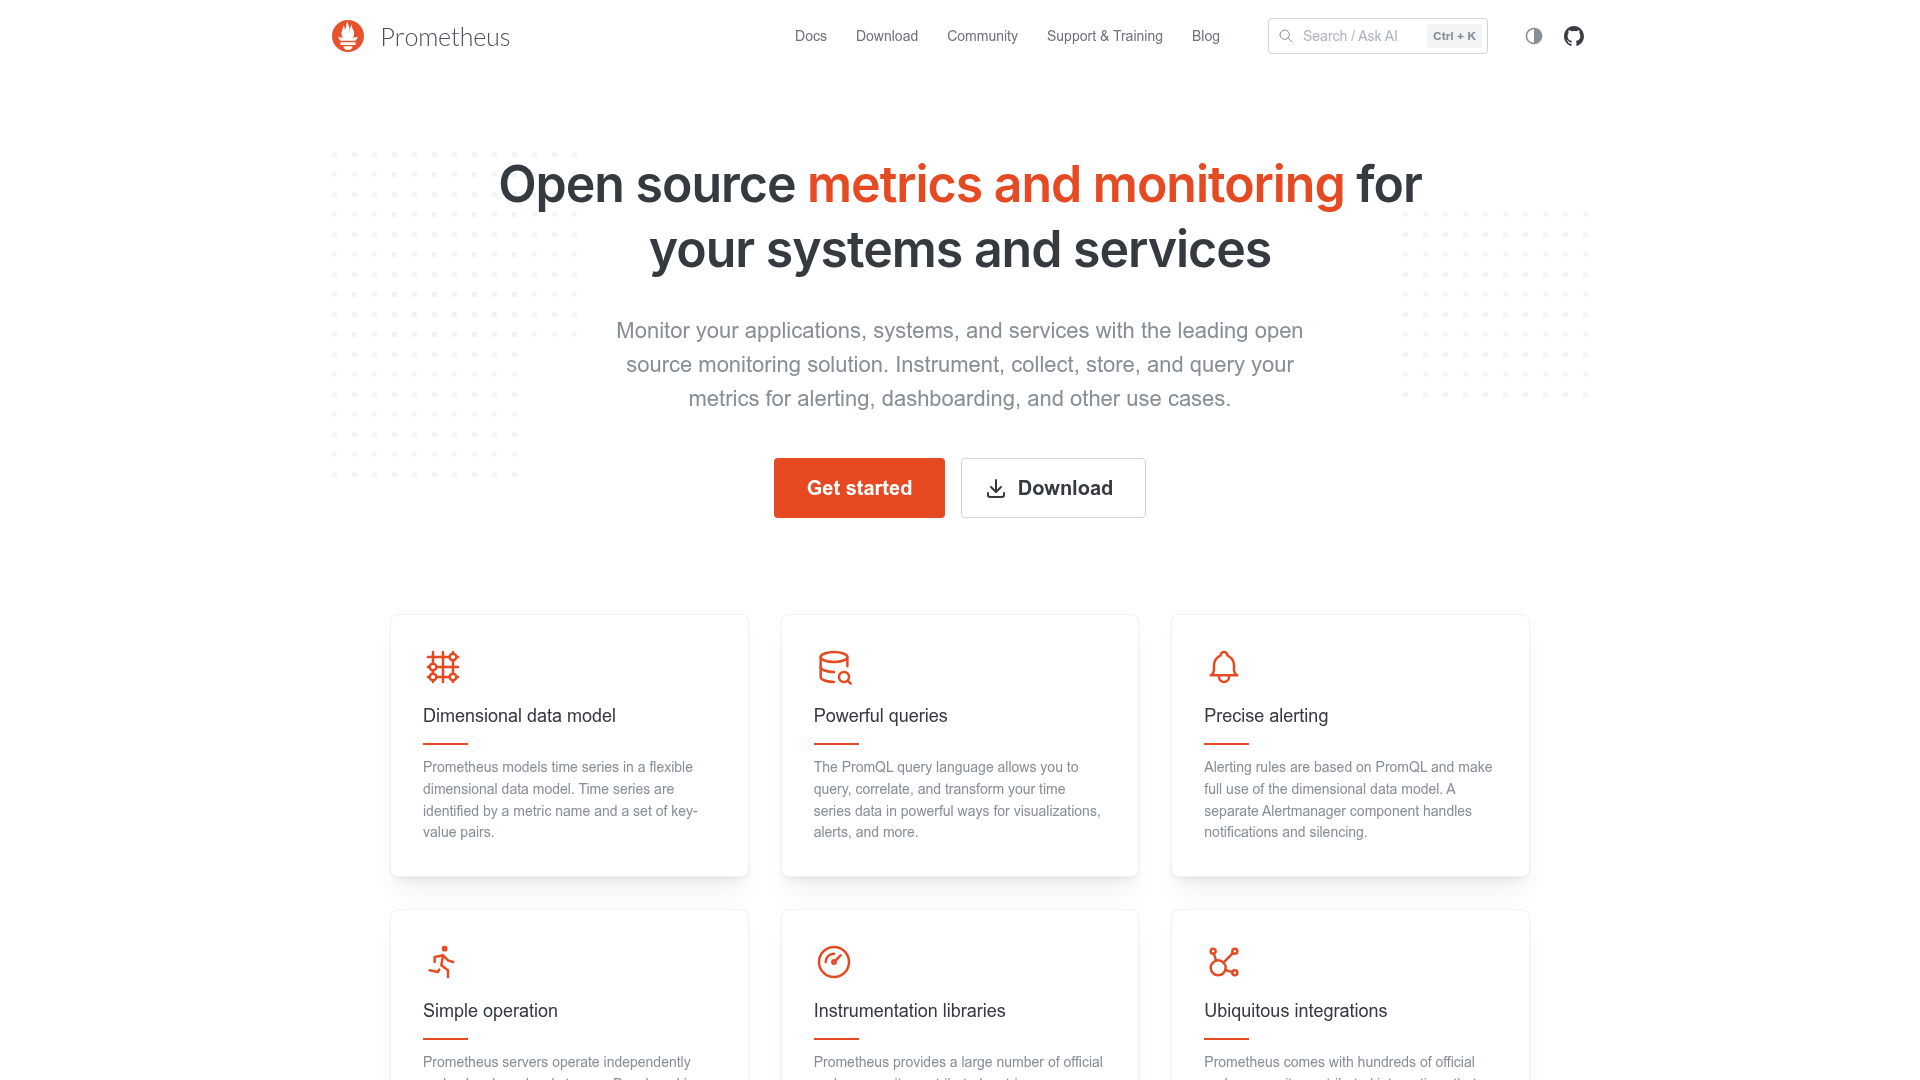
Prometheus is an open-source systems monitoring and alerting toolkit for collecting, storing, querying, and alerting on metrics. It uses a pull-based model with exporters like node_exporter, plus Alertmanager for notifications. Cloud-native engineering and SRE teams use it heavily in Kubernetes environments.
Best for: Cloud-native engineering and SRE teams needing open-source metrics monitoring for Kubernetes-style environments.
Key strengths
- Multi-dimensional data model: Time series identified by metric names and key-value labels.
- PromQL: Query, correlate, and transform time series with a purpose-built language.
- Alerting: PromQL-based rules with Alertmanager for routing, notifications, and silencing.
Why choose Prometheus: Prometheus is the default for Kubernetes-native metrics and a strong free option for cloud-native teams. It is less ideal if you want built-in long-term storage and polished dashboards out of the box, since teams typically pair it with Grafana and remote storage. It is 100% open source under Apache 2.
Prometheus pricing: Prometheus is free and open source under the Apache 2 license, with no paid plan or licensing cost from the project itself. Teams often run it self-hosted, then add managed storage or visualization layers separately as needs grow.
10. Grafana Cloud
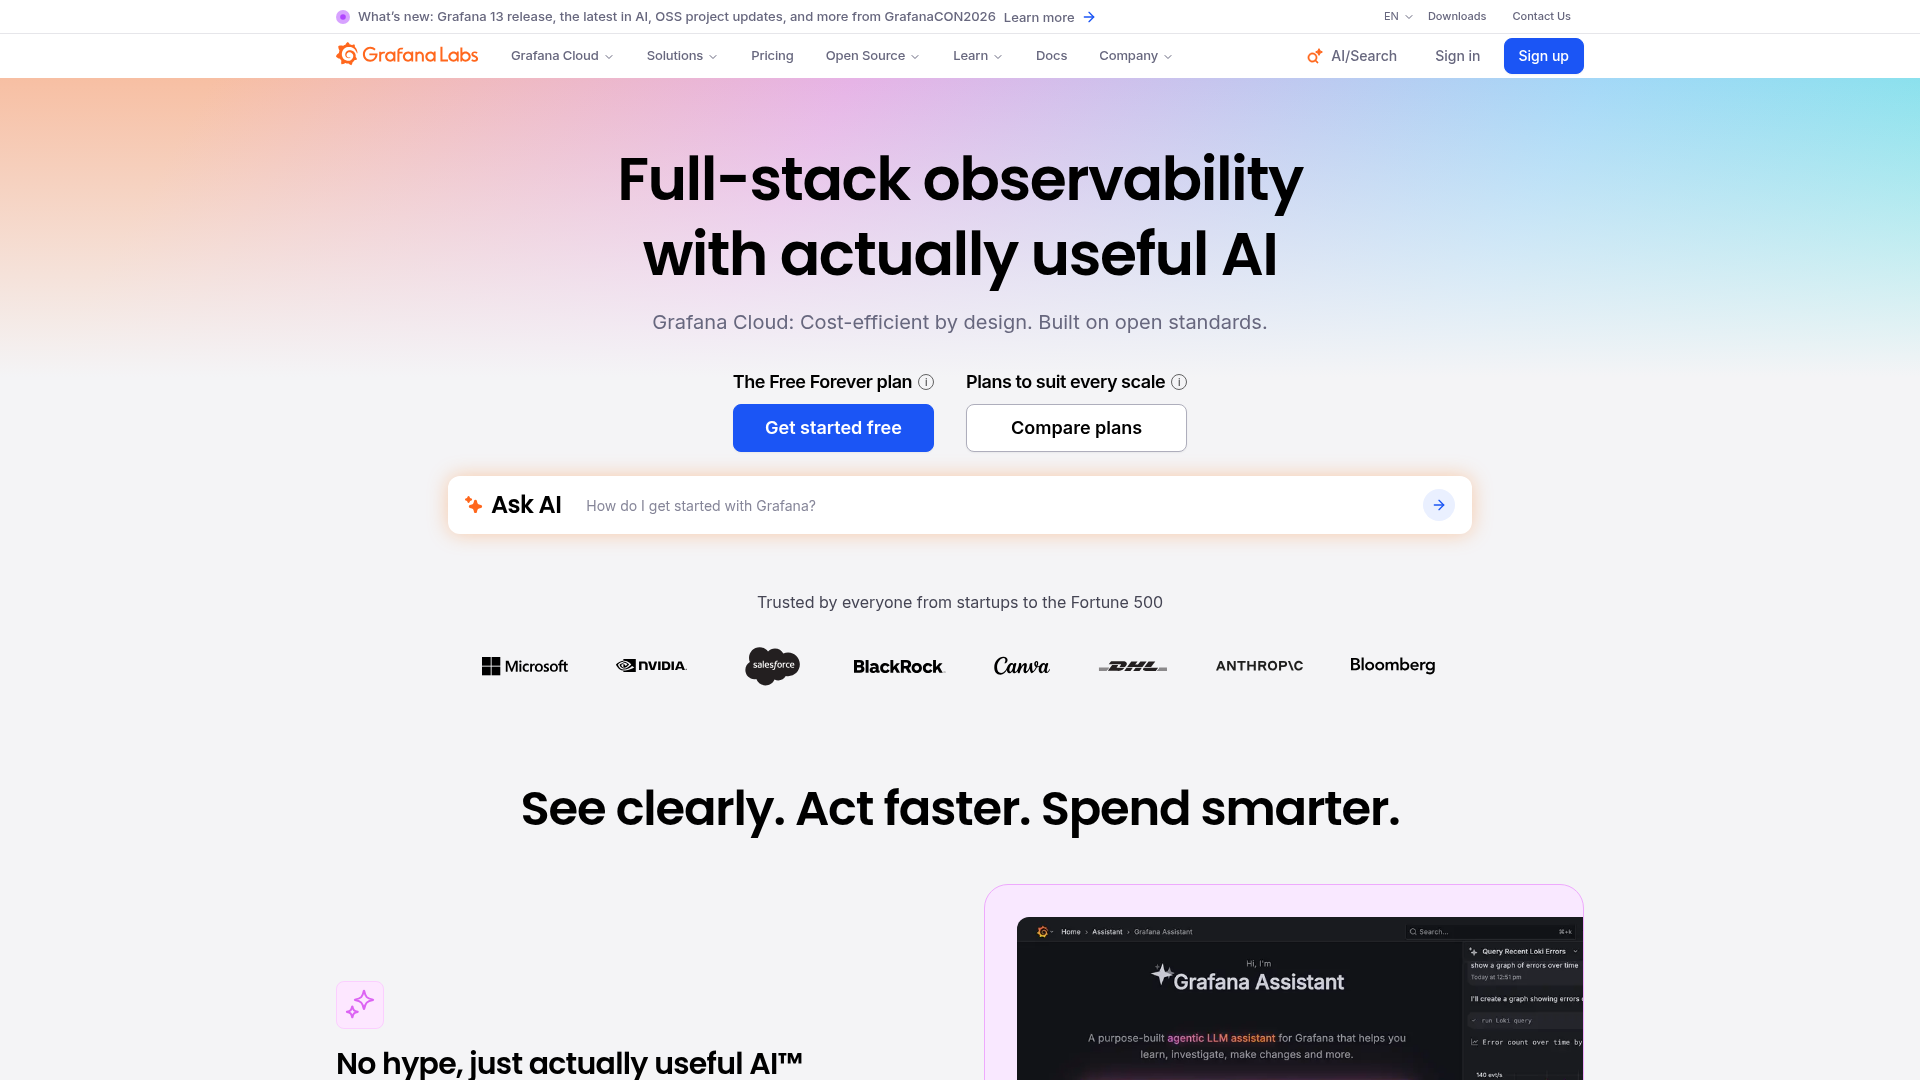
Grafana Cloud is a managed observability platform for metrics, logs, traces, profiles, dashboards, alerting, and incident response. It builds on open standards with Mimir, Loki, and Tempo, and supports both Prometheus-scrape and OTLP data paths. Engineering and SRE teams use it for open-standard observability without self-hosting.
Best for: Engineering and SRE teams needing managed, open-standard observability across metrics, logs, and traces.
Key strengths
- Full-stack observability: Out-of-the-box monitoring across metrics, logs, traces, and profiles.
- Adaptive Telemetry: Filter and optimize observability data to control cost.
- OpenTelemetry-native: Integrations with plugins and existing data sources.
Why choose Grafana Cloud: Grafana Cloud fits teams already standardized on Prometheus and open standards who want a managed backend and best-in-category dashboards. It is less ideal for teams wanting a single all-in-one agent, since it favors composability over a closed stack. The free tier makes it easy to start small.
Grafana Cloud pricing: The Free tier is always free with limited usage and community support. Pro starts at $19 per month plus usage, with pay-as-you-go above the free tier and 8x5 email support. Enterprise starts at a $25,000 per year spend commit with premium support and custom retention.
11. Nagios XI
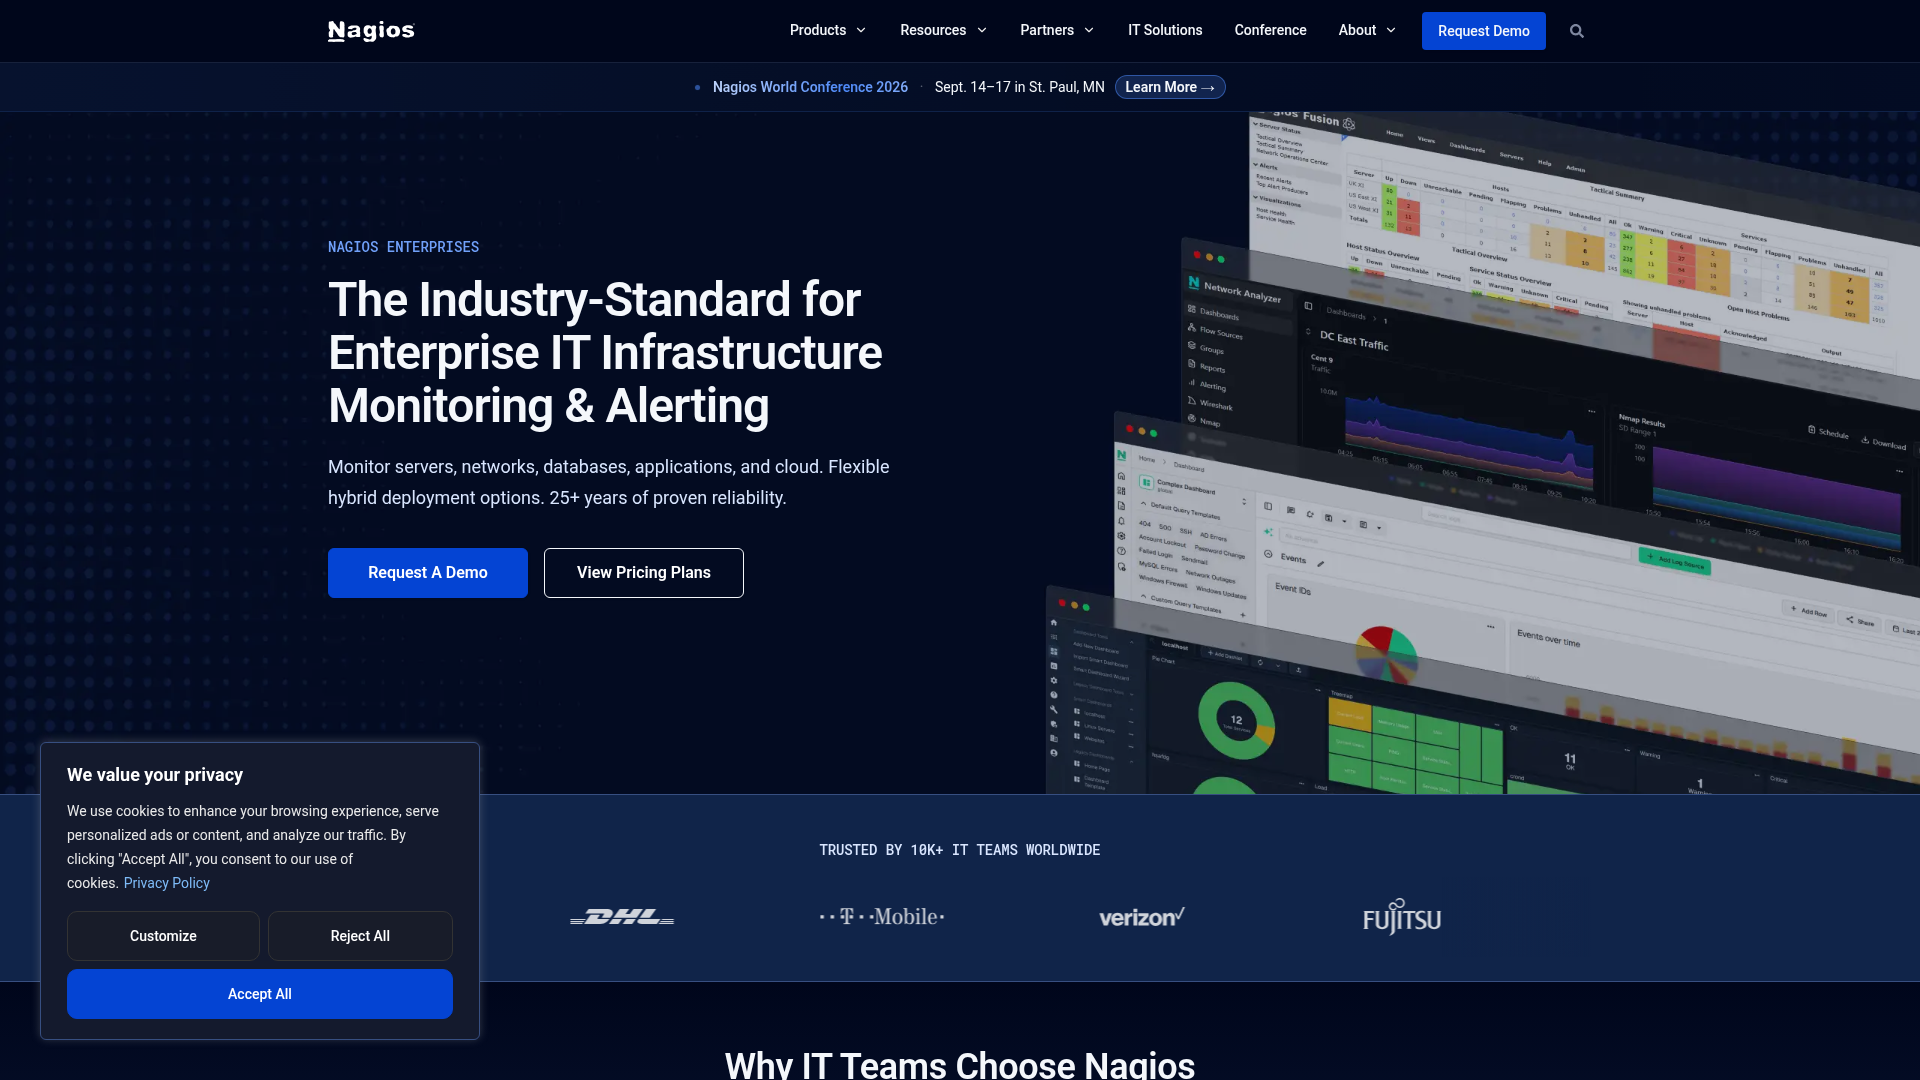
Nagios XI is an enterprise infrastructure monitoring and alerting platform for servers, networks, applications, databases, cloud workloads, and devices. Alongside the free Nagios Core, it offers customizable dashboards and a large plugin ecosystem with NRPE and NSCA for remote checks. IT, DevOps, and infrastructure teams use it for on-premises and hybrid monitoring.
Best for: IT and infrastructure teams needing on-premises monitoring with customizable dashboards and a plugin ecosystem.
Key strengths
- Broad infrastructure monitoring: Servers, networks, cloud workloads, databases, and devices.
- Customizable dashboards: Dashlets, status summaries, gauges, maps, and remote access shortcuts.
- Event-driven remediation: Escalation policies and multi-channel notifications including Slack and Teams.
Why choose Nagios XI: Nagios XI suits teams that value the proven plugin ecosystem and want commercial support on top of the Nagios foundation. It is less ideal for teams wanting modern SaaS and AI-driven analytics, since the architecture is a long-standing on-premises standard. Nagios Core remains a genuinely free path for the technically capable.
Nagios XI pricing: Nagios XI uses perpetual licensing. A free edition supports up to 7 nodes or 100 services. Standard pricing starts at $2,595 for a 100-node license and scales to $14,995 for 1,000 nodes. Enterprise pricing starts at $4,690 for 100 nodes. Nagios Core is free and open source.
12. LogicMonitor
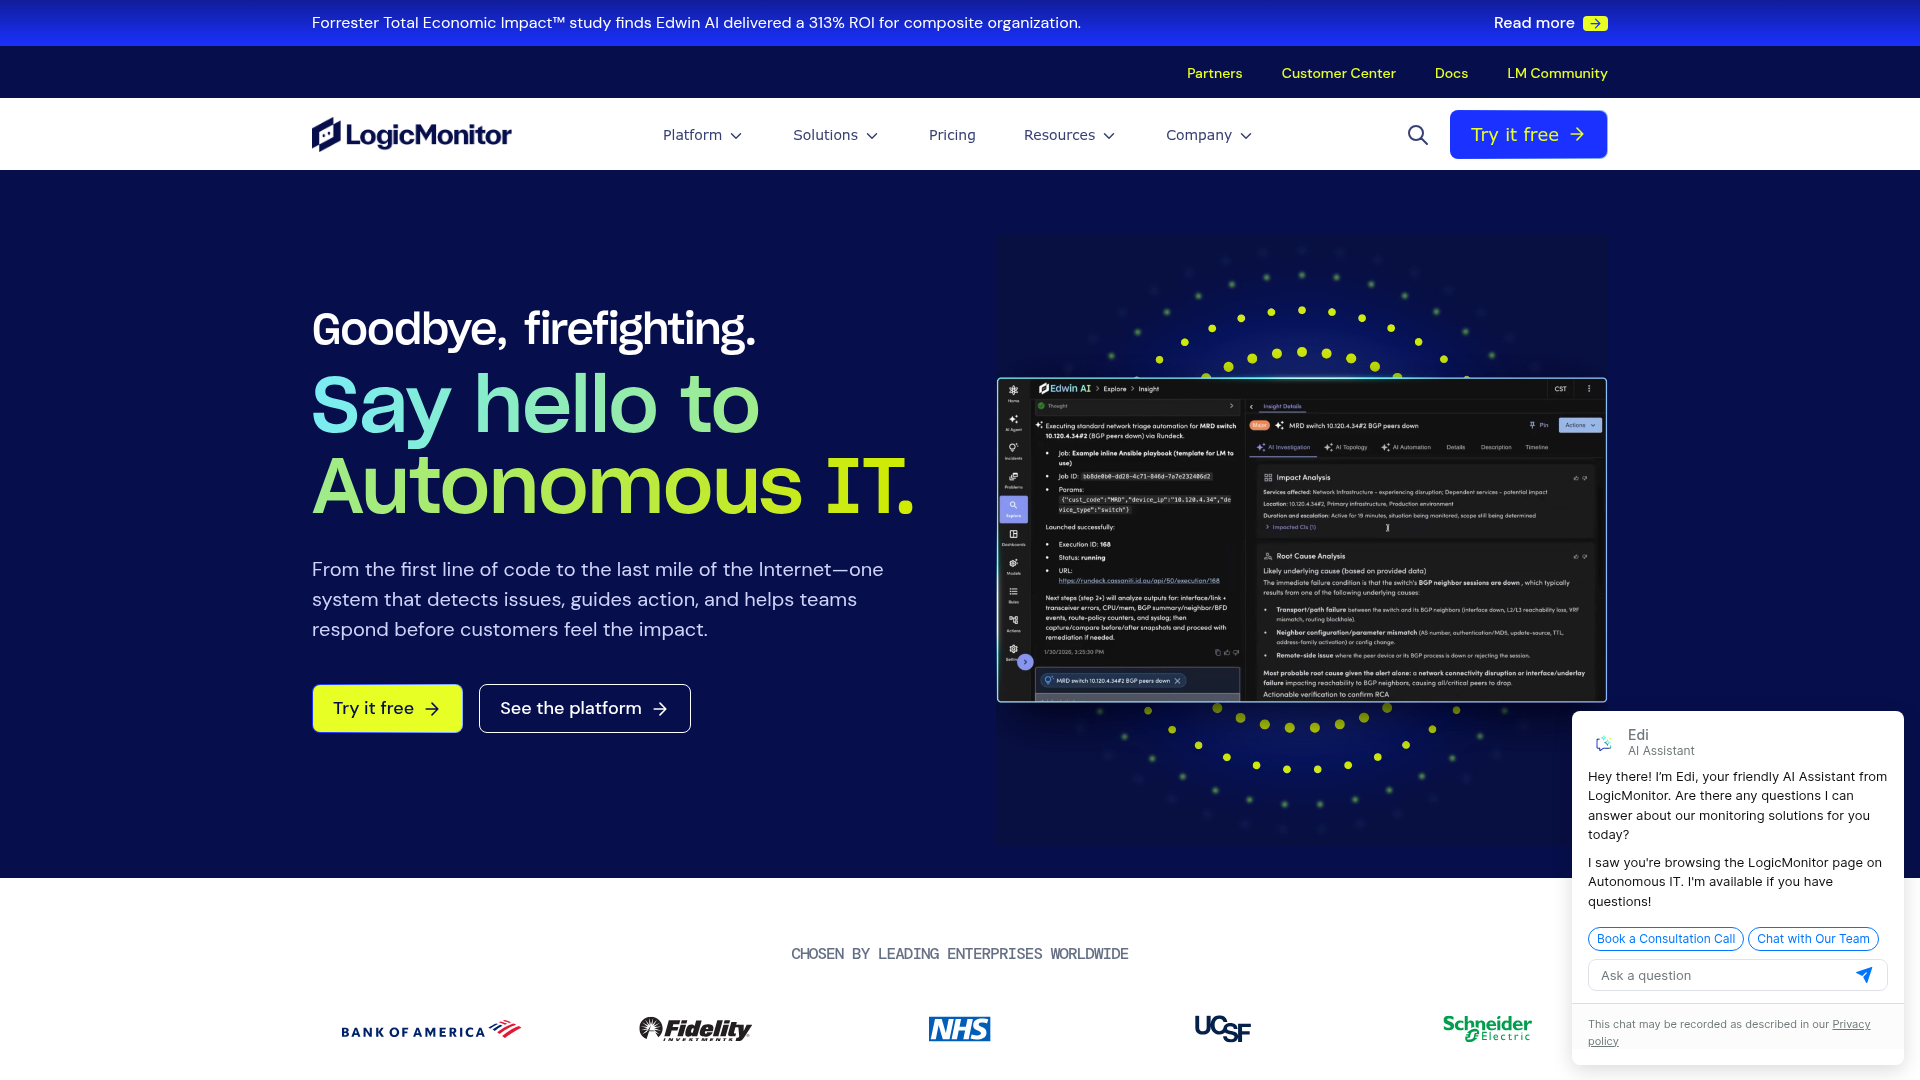
LogicMonitor provides LM Envision, an AI-powered hybrid observability platform for on-prem, cloud, applications, services, and IT infrastructure. It uses an agentless collector model and adds AI-driven event intelligence. ITOps, CloudOps, DevOps, and MSP teams use it for unified hybrid visibility.
Best for: ITOps and CloudOps teams needing unified hybrid infrastructure observability with AI-assisted incident reduction.
Key strengths
- Hybrid coverage: Monitor on-prem and cloud environments from one platform.
- AI event intelligence: Anomaly detection, dynamic thresholds, and forecasting.
- Deep integrations: Dashboards, reporting, topology mapping, and 3,000+ integrations.
Why choose LogicMonitor: LogicMonitor fits teams managing genuinely hybrid estates that want agentless deployment and AI to cut incident noise. It is less ideal for tiny environments or teams wanting a permanent free tier, since pricing targets larger hybrid fleets. A 15-day free trial lets you validate fit before purchase.
LogicMonitor pricing: Essentials starts at $16 per hybrid unit, Advanced at $27 per hybrid unit, and Signature plus Edwin AI at $53 per hybrid unit. These are starting monthly list prices based on standard minimums, and actual pricing varies by volume and contract. There is no permanent free tier, but a 15-day trial is available.
13. Checkmk
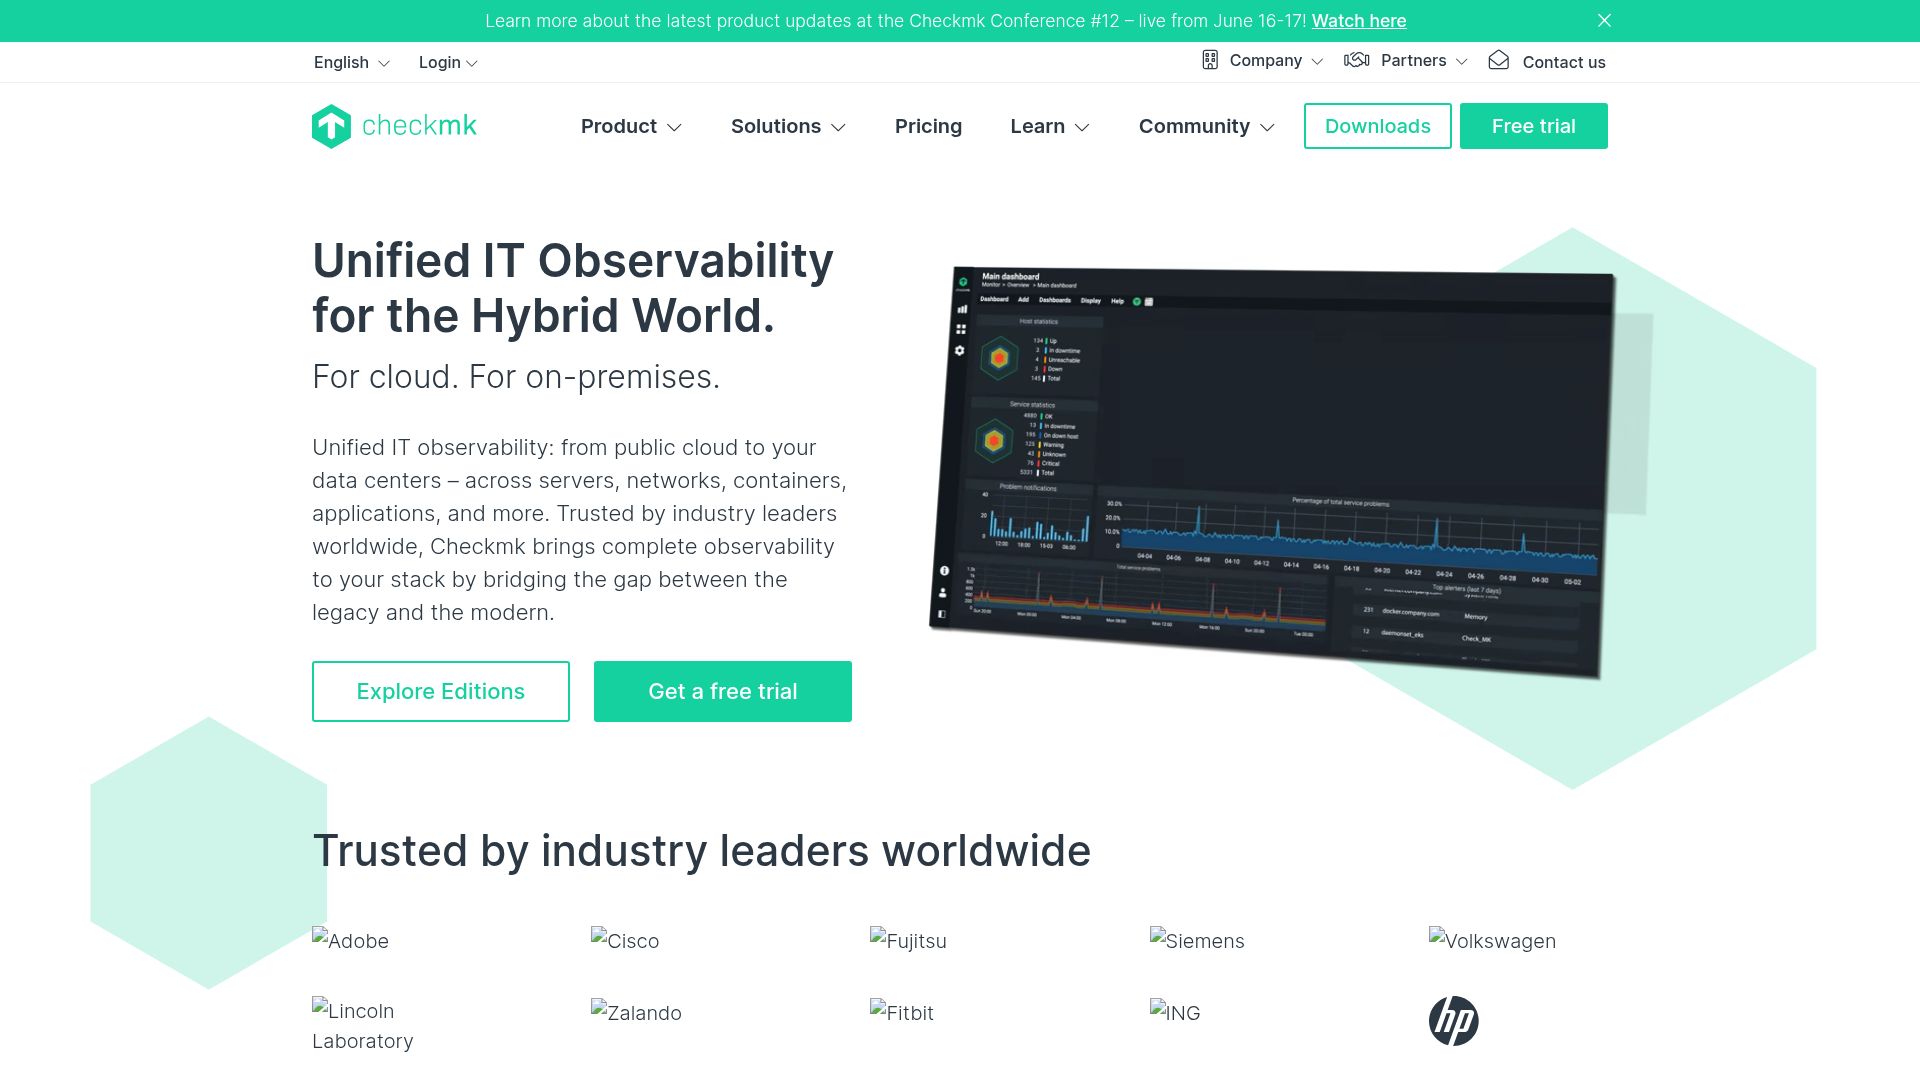
Checkmk is an IT monitoring and observability platform for infrastructure, applications, cloud, containers, networks, and synthetic user experience. It offers self-hosted and SaaS deployment with auto-discovery of hosts and services. IT, DevOps, and MSP teams use it for scalable hybrid monitoring.
Best for: IT, DevOps, and MSP teams needing scalable hybrid monitoring with self-hosted or SaaS options.
Key strengths
- Auto-discovery: Infrastructure monitoring that finds hosts and services automatically.
- Application observability: Native OpenTelemetry ingestion with visual metric exploration.
- Synthetic monitoring: User journeys, API calls, and web or desktop application checks.
Why choose Checkmk: Checkmk fits teams that want a free open source core plus a clear upgrade path to enterprise and SaaS. It is less ideal for teams seeking the deepest AIOps in the category, since its strength is fast, scalable infrastructure coverage. The Community edition is free forever and a solid starting point.
Checkmk pricing: The Community edition is free forever. Pro starts at $275 per month billed annually, and Ultimate at $400 per month billed annually. The Cloud SaaS edition starts at $290 per month. Pricing scales by services for infrastructure, custom metrics for application observability, and synthetic tests.
14. Icinga
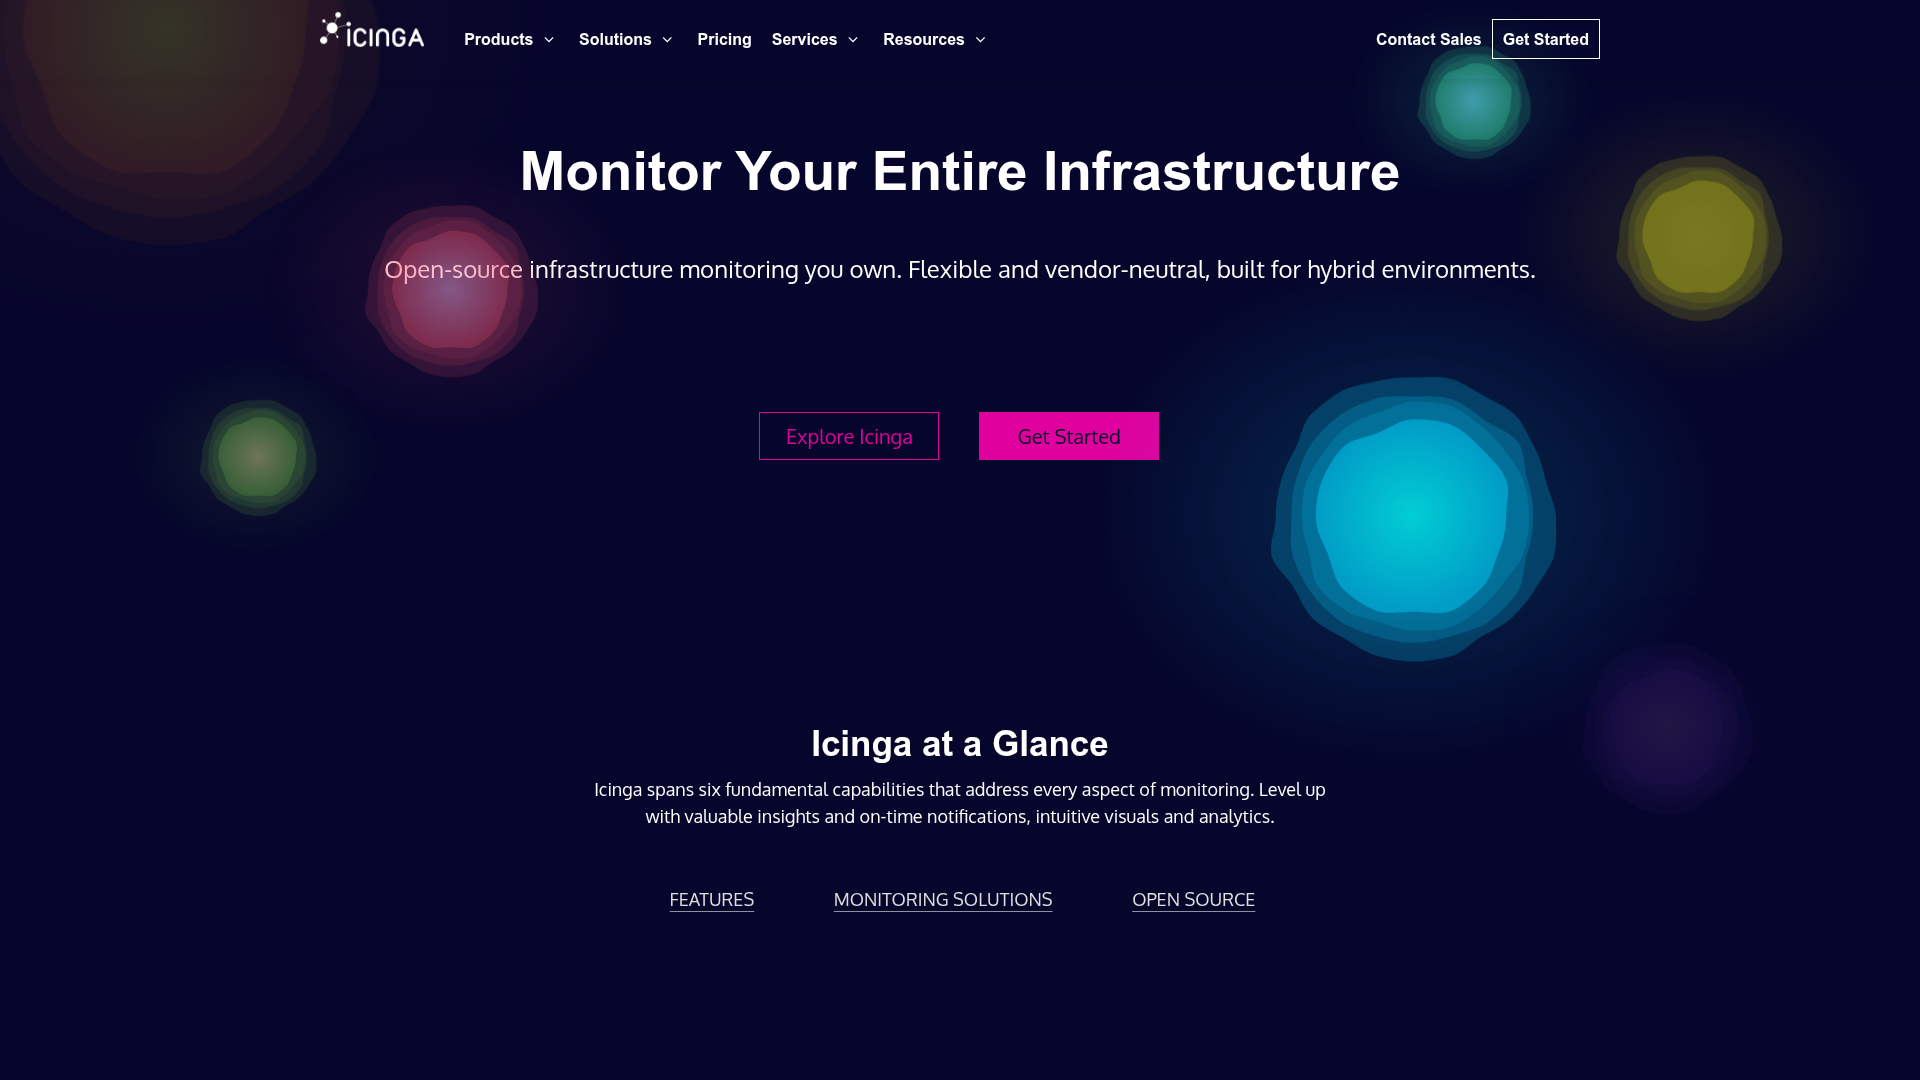
Icinga is an open-source enterprise monitoring platform for infrastructure, services, metrics, logs, automation, and notifications. Forked from Nagios in 2009, it adds modern tooling like Icinga Director for configuration. Organizations use it for flexible monitoring across large, heterogeneous environments.
Best for: Organizations needing flexible open-source infrastructure monitoring across large or hybrid IT environments.
Key strengths
- Infrastructure monitoring: Dashboards, custom views, notifications, and certificate monitoring.
- Monitoring automation: API access, apply rules, and versionized configuration rollback.
- Scaling and integrations: Plugins, DevOps data exchange, and built-in clustering.
Why choose Icinga: Icinga suits teams that want Nagios-style flexibility with a more modern configuration and automation layer. It is less ideal for teams wanting turnkey SaaS, since the open source model rewards hands-on setup. The Forever Free Edition covers unlimited hosts and services with no subscription needed.
Icinga pricing: The Forever Free Edition is open source with unlimited hosts and services, integrations, and automation, no subscription required. The Repository Subscription adds enterprise Linux packages at $5,000 per year. A Module Subscription is $2,000 per year, and Support Subscriptions start at $15,000 per year.
15. Netdata
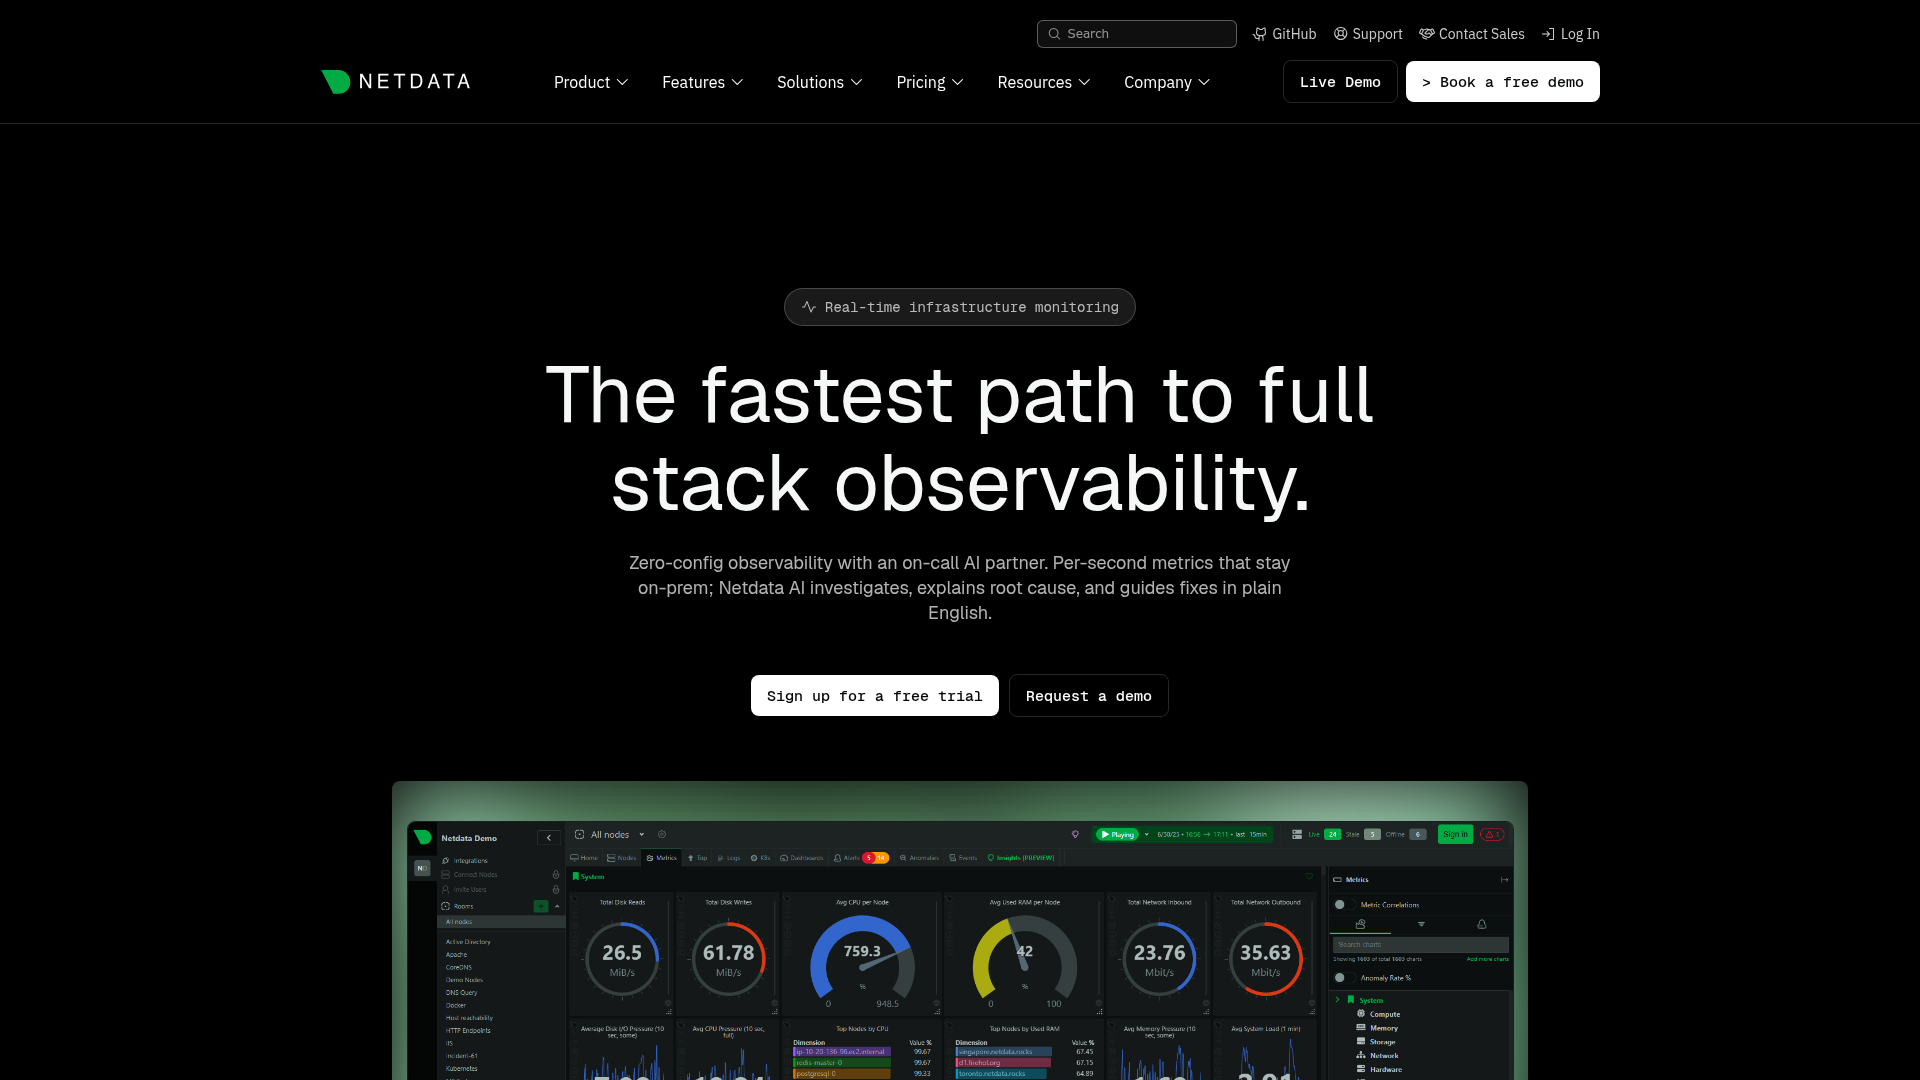
Netdata is a real-time observability platform for monitoring systems, containers, applications, and infrastructure with per-second metrics, dashboards, alerts, and ML anomaly detection. Its lightweight agent delivers sub-2-second latency with zero-configuration auto-discovery. Engineering, DevOps, SRE, and platform teams use it for real-time visibility.
Best for: Engineering and SRE teams needing real-time infrastructure observability with predictable per-node pricing.
Key strengths
- Per-second monitoring: Sub-2-second latency surfaces issues as they happen.
- 800+ integrations: Zero-configuration auto-discovery across your stack.
- AI-assisted troubleshooting: On-agent ML anomaly detection, root-cause analysis, and alerting.
Why choose Netdata: Netdata fits teams that want granular real-time metrics and a genuinely free tier for small fleets. It is less ideal for teams needing long historical retention on the free plan, since deep retention sits in paid tiers. The free Community plan covers up to 5 connected nodes with full real-time detail.
Netdata pricing: The Community plan is free for up to 5 active connected nodes. Business is $4.50 per node per month billed annually, including unlimited metrics, custom dashboards, data retention, RBAC, and SSO. Enterprise On-Premise is contact-sales and starts at 200 node licenses.
16. Elastic Observability
Elastic Observability is a full-stack observability platform for collecting, analyzing, and acting on logs, metrics, traces, and synthetic test data. It uses Elastic Agent and Beats within the Elastic Stack and adds AI-assisted troubleshooting. SRE, DevOps, and platform teams use it for OpenTelemetry-first observability.
Best for: SRE and platform teams needing OpenTelemetry-first, full-stack observability with AI-assisted investigation.
Key strengths
- Log analytics: Ad hoc analysis, dashboards, integrations, alerts, and notifications.
- Full-stack monitoring: Logs, metrics, traces, synthetic tests, and SLOs together.
- AI-assisted pipelines: Parsing, machine learning, and agentic AI workflow automation.
Why choose Elastic Observability: Elastic fits teams that already run the Elastic Stack and want logs, metrics, and traces in one place with strong search. It is less ideal for teams wanting simple flat-rate billing, since usage-based ingest pricing rewards careful data management. Retention and egress are priced separately, so model your data volumes.
Elastic Observability pricing: Elastic Observability Serverless uses usage-based pricing. Logs Essentials starts as low as $0.07 per GB ingested, and Complete starts as low as $0.09 per GB ingested for full-stack observability. Retention and egress are priced separately, with add-ons for synthetic monitoring and AI features.
17. AppDynamics
AppDynamics, now part of Splunk, provides application performance monitoring and observability for applications, infrastructure, databases, user experience, and business outcomes. It automatically discovers dependencies and traces business transactions. Enterprises use it for full-stack APM across traditional, hybrid, and business-critical applications.
Best for: Enterprises needing full-stack APM for traditional, hybrid, on-premises, and business-critical applications.
Key strengths
- Business transaction tracing: Automatic dependency discovery and root-cause analysis.
- Infrastructure monitoring: Visibility into servers, containers, networks, and Kubernetes clusters.
- Specialized add-ons: Real user monitoring, browser synthetics, database, and SAP monitoring.
Why choose AppDynamics: AppDynamics fits enterprises that lead with application performance and need to tie technical metrics to business transactions. It is less ideal for infrastructure-only teams or small shops, since it is APM-led and priced per vCPU core. The business-transaction lens is its differentiator for revenue-critical apps.
AppDynamics pricing: Infrastructure Edition starts at $6 per vCPU per month billed annually. Premium Edition, which adds application monitoring, is $33 per vCPU per month. Enterprise Edition is $50 per vCPU per month. Add-ons include Secure Application at $13.75 per CPU core and SAP monitoring at $95 per CPU core.
18. Progress WhatsUp Gold
Progress WhatsUp Gold is network monitoring software for unified infrastructure visibility, performance monitoring, traffic analysis, and threat detection. It maps networks, monitors devices, and adds traffic analysis and configuration management. IT teams use it for unified network, server, and application monitoring.
Best for: IT teams needing unified network, device, application, and traffic monitoring to improve uptime.
Key strengths
- Network mapping: Automatic discovery and device monitoring across the environment.
- Real-time alerts: Customizable dashboards keep the team focused on what matters.
- Add-on modules: Traffic analysis, log management, application, and virtualization monitoring.
Why choose WhatsUp Gold: WhatsUp Gold fits Windows-centric SMB and mid-market teams that want network and server monitoring in one familiar tool. It is less ideal for cloud-native or Linux-first teams, since its heritage is Windows infrastructure. The tiered device-based pricing makes capacity planning straightforward.
WhatsUp Gold pricing: Infrastructure Performance and Traffic Monitoring plans start with Business at $1,229 per year for 50 devices. Enterprise runs $2,049 per year and Enterprise Plus $3,469 per year for 50 devices. Enterprise Scale is quoted through sales. A free trial is available, but there is no free tier.
19. Centreon
Centreon is a business-aware IT monitoring platform for cloud, on-prem, hybrid, and edge infrastructure. It ships with 700+ monitoring connectors and ties technical signals to business services. Mid-market and enterprise IT operations teams use it for unified monitoring across diverse environments.
Best for: Mid-market and enterprise IT teams needing unified monitoring across hybrid cloud, server, and legacy environments.
Key strengths
- Broad connectors: 700+ monitoring connectors for cloud and legacy infrastructure.
- Event management: Alerting, notifications, and ITSM ticketing integration.
- Flexible reporting: Dashboards, graphical views, SLA monitoring, and API-centric integrations.
Why choose Centreon: Centreon fits teams that want to map infrastructure health to business services across hybrid and legacy estates. It is less ideal for tiny teams wanting a hosted, zero-setup tool, since it rewards configuration across its editions. The IT 100 Freemium tier covers up to 100 hosts at no cost.
Centreon pricing: Centreon offers SaaS and self-hosted editions. The self-hosted IT 100 Freemium tier is free for up to 100 hosts. The IT Edition runs 2.27 EUR per host, billed annually, and the Business Edition runs 4.53 EUR per host. SaaS IT Edition starts at 3.40 EUR per host. Pricing is listed in euros.
20. Pandora FMS
Pandora FMS is a flexible IT monitoring platform for networks, servers, logs, cloud and virtual environments, and user experience. It offers auto-discovery, network maps, and native cloud integrations for AWS, Azure, and Google Cloud. Organizations and MSPs use it for broad infrastructure coverage from one platform.
Best for: Organizations and MSPs needing broad infrastructure monitoring across networks, servers, cloud, and logs.
Key strengths
- Network monitoring: Auto-discovery, network maps, SNMP, IPAM, NetFlow, and config management.
- Cloud and virtual: Native integrations for AWS, Azure, Google Cloud, and major hypervisors.
- Device-based licensing: Licenses count devices, not individual sensors or checks.
Why choose Pandora FMS: Pandora FMS fits teams and MSPs that want flexible, device-based licensing and broad coverage from networks to user experience. It is less ideal for teams wanting the deepest AIOps in the category, since its strength is breadth and flexibility. The free plan is a practical entry point for evaluation.
Pandora FMS pricing: Pandora FMS offers a free plan plus ONE, Corporate, MSP, MaaS, RMM, and NMS plans across on-premise and SaaS. The ONE plan starts at 2,447 EUR on annual commitment, and the MSP plan runs 0.51 EUR per agent per month. Corporate pricing is custom. Pricing is listed in euros.
21. Atera
Atera is an AI-powered IT management platform for IT departments and MSPs that combines RMM, helpdesk, patch management, automation, and remote access. Its per-technician model covers unlimited endpoints. IT teams and MSPs use it for unified monitoring and support across many devices.
Best for: IT teams and MSPs wanting a per-technician platform for monitoring, remote support, ticketing, and patching.
Key strengths
- Remote monitoring and management: Real-time monitoring, alerts, and endpoint management.
- Ticketing and helpdesk: Service portal, IT automation, and AI Copilot included in plans.
- Patch management: Windows, macOS, Linux, and third-party software updates.
Why choose Atera: Atera fits MSPs and IT teams that want predictable per-technician pricing with unlimited endpoints, not per-device billing. It is less ideal for teams wanting deep, standalone observability, since it is an RMM-first platform. The free 30-day trial with no credit card lets you test the full workflow.
Atera pricing: Atera uses pay-per-technician pricing for unlimited endpoints, with all plans including AI Copilot, ticketing, and IT automation. Public plan prices are quoted through a contact-sales flow rather than listed numerically. A 100% free 30-day trial is available with no credit card required.
22. NinjaOne
NinjaOne is a unified IT operations platform for managing devices, protecting endpoints, and supporting employees. It combines endpoint management, patching, remote access, and service desk workflows in one console. IT teams and MSPs use it for unified endpoint and server monitoring.
Best for: IT teams and MSPs needing unified endpoint management, patching, remote access, and service desk workflows.
Key strengths
- Endpoint management: Unified visibility and control across the device fleet.
- Autonomous patch management: Keep systems current without manual effort.
- Remote control: Secure remote access for fast support.
Why choose NinjaOne: NinjaOne fits IT teams and MSPs that want endpoint and server monitoring bundled with patching, backup, and remote access. It is less ideal for teams wanting deep application observability, since it centers on IT operations and endpoint management. Pricing is flexible and per-device, quoted through sales.
NinjaOne pricing: NinjaOne states pricing is monthly or annual with flexible contracts and flexible per-device pricing. The pricing page uses a form and contact-sales flow rather than displaying public figures. A free trial is available to evaluate the platform before purchase.
23. LibreNMS
LibreNMS is a fully featured, community-driven network monitoring system with broad device support. It auto-discovers devices using CDP, LLDP, OSPF, BGP, SNMP, and ARP, and scales with distributed polling. IT and network operations teams use it for self-hosted monitoring and alerting.
Best for: IT and network operations teams needing self-hosted network monitoring with auto-discovery and alerting.
Key strengths
- Automatic discovery: Find devices via CDP, FDP, LLDP, OSPF, BGP, SNMP, and ARP.
- Customizable alerting: Notifications via email, IRC, Slack, and more.
- Distributed polling: Scale horizontally as your network grows.
Why choose LibreNMS: LibreNMS fits teams that want a free, SNMP-based network and server monitoring system they can self-host and extend. It is less ideal for teams wanting commercial support and SaaS convenience, since it is community-driven and self-managed. The open source model means zero licensing cost with full feature access.
LibreNMS pricing: LibreNMS is open source and free to self-host, with no published paid plans or licensing fees from the project. Budget for the infrastructure and engineering time to run and maintain it, then operate it at no software cost.
24. Sensu Go
Sensu Go is an agent-based monitoring and observability solution for DevOps and SRE teams that collects, filters, transforms, and routes monitoring events, metrics, and alerts. Its monitoring-as-code approach builds an end-to-end observability pipeline. DevOps and SRE teams use it for flexible monitoring across dynamic infrastructure.
Best for: DevOps and SRE teams needing flexible monitoring and observability pipelines across dynamic infrastructure.
Key strengths
- Observability pipeline: Collect, filter, transform, and route monitoring events end to end.
- Turn-key integrations: Elasticsearch, Splunk, PagerDuty, ServiceNow, and Ansible Tower.
- Security features: LDAP, Active Directory, OIDC, and mTLS certificate authentication.
Why choose Sensu Go: Sensu Go fits teams that treat monitoring as code and want to route events through a flexible pipeline. It is less ideal for teams wanting a turnkey dashboard tool, since it favors composability and configuration. The free tier supports up to 100 nodes with no trial required.
Sensu Go pricing: Sensu Go FREE supports individual use and very small teams up to 100 nodes with unlimited evaluation. Pro is $3 per node per month paid annually with a 100-node minimum. Enterprise is $5 per node per month paid annually with a 300-node minimum and unlimited nodes.
25. Microsoft SCOM
Microsoft SCOM, or System Center Operations Manager, is a System Center component for monitoring services, devices, applications, and operations across infrastructure from a unified console. It is built for Windows-centric and enterprise on-premises environments. Enterprises invested in Microsoft System Center use it for hybrid and on-prem monitoring.
Best for: Enterprises needing on-premises or hybrid monitoring that are already invested in Microsoft System Center.
Key strengths
- Unified monitoring: Track public and private infrastructure from one place.
- Health and availability: Performance and availability monitoring for monitored objects.
- Actionable alerts: Diagnostic information to identify problems and possible solutions.
Why choose Microsoft SCOM: SCOM fits Windows-heavy enterprises that already run System Center and want monitoring inside that ecosystem. It is less ideal for cloud-native or Linux-first teams, since it is on-premises and Windows-centric. Operations Manager comes bundled with System Center rather than sold separately.
Microsoft SCOM pricing: SCOM ships as part of System Center, which cannot be purchased separately. System Center 2025 Standard Edition has a suggested retail price of $1,455, and Datacenter Edition is $3,968, both assuming a 16-core, 2-processor server. There is no free tier, only evaluation entry points.
How to choose the right server monitoring tool
A shortlist is only useful if you weigh it against your actual environment. Run every candidate through these five checks before you trial anything.
Match the architecture to your environment
If you run Windows servers, confirm WMI support. If you have network gear you cannot install agents on, confirm SNMP. Cloud-native teams should prioritize agent-based depth and Kubernetes coverage. The collection method decides what you can see, so map it to your fleet first.
Confirm cloud, on-prem, and hybrid coverage
Few teams are pure cloud or pure on-prem. Verify the tool reaches every place your servers live, including AWS, Azure, GCP, your hypervisors, and any data-center hardware. Hybrid coverage in one console saves you from juggling separate dashboards.
Evaluate alerting depth and anomaly detection
Static thresholds break down as fleets scale. Check for dynamic baselines and anomaly detection that learn normal behavior. Then test how easy it is to route and silence alerts, because noise control is what keeps your on-call rotation sane.
Check the pricing model and how it scales
Pricing models vary wildly: per host, per sensor, per node, per device, per technician, or by data volume. Model your growth before you sign. A tool that looks cheap at 10 hosts can surprise you at 200, especially with usage-based observability platforms.
Verify integrations
Your monitoring tool should plug into the tools your team already lives in. Confirm support for PagerDuty, Slack, Microsoft Teams, ServiceNow, and any ITSM or ticketing system you use. Strong alert routing into these channels is what shortens mean time to resolution. If you also need to evaluate observability for your own product, browse the best session replay software to see how teams reconstruct user-facing issues.
Free vs paid vs open source: which fits your team
The free-versus-paid decision is really a question about where you want to spend: money or engineering time. Open source tools like Zabbix, Prometheus, Nagios Core, Netdata, LibreNMS, and Checkmk Raw carry no licensing cost, but they ask for setup and maintenance hours. Someone has to build, tune, patch, and own them.
Free works well when you have in-house ops capability, a single-stack environment, and time to invest up front. A capable SRE team running Kubernetes will get enormous value from Prometheus and Grafana at zero licensing cost. The "free" label hides a real cost, though: expertise and ongoing maintenance. Budget for it honestly.
Paid SaaS wins when you need scale, vendor support, AIOps, and hybrid coverage without staffing a monitoring team. Tools like Datadog, Dynatrace, and LogicMonitor handle the heavy lifting, ship dashboards out of the box, and reduce alert noise with machine learning. You trade dollars for time and reliability.
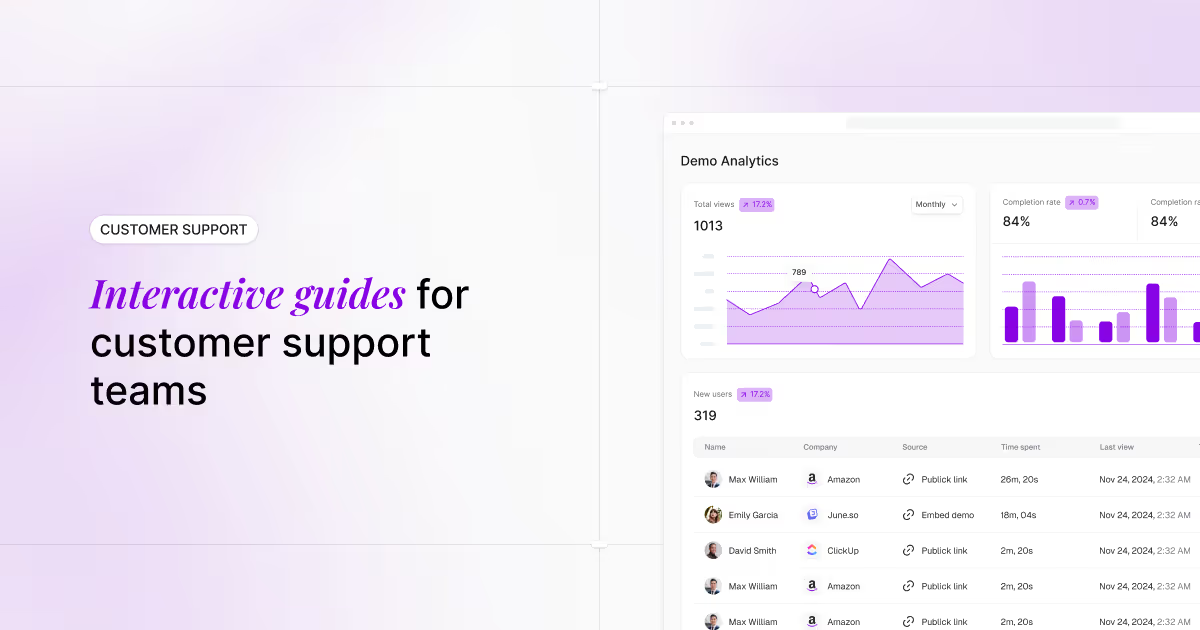
Many teams run a hybrid approach: open source for metrics collection, paid SaaS for correlation and on-call. There is no universally right answer, only the right fit for your team's size, skills, and budget. When you are ready to onboard your own team or customers onto a new monitoring tool, an interactive demo can shorten the learning curve dramatically.
| Team type | Recommended approach | Why |
|---|---|---|
| Lean IT team (1 to 5 people) | Free tier or low-cost SaaS | Fast setup, sensible defaults, minimal maintenance |
| In-house SRE / DevOps team | Open source (Prometheus, Zabbix) | Skill to build and tune, zero licensing cost |
| MSP managing many clients | Paid RMM (Atera, NinjaOne) | Per-technician scale and multi-tenant management |
| Enterprise with hybrid estate | Paid SaaS (Datadog, Dynatrace, LogicMonitor) | AIOps, support, and unified hybrid coverage |
Conclusion
There is no single best server monitoring software, only the best fit for your stack and team. For free and open source, Zabbix and Prometheus lead for teams with the skill to run them. For enterprise observability, Datadog and Dynatrace bring AI-driven, full-stack depth. MSPs are well served by Atera and NinjaOne. Lean IT teams get fast value from Paessler PRTG's free edition or Site24x7's all-in-one SaaS. Hybrid estates fit LogicMonitor and New Relic.
The honest next step is simple. Shortlist two or three tools that match your environment and pricing model. Spin up trials against your actual servers, not a sandbox demo. Then test the part that matters most: fire a real load scenario, watch the alerts trigger, and see whether the noise level is something your on-call rotation can live with. When rolling these tools out internally, building a demo library helps your team and customers ramp faster. Teams shipping their own monitoring product can also lean on the best user onboarding software and best digital adoption platforms to drive activation.
Most of these vendors offer a free tier or trial, so start with the one closest to your stack. Datadog, New Relic, and Checkmk all have free starting points worth a same-day test. Pick the tool that catches the 3am spike before your users do, and tune it before you commit.
FAQ
Server monitoring software continuously tracks server health, performance, and availability, including CPU, memory, disk, network, and uptime. It collects metrics on a schedule, compares them to thresholds, and alerts your team when something drifts out of range. It covers physical, virtual, and cloud servers from one place.
The core metrics are CPU usage, memory and RAM, disk space and I/O, network throughput, uptime, response time, and process or service health. Strong tools correlate these signals rather than reading them in isolation. Look for both threshold-based and anomaly-based alerting so you catch sudden spikes and slow drifts.
Genuinely free or open source options include Zabbix, Prometheus, Nagios Core, Netdata, LibreNMS, and Checkmk Raw. Paessler PRTG also offers a free edition for up to 100 sensors. Remember that free still requires setup and ongoing maintenance time, so factor in the engineering hours.
Yes. Most modern tools support hybrid coverage through agents, agentless polling, SNMP, and cloud integrations with AWS, Azure, and GCP. Many leading platforms unify all of it in one console. Verify the specific cloud platforms and hypervisors you run before you commit, since support depth varies by tool.
Agent-based monitoring installs software on each server for deeper, host-level metrics like process detail and custom application data. Agentless monitoring uses protocols such as SNMP, WMI, or APIs without installs. The trade-off is data depth versus deployment overhead. Most teams blend both: agents on critical servers, agentless for the long tail.
Prioritize fast setup, sensible defaults, a usable free or low-cost tier, and built-in alerting. Paessler PRTG's free 100-sensor edition and Site24x7's SMB-friendly plans are strong starting points. Avoid over-provisioning an enterprise observability platform you do not need, since the complexity and cost rarely pay off for lean teams.
Server monitoring focuses on host health and performance, like CPU, memory, and disk. Network monitoring focuses on traffic, devices, and connectivity across your infrastructure. Many tools do both, especially network monitoring tools like PRTG, OpManager, and WhatsUp Gold. If you need unified visibility, pick a tool that covers both domains in one console.
Most do. Common integrations include Slack, Microsoft Teams, PagerDuty, ServiceNow, email, and SMS. Alert routing into these channels matters because it shortens mean time to resolution by getting the right person paged fast. Confirm the specific integrations your team relies on, since coverage and depth differ across tools.