

You built the demo. You placed it on the landing page. Traffic is flowing.
But the click rate is stuck at 2%, and you're not sure whether the problem is the CTA, the placement, or the demo itself.
Demo click-through rate tells you whether your demo's positioning earns attention, but it doesn't tell you whether the demo converts. Most teams optimize the wrong thing. They tweak the demo content when the real problem is that nobody clicked to start it.
This guide covers what demo CTR actually measures and how it varies by format and channel. It also outlines nine specific strategies to get more people clicking before you worry about what happens after.
Summary of key takeaways
- Demo click-through rate measures initial engagement: It tells you what percentage of people clicked to start your demo, not whether they finished or converted.
- Interactive demos outperform passive formats: Clickable, self-guided experiences earn higher click rates than video because they promise immediate hands-on value.
- The biggest CTR lever is reducing friction: Remove gates, forms, and extra clicks before the demo starts. Optimize messaging second.
- Personalization lifts clicks at scale: Tailoring thumbnails, CTAs, and content by persona or use case makes demos feel relevant before anyone clicks.
- Track CTR alongside completion and conversion: A high click rate means nothing if viewers drop off immediately or never take the next step.
What is demo click-through rate
Demo click-through rate is the percentage of people who click to start or engage with your demo after seeing it. The formula is straightforward: divide the number of clicks by the number of impressions, then multiply by 100. If 1,000 people see your demo CTA and 50 click, your demo CTR is 5%.
This metric tells you whether your demo's positioning, placement, and promise are compelling enough to earn attention. However, it does not tell you whether the demo itself is effective. That's where completion rate and conversion rate come in.
Here's the distinction:
- Demo CTR: Measures initial engagement. Did they click to start?
- Demo completion rate: Measures follow-through. Did they finish?
- Demo conversion rate: Measures downstream action. Did they book a meeting, start a trial, or request pricing?
A common misconception is that high CTR alone means the demo is working. It doesn't.
You can have a 10% click rate and a 5% completion rate, which means 95% of the people who started your demo abandoned it. CTR is a leading indicator, not a success metric by itself.
Demo click-through rates benchmarks by format and channel
Benchmarks vary significantly depending on how you deliver your demo and where your audience encounters it. Understanding demo click-through rates by channel helps you set realistic targets. Rather than chasing a single "good" number, compare your performance against the format and channel you're using.
Interactive demo click rates
Interactive demos tend to outperform passive formats because they promise immediate, hands-on value. When the CTA says "Try it yourself" or "Explore the product," viewers know they'll be doing something, not just watching.
Click rates are highest when the CTA explicitly signals interactivity. "See how it works" performs better than "Watch our demo" because it implies participation rather than passive consumption.
Video demo click rates
Video demos have lower click rates because viewers anticipate a passive, time-consuming experience. The thumbnail and title carry the entire burden of earning the click.
If your video looks generic or the title doesn't promise a specific outcome, most visitors scroll past. Video works better for audiences who already know your brand and want a quick overview rather than hands-on exploration.
CTR for demos in email marketing
Email CTR for demos depends heavily on list quality, subject line, and how you position the demo in the email body. A demo link buried at the bottom of a long email gets fewer clicks than one placed prominently after a single pain-point sentence.
Inline preview images or animated GIFs can lift click rates by showing what the demo looks like before anyone commits. If your email marketing platform supports it, embed a preview frame rather than a plain text link.
Website and ad demo CTR
Placement matters more than you might expect. Demos placed above the fold get significantly more clicks than demos requiring a scroll. In paid ads, demo CTAs compete with ad fatigue, so creative quality and targeting precision affect CTR as much as the demo itself.
Embedded demos (where the experience starts inline) outperform demos that require navigation to a separate page. Sales teams often organize these in a demo center to maximize accessibility and engagement. Every additional click between the viewer and the demo costs you conversions.
9 strategies to improve demo click-through rates
The following nine approaches address the core question: how do you get more people to click on your demos? Each one is actionable and focused on a specific lever you can test.
1. Lead with the outcome not the feature
Frame your CTA around what the prospect will achieve, not what they'll see. "See how to close deals 30% faster" beats "Watch our CRM demo."
Outcomes create curiosity. Features create skepticism. When someone reads a feature-focused CTA, they wonder whether it applies to them.
When they read an outcome-focused CTA, they wonder how you'll deliver it. That curiosity drives clicks.
2. Keep demos under 10 steps
Perceived length kills clicks. If prospects think a demo will take too long, they won't start.
Communicate brevity in the CTA or preview. "2-minute product tour" or "5 steps to see how it works" sets expectations and reduces hesitation. If your demo genuinely requires more steps, consider breaking it into multiple shorter demos organized by use case.
3. Personalize content for each audience segment
Tailoring demo content, CTAs, and thumbnails by persona, industry, or use case makes the experience feel relevant before anyone clicks. This approach can drive about 10% uplift. A generic "See our platform" CTA converts worse than "See how marketing teams automate campaigns" for a marketing audience.
You can personalize demos for every prospect using dynamic variables that pull from your CRM. Each viewer sees content that matches their context without manual rebuilding.
4. Optimize CTA placement and copy
Place the demo CTA where attention is highest: above the fold, immediately after a pain point, or inline with relevant content. Don't bury it at the bottom of a long page.
"Try," "Explore," or "See." Avoid passive phrasing like "Learn more" or "Click here." The CTA copy often stands between a visitor and your demo.
5. A/B test thumbnails and titles
Small changes to the visual and headline that introduce your demo can meaningfully shift click rates. Test different screenshots, outcome-focused titles, and CTA button colors.
What works for one audience may not work for another. A technical buyer might respond to a dashboard screenshot, while an executive might respond to a headline about ROI. Systematic testing reveals what resonates with your specific audience.
6. Add branching paths for self-selection
Letting viewers choose their own path (by role, use case, or question) increases relevance and perceived value. When someone selects "I'm in sales" or "Show me reporting," they've already invested in the experience before it even starts.
Interactive demos support branching natively. Instead of forcing a linear walkthrough, give viewers choices at key decision points. This autonomy increases engagement and click-through because the demo feels tailored from the first interaction.
7. Remove friction from the first click
Every gate, form, or extra click before the demo starts reduces click-through, and removing forms drove 265% more demo requests. If you require an email address before showing the demo, you filter out many interested viewers. These are people who aren't ready to commit their contact information.
If lead capture is required, place it after the demo, not before. Let people experience value first, then ask for contact information when engagement is highest and they've seen what you offer.
8. Embed demos inline not behind gates
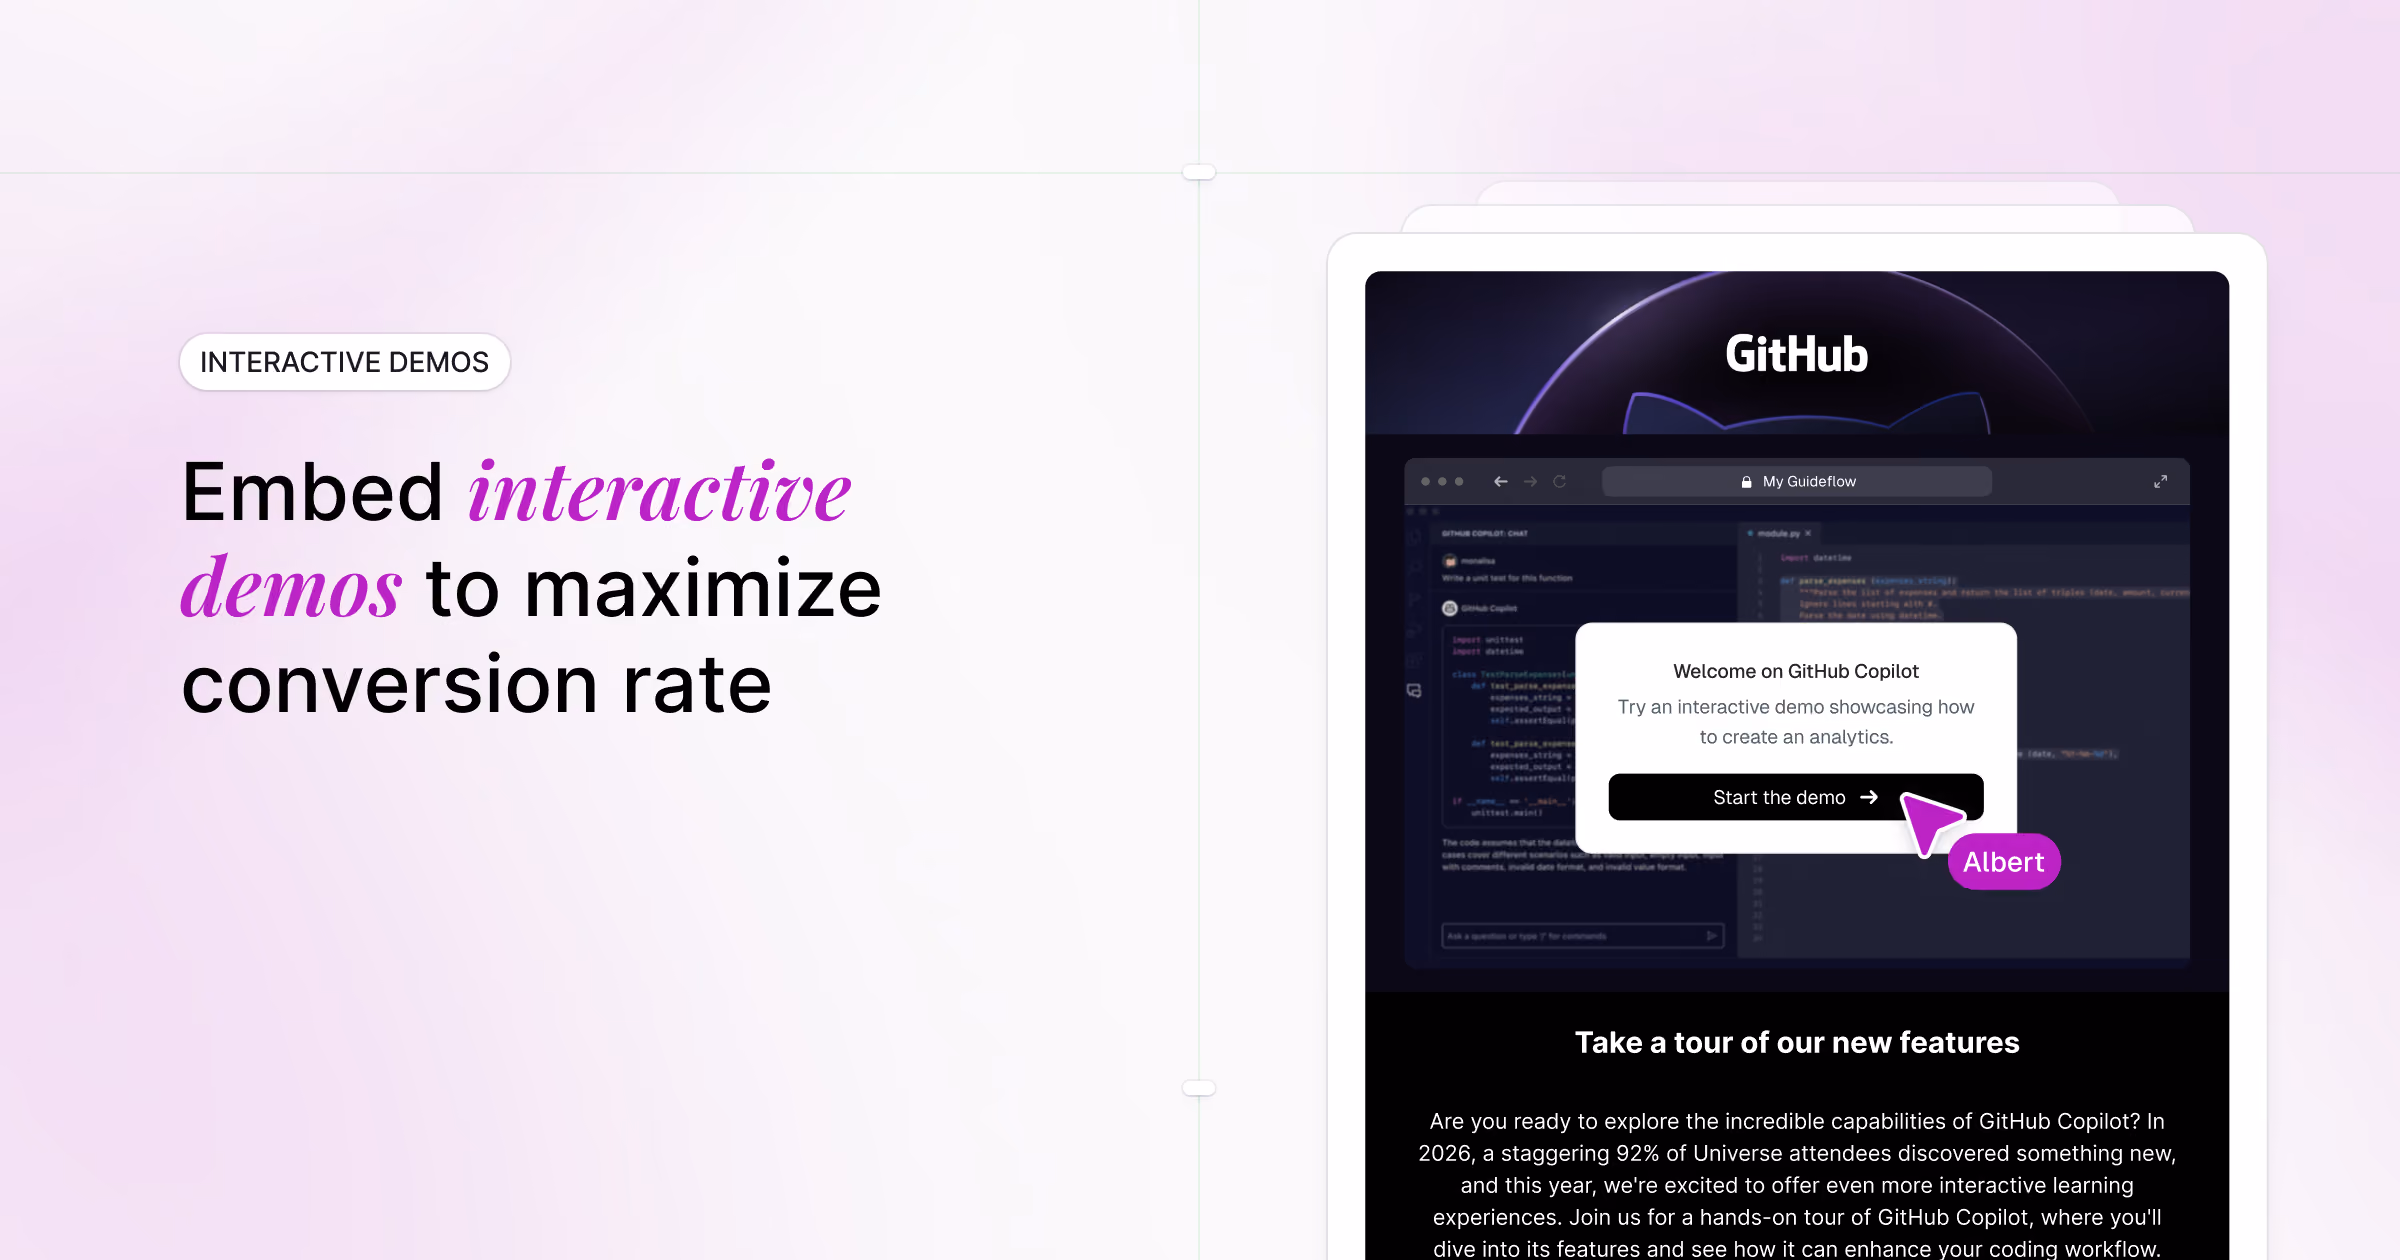
Embedding demos directly on landing pages, blog posts, and emails reduces friction and captures attention in context across the 3 to 7 pieces of content B2B buyers consume before reaching out. When the demo is right there, viewers don't have to navigate away or open a new tab.
Linked demos (where you click to go somewhere else) add a step. Embedded demos remove it. The difference in CTR can be substantial, especially for top-of-funnel traffic that hasn't committed to evaluating your product yet.
9. Optimize for mobile viewers
Mobile traffic is significant, 34.7% of B2B SaaS traffic comes from mobile, and demos that don't render well on phones lose clicks. If your demo looks broken or requires horizontal scrolling on mobile, visitors bounce before they start.
Test the demo experience on phones and tablets before publishing. Responsive design isn't optional. A demo that works perfectly on desktop but fails on mobile is leaving clicks on the table from a growing segment of your audience.
Why interactive demos outperform video on click rates
Interactive marketing formats consistently earn more clicks than passive video. The reasons are psychological, not just tactical.
The IKEA effect creates ownership
The IKEA effect describes how people value things more when they participate in creating or using them. Interactive demos trigger this dynamic by letting prospects "do" rather than "watch."
When someone clicks through a product themselves, they feel a sense of ownership over the experience. This increases motivation to click in the first place because the CTA promises participation, not passive consumption. The promise of doing something is more compelling than the promise of watching something.
Progressive disclosure reduces cognitive load
Interactive demos reveal information step by step, reducing overwhelm. Prospects feel more confident clicking when they know they control the pace and depth of exploration.
Video, by contrast, demands a time commitment upfront. Viewers don't know how long it will take or whether the content will be relevant to their situation. Interactive demos let people bail out early if it's not a fit, which paradoxically makes them more willing to start in the first place.
Common mistakes that kill demo CTR
The following errors suppress click-through rates. Each one includes a brief note on what works instead.
Burying the demo below the fold
If visitors have to scroll to find the demo, most never will. Attention is highest at the top of the page, and it drops off quickly as visitors scroll.
What works instead: Position the demo CTA above the fold or immediately after the first value proposition where eyes naturally land.
Using generic thumbnails
A bland or auto-generated thumbnail signals low value. If the preview image looks like a placeholder, viewers assume the demo itself is low-effort and not worth their time.
What works instead: Use a custom image showing the product in action or a clear outcome. Show the most visually compelling part of your product.
Too many steps before value
Long intros, gates, or loading screens before the demo starts cost you clicks. Every second of delay gives viewers a reason to leave and do something else.
What works instead: Get to value immediately. If you need context, provide it in the CTA copy, not in a pre-demo screen that adds friction.
Ignoring mobile experience
Demos that break or look poor on mobile lose a significant share of potential clicks. Mobile users are often browsing quickly and won't wait for a broken experience to load or struggle with a desktop-optimized interface.
What works instead: Test on multiple devices before publishing. Use responsive design and avoid elements that require hover interactions, which don't work on touchscreens.
Missing a clear CTA at demo end
Even if someone clicks and completes the demo, a missing or weak CTA at the end wastes the engagement. You've earned their attention, and letting it dissipate without direction is a missed opportunity.
What works instead: Always close with a specific next step. "Book a call," "Start your trial," or "See pricing" gives viewers a clear path forward.
How to track demo click-through rates
Measurement turns guesswork into optimization. Here's how to set up tracking that actually informs decisions.
Setting up UTM parameters for demo links
UTM parameters are tags added to URLs that track source, medium, and campaign in analytics tools. When you share a demo link in an email, on LinkedIn, or in an ad, UTM parameters tell you exactly where clicks came from.
Use a consistent naming convention across your team:
utm_source=linkedinutm_medium=socialutm_campaign=q1-product-launch
Without UTMs, you'll see clicks in your analytics but won't know which channel drove them, making optimization difficult.
Connecting demo analytics to your CRM
Integrating demo engagement data with your CRM ties clicks to pipeline and revenue. You can see which accounts engaged with demos, how deeply they explored, and whether they converted.
Platforms like Guideflow offer native integrations that connect demo analytics to HubSpot, Salesforce, and more. This lets you score leads based on demo engagement and prioritize follow-up accordingly based on actual behavior.
Measuring unique vs total CTR
Unique CTR counts each person once. Total CTR counts every click, including repeat visits from the same person.
- Unique CTR: Gives a cleaner view of reach. How many distinct people clicked?
- Total CTR: Reveals repeat engagement. How many times did people come back?
Both matter, but for different reasons. If your unique CTR is high but total CTR is similar, people are clicking once and not returning. If total CTR is much higher than unique CTR, you have repeat visitors, which often signals strong interest worth following up on.
Metrics beyond demo click-through rates
CTR is a leading indicator, but it doesn't tell the full story. The following related metrics reveal demo quality and downstream impact.
Completion rate
Completion rate is the percentage of people who finish the demo after starting. Low completion signals friction, misaligned expectations, or a demo that's too long for the value it delivers.
If your CTR is high but completion is low, the demo itself is the problem. The promise got people in the door, but the experience didn't deliver on that promise.
Time to first click
Time to first click measures how quickly a visitor clicks after the demo loads or becomes visible. Faster time indicates strong CTA positioning and clear value proposition.
If visitors see your demo CTA but take 30 seconds to click, something is creating hesitation. Test different placements, copy, or visuals to reduce that delay.
Feature exploration depth
Feature exploration depth shows which features or steps viewers engage with most. This reveals what prospects actually care about, not what you think they care about.
You can analyze engagement patterns to see which sections get the most attention and which get skipped. Use this data to reorder your demo or lead with the features that resonate most strongly.
Demo to meeting conversion
Demo to meeting conversion is the percentage of demo viewers who book a meeting or take a high-intent action afterward. This metric ties demo engagement directly to pipeline.
A demo with high CTR, high completion, but low meeting conversion may be educating without persuading. The content is interesting but not compelling enough to drive action toward the next step.
Turn demo click-through into qualified pipeline
Clicks only matter if they lead to qualified conversations. Improving demo click-through rates is only valuable when the right people engage with demos that move them toward a decision.
Start by removing friction. Gate demos after engagement, not before. Embed them where attention is highest.
Personalize content so every viewer sees something relevant to their situation.
Then measure what matters. Track CTR alongside completion, feature exploration, and conversion. Use engagement signals to prioritize follow-up and tailor your next conversation to what each prospect actually explored.
Guideflow helps teams create, personalize, and measure demos that convert. Capture any workflow directly from your browser, customize it for each prospect, and track engagement to see who's ready to buy.