Your support team sees the same complaint after every release: "The app crashed."
That phrase is almost useless on its own. Which build? Which device model? Which workflow was the user in when it happened? How many users hit it before engineering even saw the ticket?
Mobile crash reporting turns those fragments into a release-health signal your product and engineering teams can act on. According to a 2026 Luciq survey of more than 1,000 U.S. app users, 50.4% said they would leave an app after two or three crashes. That's not a support problem - it's an activation and retention risk sitting directly in your roadmap.
The practical question isn't whether you need mobile crash reporting. It's which platform gives your team the context to prioritize the right fix, track whether the fix worked, and avoid routing every field report through a slow reproduction loop.
This guide covers eight platforms evaluated for diagnostic depth, release-health visibility, SDK coverage, and PM-friendly instrumentation overhead.
What's inside
This guide is for product managers and engineering leads who need to shortlist a crash reporting platform before a release, monitoring-stack change, or reliability initiative.
- A side-by-side comparison of 8 mobile crash reporting tools, verified in October 2026
- Selection criteria: SDK coverage, diagnostic context, release analytics, workflow integrations, and pricing clarity
- Guidance on when crash reporting is enough versus when you need broader mobile observability
- PM-first framing: Affected users, support burden, and release confidence alongside the engineering view
TL;DR
- Best free option: Firebase Crashlytics for teams already on Firebase who need no-cost crash and ANR reporting without budget friction
- Best for full-stack visibility: Sentry for teams connecting mobile crashes to backend errors, performance issues, and engineering ownership workflows
- Best for release health metrics: BugSnag for stability scoring, release adoption tracking, and user-impact prioritization
- Best for deep mobile observability: Embrace for session-level context, ANR tracing, and performance analysis on difficult field issues
- Best for consolidated observability stacks: Datadog or New Relic, depending on which platform the team already runs for infrastructure and backend monitoring
- Best for qualitative crash context: Luciq, which pairs crash data with in-app user feedback for teams that need both signals
What is mobile crash reporting?
Mobile crash reporting software captures fatal crashes, nonfatal errors, and app hangs from production mobile apps, then groups issues and adds the context teams need to diagnose, prioritize, and fix them.
The category sits inside a broader application performance monitoring landscape, but its core job is narrower and more specific: Tell you what broke in production, who it affected, and how severe the impact is before you touch the backlog.
What mobile crash reporting collects
- Fatal crash reports with symbolicated stack traces
- Nonfatal exceptions and handled errors
- Android ANRs and app hangs
- Device model, OS version, and app version metadata
- Breadcrumbs and user actions leading to the failure
- Release adoption data and crash-free session rates
- Alerts for new, regressed, or high-velocity issues
How mobile crash reporting differs from mobile observability
Crash reporting answers: "What failed, which users were affected, and where did it happen?" Mobile observability adds startup time, rendering performance, network behavior, distributed tracing, and full session timelines. Both categories share some surface area, but they're built for different primary questions.
Start with crash reporting if your main unknown is production stability. Consider a broader observability platform when reliability questions span crashes, network failures, backend dependencies, and user-experience degradation in the same incident. Tools like those covered in our best product analytics software tools roundup can complement either approach by connecting stability signals to activation and retention metrics.
Why crash-free sessions matter more than raw crash counts
A crash-free session is any user session that completes without a fatal crash. The metric matters because it converts an absolute number into a proportion - you can compare it across releases, device cohorts, and rollout phases without volume distorting the picture. A spike in absolute crashes on a popular release can look alarming. The crash-free session rate shows whether the spike is proportional to adoption or an actual regression. Firebase Crashlytics documents crash-free users and crash-free sessions with filtering by build and Android Play track, which makes version-level comparisons straightforward.
When to use mobile crash reporting
Monitor every release for regressions
A release can pass QA and still fail for a specific device model, OS version, locale, or account segment. Crash-free sessions, new issue alerts, and version-level crash trends let you decide whether to pause a rollout, ship a hotfix, or continue expansion based on data rather than support volume. According to the Luciq Stability Outlook (2025), the median crash-free session rate across apps is 99.95%, so even small deviations from that baseline are meaningful signals.
Prioritize bugs by user and workflow impact
Affected-user counts, plan tier, and workflow context separate urgent fixes from noise. A crash during login, onboarding, or checkout deserves different urgency than a settings-screen edge case that affects two users per week. Use crash reporting to make that distinction visible in a PM-readable format, not just as an engineering backlog item.
Reduce the support-to-engineering reproduction loop
Logs, breadcrumbs, device metadata, and session replay compress the gap between a vague support ticket and a reproducible engineering task. The goal is not more telemetry for its own sake. The goal is a first engineering response that doesn't start with "can you tell us what device you were using?"
Mobile crash reporting tools comparison
The eight platforms below represent different points on the spectrum from lightweight crash capture to full mobile observability. No single tool wins across all dimensions. The right choice depends on your existing stack, your team's instrumentation capacity, and whether your hardest issues are isolated crashes or cross-system failures.
| # | Product | Best for | Key differentiator | Pricing | G2 rating |
|---|---|---|---|---|---|
| 1 | Firebase Crashlytics | Firebase-based mobile teams | No-cost crash and ANR reporting, Google integrations | Free | 4.4/5 |
| 2 | Sentry | Full-stack engineering teams | Mobile crash plus backend errors, tracing, and release health | Free plan; paid from $29/month | 4.5/5 |
| 3 | BugSnag | Stability-led product teams | Stability scoring, release adoption, and error prioritization | Free tier; paid plans contact BugSnag | 4.3/5 |
| 4 | Datadog | Teams already using Datadog | Mobile RUM and error tracking inside a unified observability stack | From $1/month (infrastructure); RUM usage-based | 4.4/5 |
| 5 | New Relic | Broad observability adoption | Mobile monitoring within a full-stack platform; generous free tier | Free tier (100 GB/month ingest); paid from $10/month | 4.4/5 |
| 6 | Embrace | Mobile-first observability | Session-level context, ANR tracing, and OpenTelemetry alignment | Free up to 1M sessions/year; Pro usage-based | 4.8/5 |
| 7 | Luciq | Teams needing crash plus user feedback | Crash reporting paired with in-app feedback, funnel analysis, and AI debugging | Custom pricing by daily active users | 4.3/5 |
| 8 | Raygun | Crash reporting with real user monitoring | Error diagnostics alongside frontend performance and user sessions | From $40/month (annual) | 4.3/5 |
Pricing and G2 ratings verified from vendor pricing pages and G2 listings, October 2026.
Best mobile crash reporting tools for 2026
1. Firebase Crashlytics
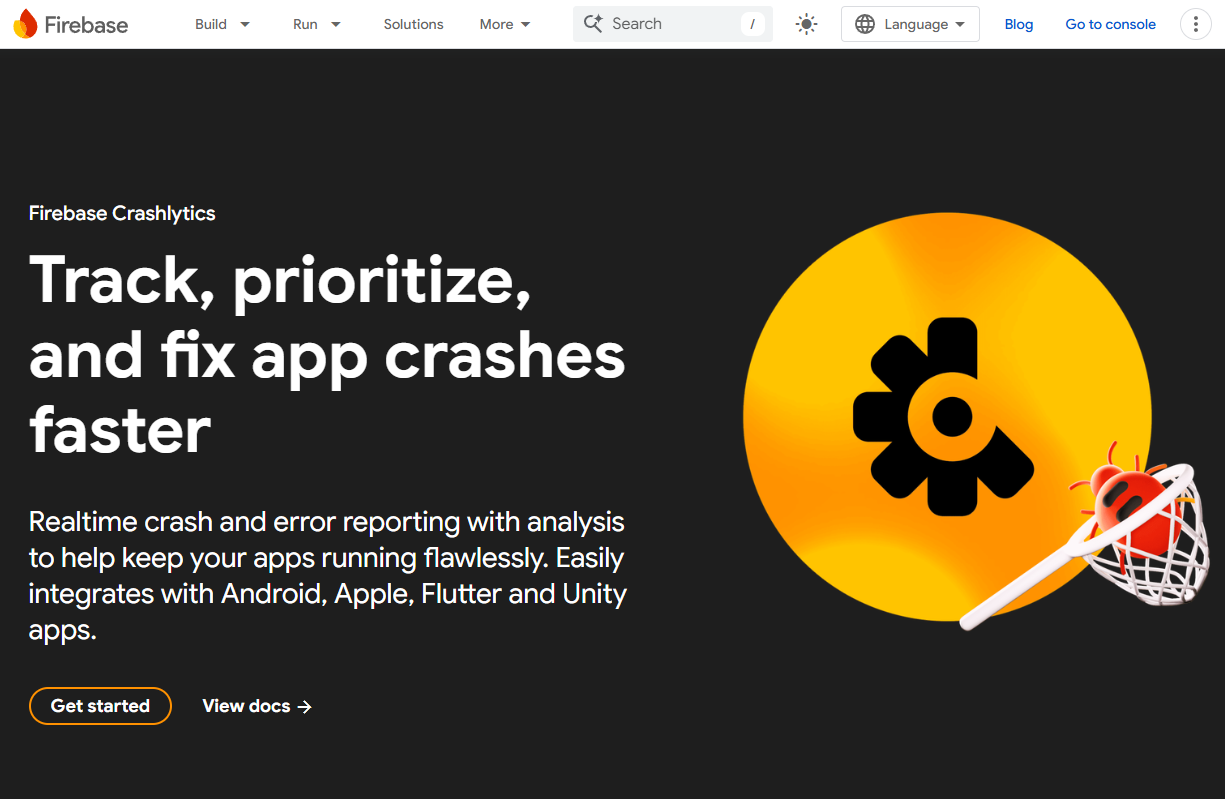
Firebase Crashlytics is Google's no-cost crash and error reporting product for Android, iOS, Flutter, and Unity apps. It groups issues by impact, surfaces realtime alerts for new and regressed problems, and integrates directly into the Firebase console your team likely already uses. Android Studio App Quality Insights brings crash data into the IDE, so engineers can jump from issue to code without switching tabs.
Best for: Product teams on Firebase who want a solid crash-reporting foundation without adding cost or a new vendor relationship.
Key features
- Fatal crash and nonfatal error capture with issue grouping
- Android ANR reporting with realtime alerts
- Crash-free users and sessions by release and Play track
- AI-powered crash insights and troubleshooting suggestions
- Integrations with Jira, Slack, BigQuery, and Android Studio
Why choose Firebase Crashlytics: It's the right starting point when the team already lives in Firebase and the immediate priority is stable releases with clear grouping. If you later need deeper session context, performance tracing, or cross-stack observability, you can layer on additional tooling without abandoning the crash data you've already collected.
Firebase Crashlytics pricing: Crashlytics has no cost on both Firebase Spark and Blaze plans. Google lists it among Firebase's no-cost products with no session or event caps tied to the crash feature specifically.
G2 rating: 4.4/5 (verified October 2026).
2. Sentry
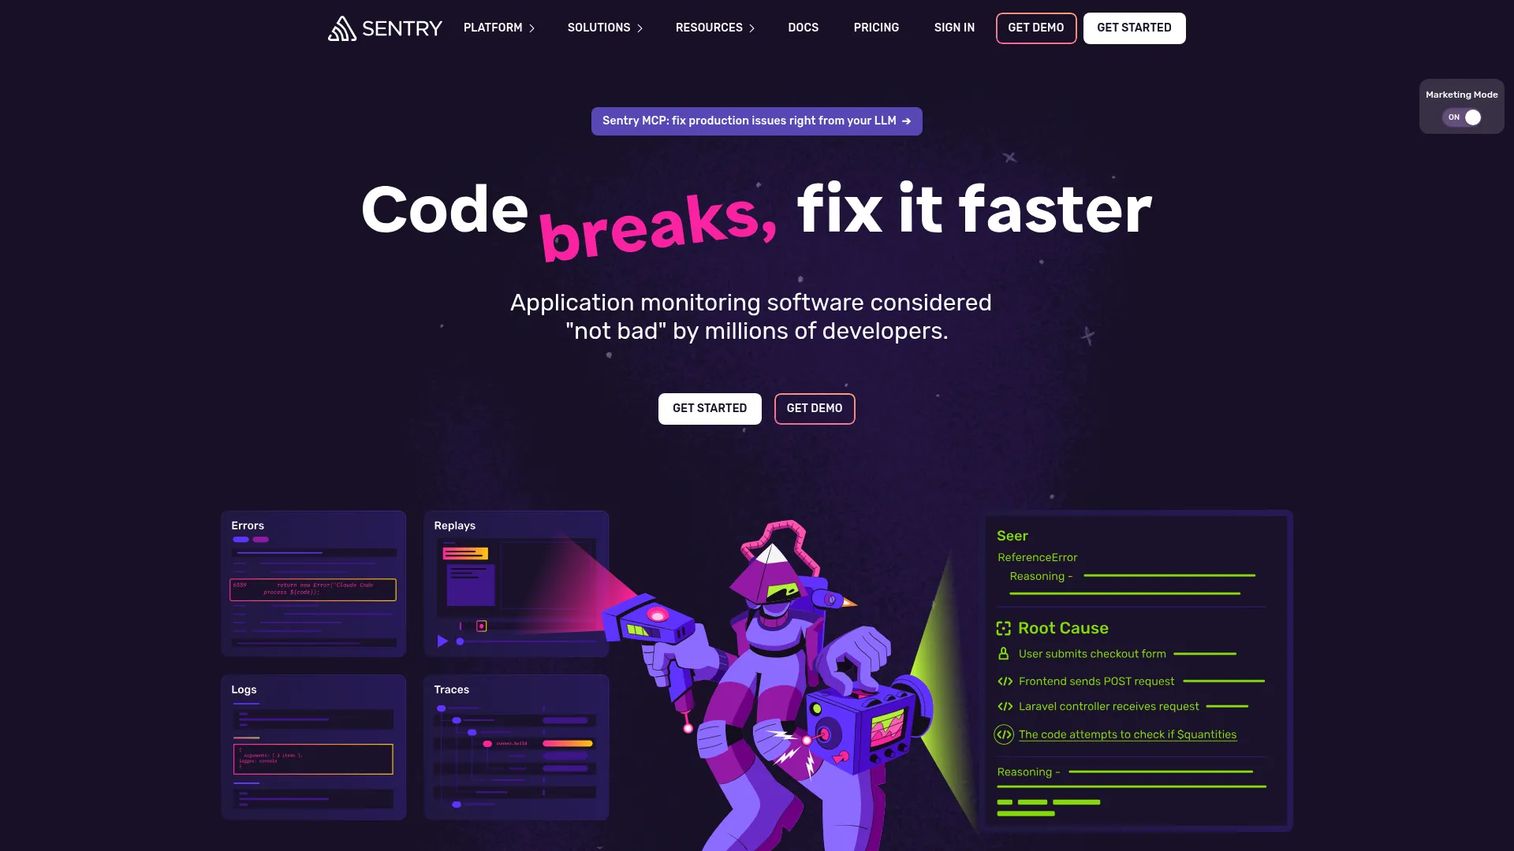
Sentry started as an error tracking tool and has grown into a full application monitoring platform covering mobile crashes, backend errors, distributed tracing, logs, session replay, and release health. Its mobile SDK supports iOS, Android, Flutter, React Native, and Unity. Breadcrumbs, device context, suspect commits, and ownership routing give engineering teams a clear line from issue detection to code owner, which shortens the cycle between a PM flagging a problem and a developer knowing where to start.
Best for: SaaS teams that need one workflow for mobile crashes, backend errors, performance regressions, and release decisions - without maintaining separate tooling for each signal.
Key features
- Crash and ANR issue grouping with stack traces and breadcrumbs
- Crash-free sessions and release health tracking
- Session Replay for visual issue reproduction
- Suspect commits and code ownership routing
- Distributed tracing and performance monitoring across services
Why choose Sentry: The best fit when Product and Engineering need shared evidence around a release regression. Its value rises when you can't tell whether a mobile crash originates in the app, the API, or a downstream dependency.
Sentry pricing: A free Developer plan covers one user. The Team plan starts at $29/month (billed monthly) and the Business plan at $89/month. Enterprise pricing requires a sales conversation. Pricing is event-based, so cost scales with volume.
G2 rating: 4.5/5 (verified October 2026).
3. BugSnag
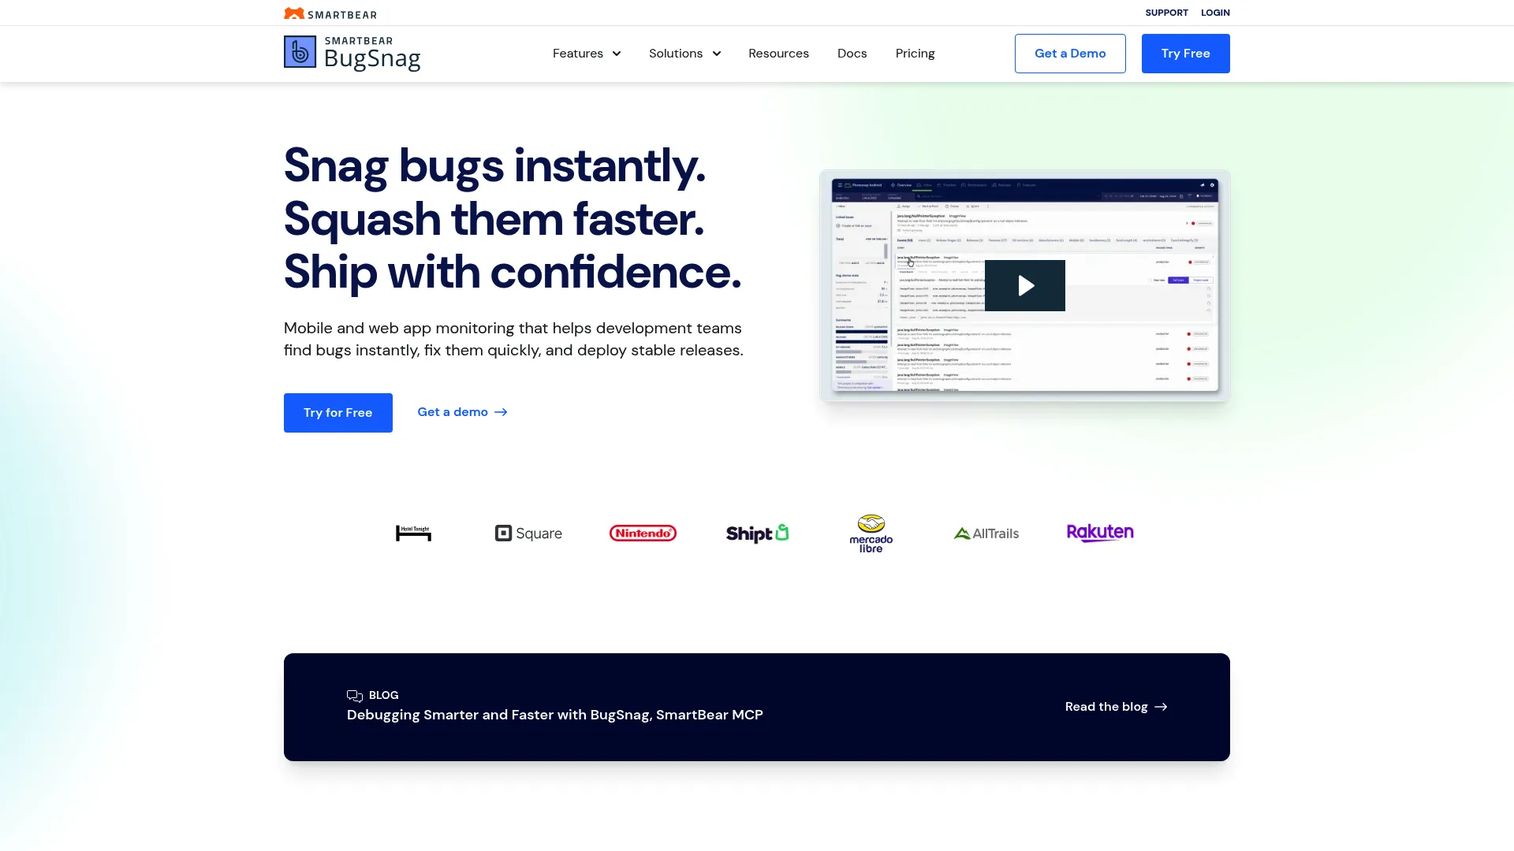
BugSnag positions stability as a managed product metric rather than an engineering backlog problem. Its Stability Center lets teams set stability targets by release, track adoption alongside crash-free rates, and get automatic error prioritization based on affected-user counts. It covers more than 50 platforms, so cross-platform teams don't need separate tooling for web, mobile, and backend errors. Feature flag and experiment monitoring connect release changes to stability outcomes directly.
Best for: Product and engineering teams that want release health visible at the PM level, with stability targets and adoption curves that inform go or rollback decisions.
Key features
- Error prioritization by affected-user count and workflow impact
- Stability Center with release adoption and stability scoring
- User interaction breadcrumbs and diagnostic data
- Feature flag and experiment monitoring
- Error assignment and custom alert routing
Why choose BugSnag: Strong when the team wants stability to live in product planning, not just the engineering queue. Its release adoption view makes it easier to separate a crash spike caused by broad rollout from a genuine regression.
BugSnag pricing: The free plan includes one user, 7,500 events, and 1 million spans monthly. Select and Preferred tiers add prioritization depth, segmentation, and support capabilities; both scale by event and span volume. Enterprise pricing requires a conversation with BugSnag. A 14-day Enterprise trial is available.
G2 rating: 4.3/5 (verified October 2026).
4. Datadog
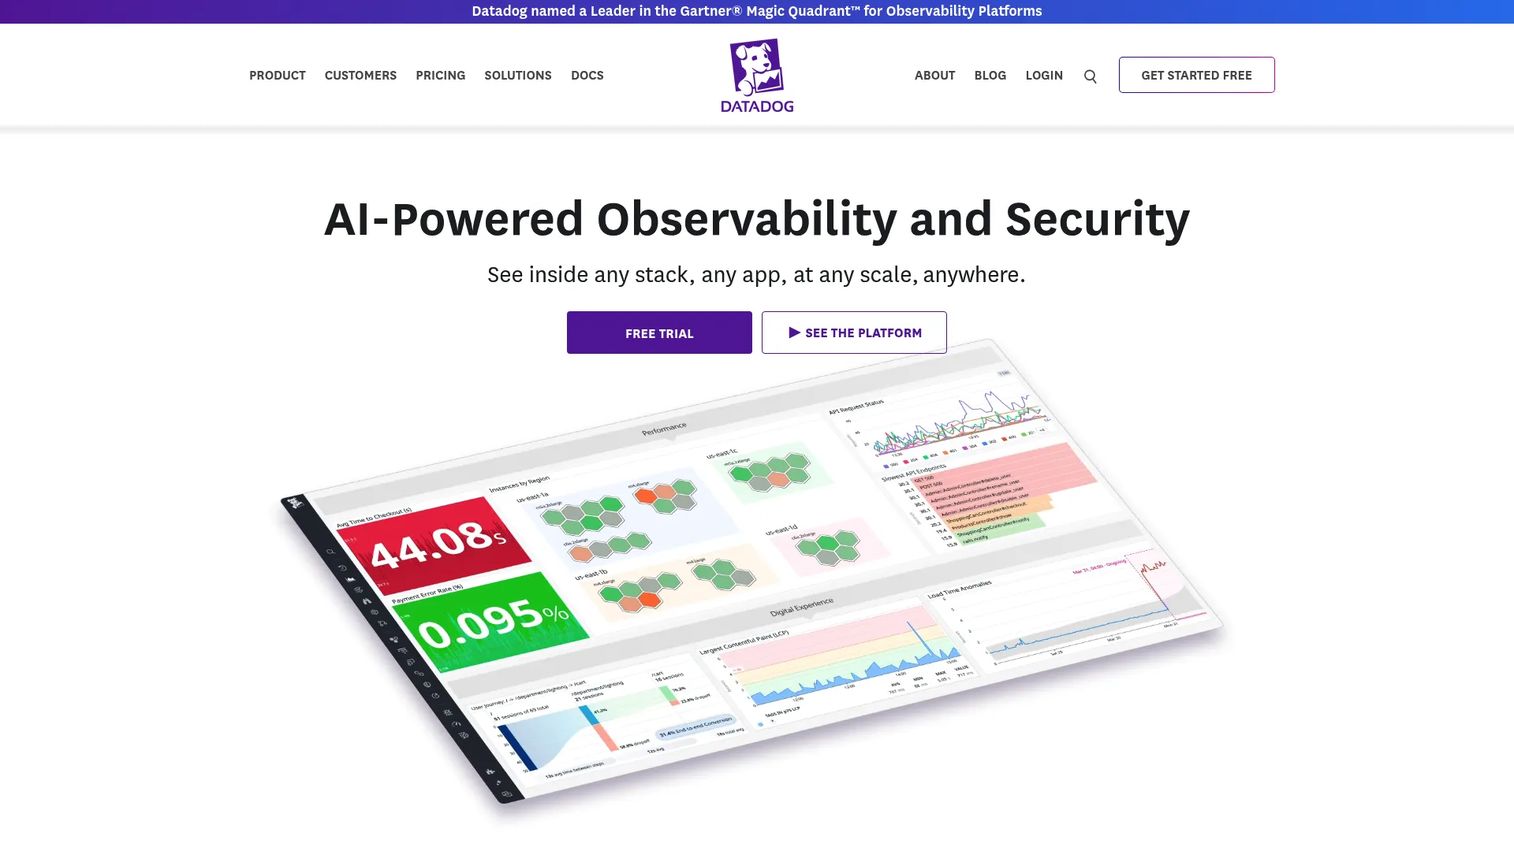
Datadog is a broad observability platform where mobile crash reporting lives inside Mobile Real User Monitoring and Error Tracking rather than as a standalone product. If your team already pays for Datadog across infrastructure, logs, and backend services, adding mobile error tracking means crash signals appear in the same dashboards as service health, latency, and deployment events. Session Replay, SLOs, and alerting are available across the same platform.
Best for: Larger engineering organizations that need mobile crash signals connected to backend latency, infrastructure changes, or service incidents - and already operate Datadog for those layers.
Key features
- Mobile RUM for Android and iOS with crash and error tracking
- Session Replay and user journey analysis
- Alerts, monitors, and SLO tracking
- Cross-stack dashboards correlating mobile and backend signals
- Mobile SDK support for React Native and Flutter
Why choose Datadog: Worth evaluating when the team already pays for Datadog and wants to eliminate dashboard-switching during serious release regressions. The unified view can compress incident response time when a mobile crash traces back to a backend service degradation.
Datadog pricing: Infrastructure Pro starts at $15 per host per month (billed annually). Mobile RUM and Error Tracking are usage-based products with their own rate cards: RUM Measure starts at $0.15 per 1,000 sessions monthly when billed annually, and Error Tracking starts at $25/month for up to 50,000 errors. Session Replay starts at $2.50 per 1,000 sessions (billed annually). Confirm current rates at the Datadog pricing list before committing to a budget.
G2 rating: 4.4/5 (verified October 2026).
5. New Relic
New Relic offers mobile monitoring as part of a full-stack observability platform covering application performance, infrastructure, browser, logs, and synthetic testing. Its mobile crash analytics dashboard shows crashes grouped by app version, with user interaction history preceding each failure. The unlimited basic user model is particularly useful for PMs: You can give product, support, and QA teams access to release health dashboards without purchasing engineering-grade licenses for everyone.
Best for: Teams already using New Relic for backend and infrastructure monitoring who want mobile crash data in the same observability layer without adding a separate vendor.
Key features
- Mobile crash analytics grouped by app version and frequency
- Mobile application instrumentation with user interaction context
- Release and version segmentation with alerting
- Cross-platform observability from a single account
- Unlimited basic users for shared dashboard access
Why choose New Relic: A solid option when crash reporting needs to fit a larger observability program. The free tier's 100 GB monthly data ingest covers meaningful production volume for many teams before any paid usage begins.
New Relic pricing: The free tier includes 100 GB of monthly data ingest, one free full-platform user, and unlimited basic users. Data ingest beyond the free allowance starts at $0.40 per GB. The Standard edition starts at $10/month for the first full-platform user. Pro runs $349 per user per month on an annual commitment. Enterprise pricing is custom.
G2 rating: 4.4/5 (verified October 2026).
6. Embrace
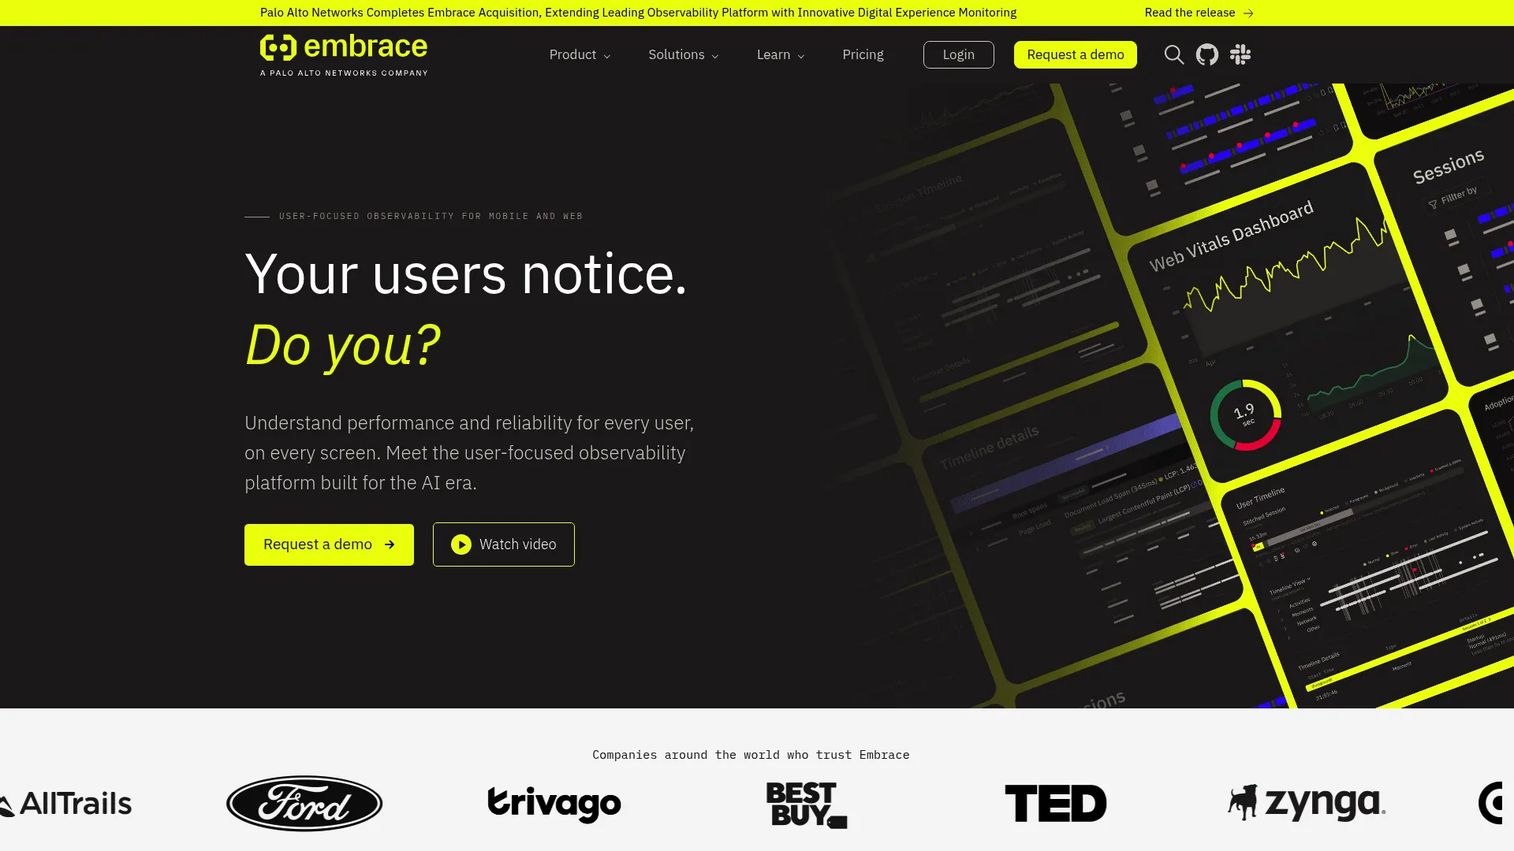
Embrace is built specifically for mobile and web observability, and it shows in the depth of its session-level data. Every crash surfaces inside a full user session timeline: Network calls, UI events, ANR traces, thread profiling, and performance milestones visible in sequence before the failure. Its OpenTelemetry alignment means telemetry can flow into existing backend observability pipelines without custom connectors. For PMs, the key value is being able to answer "what was the user doing?" without asking engineering to reconstruct the path manually.
Best for: Mobile product teams investigating difficult field issues where basic stack traces are not enough to understand what the user experienced.
Key features
- Crash and exception reporting with full session timelines
- ANR detection and thread profiling
- Performance tracing with OpenTelemetry export
- Network performance context alongside crash events
- Custom metrics, dashboards, and alerting
Why choose Embrace: The strongest choice when the team's hardest issues are hard to reproduce and involve interactions between crashes, network failures, and slow UI rendering. It's particularly relevant for apps where ANRs are more common than outright crashes.
Embrace pricing: Free covers up to 1 million sessions per year for up to five users. Pro pricing is usage-based: 1 to 5 million sessions run at $80 per 100,000 sessions, with rates stepping down at higher volume (20 million sessions: $70 per 100,000; 25 million sessions: $50 per 100,000). Enterprise pricing is custom and requires a demo conversation.
G2 rating: 4.8/5 (verified October 2026).
7. Luciq
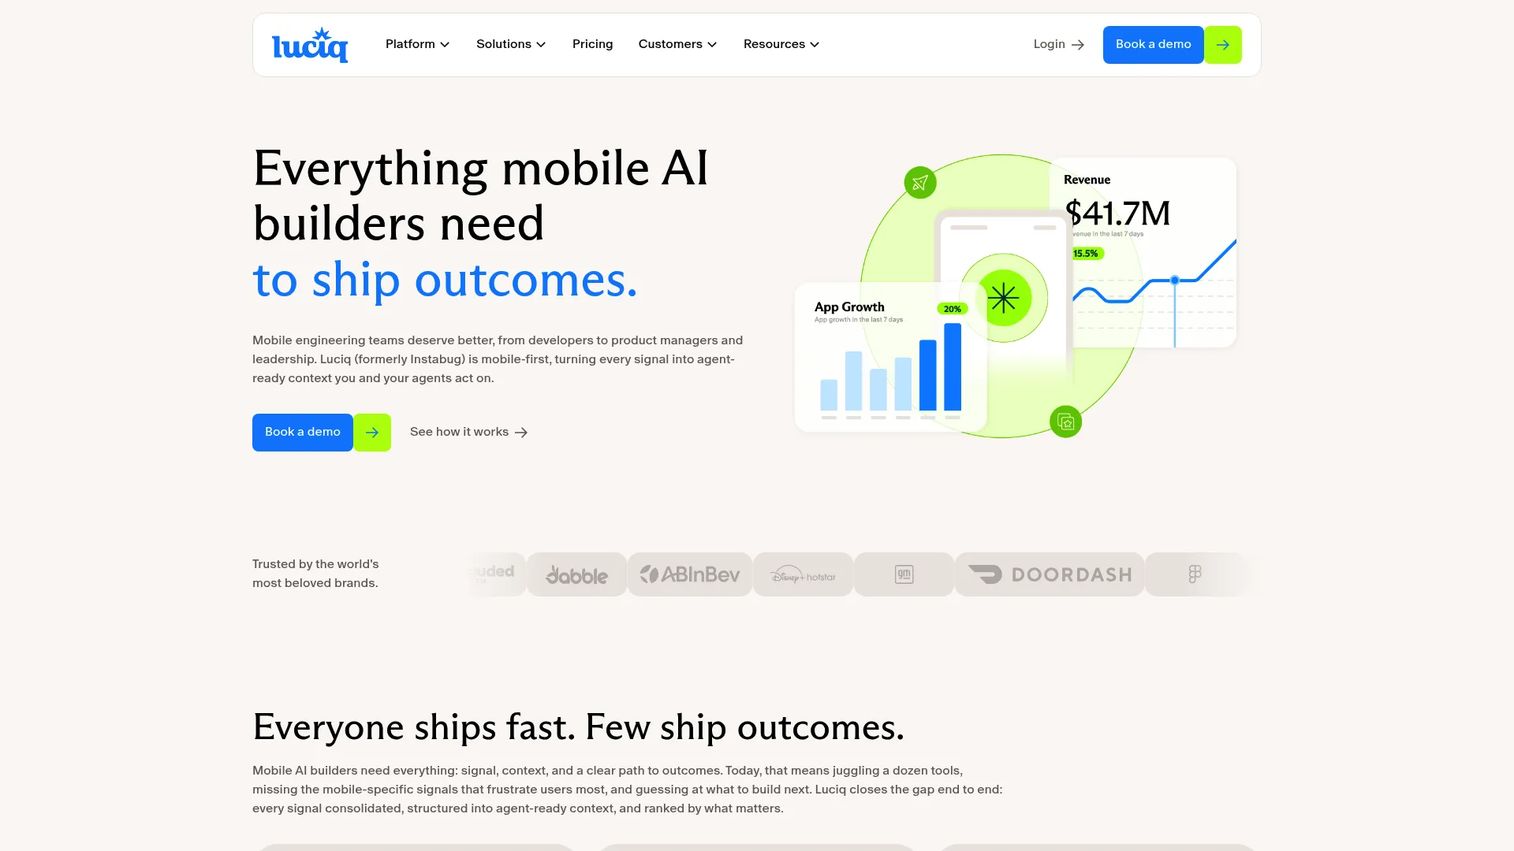
Luciq combines mobile observability with qualitative user signals in one platform. Alongside crash and ANR detection, it captures funnel drop-off events, rage-tap analysis, store reviews, and in-app feedback. Its AI-assisted root cause analysis generates reproduction steps automatically, and automated pull request workflows and guarded releases connect crash data directly to the engineering delivery pipeline. SDK support covers iOS, Android, React Native, and Flutter.
Best for: Product teams where understanding why a user was frustrated matters as much as knowing what technically failed - especially teams handling high-volume consumer mobile apps.
Key features
- Crash, ANR, and visual bug detection with AI-assisted root cause analysis
- Funnel drop-off and rage-tap analysis
- Store review and in-app feedback analysis
- Automated pull requests and guarded release workflows
- SDK support for iOS, Android, React Native, and Flutter
Why choose Luciq: Useful when a PM needs to connect the technical failure record to the customer's stated experience. A support ticket that says "payment didn't work" gains a lot more meaning when paired with a crash trace, a rage-tap sequence, and a three-star review mentioning the same checkout flow.
Luciq pricing: Luciq prices by daily active users and member seats on a single transparent plan, with a Premier support option for mission-critical teams. No numeric prices are displayed on the pricing page. Contact Luciq directly to get a quote for your team's scale.
G2 rating: 4.3/5 (verified October 2026).
8. Raygun
Raygun combines error and crash reporting with Real User Monitoring and Application Performance Monitoring in a single platform. Its crash diagnostics include affected-user context, stack traces, and release trend analysis. RUM layers in frontend performance data, so teams can see whether a crash spike coincides with a slowdown in page render or API response time. Integrations with GitHub, Jira, Slack, and Asana connect error data to existing engineering workflows.
Best for: Development teams that want crash intelligence and frontend performance monitoring in one tool, without managing separate vendors for each discipline.
Key features
- Crash reporting with detailed diagnostics and affected-user context
- Real User Monitoring for frontend performance and user sessions
- Application Performance Monitoring for server-side bottlenecks
- Deployment tracking and release trend analysis
- Integrations with GitHub, Jira, Slack, and Asana
Why choose Raygun: A practical option when the organization wants crash data and user-experience monitoring to live together. It can help teams connect reliability work to the workflows users are actually struggling to complete, especially on web and hybrid apps.
Raygun pricing: The Basic plan starts at $40/month on an annual commitment ($60/month billed monthly). The Team plan starts at $80/month annually ($120/month billed monthly). Enterprise pricing is custom. A 14-day free trial is available. No permanent free tier was confirmed.
G2 rating: 4.3/5 (verified October 2026).
Considerations when choosing mobile crash reporting software
Measure release health, not only issue volume
Track crash-free sessions, crash-free users, affected-user counts, and release adoption together. A single high-volume crash on a critical workflow is more urgent than dozens of low-impact edge-case exceptions. The metric that should drive rollout decisions is crash-free sessions by version, not total crash count.
Check SDK coverage before standardizing
Confirm native and cross-platform support for your current and planned stack: Android, iOS, Flutter, React Native, Unity, and any embedded web views. Ask who owns SDK upgrades during each release cycle and whether that responsibility sits with platform, mobile, or a shared engineering function.
Evaluate context quality alongside feature lists
Look beyond stack traces. Compare breadcrumb depth, device and OS metadata, session replay fidelity, symbolication workflows, and log correlation. The tools in this guide differ significantly in how much diagnostic context they attach to each issue. More context reduces reproduction time; it shouldn't add instrumentation overhead your team can't maintain across release cadences. For teams also thinking about how session replay software fits the stack, replay capabilities in crash reporting tools vary from basic to production-grade.
Model cost at production scale, not just current usage
Usage-based pricing models scale with sessions, errors, spans, or data ingest depending on the platform. Estimate cost at your current volume and at your next meaningful milestone. Include a spike scenario - a popular feature launch or a viral app moment can generate 10x normal session volume in a short window.
Connect alerting to an operating process
An alert that fires with no owner and no defined response is noise. Before you instrument, define what a new crash alert triggers: A release rollback, a hotfix conversation, an incident review, or a support communication. The tool is only as useful as the process it feeds into.
Conclusion
The eight tools here cover meaningfully different positions. Firebase Crashlytics is the practical starting point when the team already runs Firebase and budget is constrained. Sentry fits teams that need mobile errors connected to backend workflows and release ownership in one place. BugSnag is strong for product-facing release health and stability management. Datadog and New Relic suit organizations already consolidating observability data across infrastructure and services. Embrace handles the hardest mobile experience issues, where session-level context and ANR tracing matter more than surface-level crash counts. Luciq adds qualitative user signals to the crash record for consumer-facing teams. Raygun combines crash intelligence with frontend performance monitoring for teams that want both without a second vendor.
Pick two platforms that match your current stack. Instrument a staging build. Then test the answer to one concrete question: When a user reports "the app crashed," can your team identify the affected release, reproduce the failure path, and decide on a fix priority within one working day?
Start your journey with Guideflow today!
FAQs
Crash reporting focuses on fatal crashes, nonfatal errors, ANRs, and the diagnostic context around each failure. Mobile observability adds broader signals: Startup latency, rendering performance, network behavior, distributed tracing, and full session timelines. Teams can start with crash reporting and expand to observability when failures start crossing multiple systems and a single stack trace doesn't answer the question.
Prioritize crash-free sessions by release, affected-user counts by workflow, issue recurrence rate, and device or OS concentration. Where possible, connect those signals to activation completion rates, checkout conversion, and support ticket volume. The goal is a stability picture that can inform a roadmap prioritization conversation, not just an engineering bug queue.
Most mobile-focused tools in this category detect Android ANRs or app hangs, but coverage and depth vary. Confirm whether the tool captures ANR traces, user context at the time of the hang, release-level segmentation, and alerting for ANR spikes before selecting it. Firebase Crashlytics, Sentry, BugSnag, and Embrace all include ANR detection.
For many teams, yes. It provides crash reporting, nonfatal error capture, ANR detection, release stability tracking, and crash-free metrics at no cost. Teams typically look beyond Crashlytics when they need deeper session replay, mobile performance tracing, cross-stack incident correlation, or ownership routing that connects crashes to specific code changes.
A crash-free session is a user session that completes without a fatal crash. The metric is calculated as the proportion of sessions that don't contain a crash, which makes it a stable comparison across releases regardless of traffic volume. Segment it by release version, device model, and OS version to see exactly where a regression appeared and how far it spread.
The answer depends on your existing stack and the type of diagnostic context you need. Firebase Crashlytics is the strongest no-cost option for teams already on Firebase. Sentry covers both platforms with strong cross-stack context. Embrace offers the deepest session-level mobile observability for complex field issues. Confirm ANR coverage, symbolication workflow, and pricing at your expected session volume before deciding.
They attach device metadata, app version, logs, breadcrumbs, and user actions to each failure before a ticket is filed. Support and engineering share a common record, which cuts the back-and-forth that typically starts with "what device were you on?" Teams still need a defined workflow for linking tickets to crash issues and communicating fixes back to affected users, but the diagnostic starting point is materially stronger.
Trigger a controlled crash, a nonfatal error, and an Android ANR if your app targets Android. Verify that symbolication works correctly, that issue grouping clusters related failures rather than creating duplicates, that release segmentation shows version-level data, and that alert delivery reaches the right channels. Confirm that a PM can understand the affected-user impact from the dashboard without needing an engineering translation for each incident.