Your on-call engineer gets paged at 2 a.m. The dashboard shows latency climbing. Somewhere in 400 GB of daily logs, the answer exists. Finding it before customers notice is the whole game.
Log volume is growing faster than most teams can manage. The log management market reached $2.85 billion in 2025 and is projected to hit $3.36 billion by 2026, according to The Business Research Company (2026). Meanwhile, 87% of surveyed organizations rely on logs as a primary observability signal, per Grafana Labs (2025). Yet only 15.8% of those organizations have reached a mature observability practice, according to ManageEngine (2025).
The gap between "we collect logs" and "we find root cause in minutes" is where the right log monitoring platform earns its place. The wrong one buries you in noise, crushes your budget at high ingest volumes, or fails your security team's review before the trial ends.
This guide cuts through the field and gives you a shortlist worth evaluating.
What's inside
This guide covers 12 log monitoring tools for 2026, selected based on verified features, pricing, and G2 ratings. It is written for DevOps engineers, SREs, platform teams, security practitioners, IT operations, and presales engineers who need to validate technical fit quickly.
Tools were chosen based on:
- Depth of log search, alerting, and real-time monitoring capabilities
- Cloud-native and Kubernetes readiness, including OpenTelemetry support
- Retention economics, archiving controls, and cost transparency
- Enterprise fit: RBAC, audit trails, SSO, and governance controls
TL;DR
- Best overall for full-stack observability: Datadog Log Management correlates logs with metrics, traces, and security signals in one platform
- Best for enterprise search and security analytics: Splunk handles large-scale machine data with mature SPL search and SIEM-adjacent workflows
- Best for Elastic stack teams: Elastic Observability delivers powerful search across logs, metrics, traces, and APM
- Best for cloud-native and Grafana-heavy teams: Grafana Loki pairs label-based indexing with Grafana dashboards for cost-efficient Kubernetes logging
- Best for cost-conscious high-volume logging: OpenObserve uses object storage and columnar formats to keep retention costs low
- Best for IT operations teams: SolarWinds Log Analyzer ties real-time log analysis directly to infrastructure monitoring
What is log monitoring software?
Log monitoring software collects, centralizes, searches, analyzes, and alerts on machine-generated logs from applications, servers, networks, containers, cloud services, and security systems.
Logs are time-stamped event records. Every API call, failed login, database query, container restart, and system crash produces them. Without a centralized platform, those records live in scattered files across hundreds of hosts, making incident response a manual archaeology project.
Modern log monitoring platforms go beyond storage. They parse raw log lines into structured fields, enrich records with metadata like Kubernetes pod names or cloud region tags, index the results for fast search, and fire alerts when specific patterns appear. The best ones connect logs to the other pillars of observability: Metrics and traces.
Core capabilities of log monitoring software
- Centralized collection and aggregation: Ingests logs from agents, APIs, syslog, SNMP traps, and cloud services
- Parsing and normalization: Converts raw log text into structured, queryable fields
- Real-time search and filtering: Lets engineers query logs by field, time range, host, or custom pattern
- Dashboards and visualizations: Surfaces trends, error rates, and service health at a glance
- Log alerting and anomaly detection: Triggers notifications when patterns match defined thresholds
- Retention, archiving, and rehydration: Controls how long logs stay indexed, when they move to cold storage, and how to bring them back
- RBAC and audit controls: Restricts access by role, logs who ran which queries, and enforces data governance
- Integrations: Connects to metrics platforms, tracing tools, SIEM systems, and incident management
Log monitoring versus log management
Log monitoring describes active detection: Watching logs in real time, triggering alerts, and helping engineers investigate fast. Log management is broader. It covers the full lifecycle, including collection, storage, routing, retention policies, archiving, and governance.
In modern platforms, these two concerns overlap significantly. Most tools in this guide handle both. A platform like Datadog, for example, processes logs through pipelines, indexes them for search, and routes some to long-term archive while keeping others hot for real-time alerting.
Log monitoring versus SIEM
SIEM (Security Information and Event Management) tools focus on security event correlation, threat detection, compliance investigations, and incident response workflows. Log monitoring platforms focus on operational troubleshooting and observability.
Many teams feed their log platform into a SIEM. Some platforms, including Splunk and Graylog, support both operational and security use cases in a single product. When evaluating, ask which team owns the tool, what detection logic it needs to run, and how retention and access controls differ between ops and security requirements.
When to use log monitoring software
Troubleshoot production incidents faster
When an API starts returning 500 errors or a payment flow breaks, the path from symptom to cause runs through logs. A central log search lets your on-call engineer filter by service, time window, and error code without SSH-ing into individual hosts. Presales teams encounter this question often during technical validation: Prospects want to know how fast their team can diagnose a customer-facing failure using your observability stack.
Monitor cloud-native and Kubernetes workloads
Container logs are ephemeral. Pods spin up and down. A legacy server-centric logging approach loses those records the moment a container restarts. Kubernetes-native application performance monitoring tools and log platforms attach pod metadata, namespace, and deployment labels to every log line, so you can query across a rolling fleet without losing context. OpenTelemetry support matters here: It standardizes how telemetry flows from services through collectors to your log platform.
Prove governance, retention, and audit readiness
Regulated environments need more than fast search. Security teams want RBAC, data residency controls, retention windows that match compliance requirements, and a clear audit trail showing who accessed what. Before a POC reaches the security review gate, confirm which tier includes SSO, field-level masking, and exportable audit logs. Teams that skip this step often see deals stall during procurement. Consult your security and compliance teams to validate specific requirements.
Log monitoring software comparison
The table below lists all 12 tools in this guide. Pricing figures and G2 ratings reflect data verified from each vendor's pricing page and live G2 listing. Ingest-based tools show the base ingest rate; host-based tools show the entry host price.
| # | Product | Best for | Key differentiator | Pricing | G2 rating |
|---|---|---|---|---|---|
| 1 | Datadog Log Management | Full-stack observability teams | Logs correlated with metrics, traces, and security signals | From $0.10/GB ingested | 4.4/5 |
| 2 | Splunk | Enterprise search and security analytics | Mature SPL search, scale, and SIEM-adjacent workflows | From $15/host/month (Observability Cloud) | 4.4/5 |
| 3 | Elastic Observability | Elastic stack and search-heavy teams | Elasticsearch-powered search across logs, metrics, and traces | From $0.07/GB ingested (serverless) | 4.3/5 |
| 4 | New Relic | Engineering teams standardizing observability | Usage-based telemetry platform with logs in context | Free tier; paid from $10/month | 4.4/5 |
| 5 | Dynatrace | Enterprise AIOps and root-cause analysis | Davis AI across hybrid environments with Grail data lakehouse | From $7/host/month | 4.5/5 |
| 6 | Grafana Loki | Grafana-native cloud-native logging | Label-based indexing paired with Grafana dashboards | Free tier; cloud from $19/month | N/A (listed as Grafana Labs) |
| 7 | OpenObserve | Cost-conscious high-volume logging | Object storage and columnar format for lower retention costs | From $0.30/GB (cloud) | 5.0/5 |
| 8 | OpenSearch | Teams wanting open-source search control | Search, dashboards, alerting, and observability under Apache 2.0 | Free (open source) | 4.4/5 |
| 9 | Graylog | Security and IT operations log management | Centralized log management with parsing and pipeline controls | Free (Open); from $15,000/year (Enterprise) | 4.4/5 |
| 10 | Sumo Logic | Cloud-scale analytics and compliance | SaaS log analytics with security and observability workflows | Free tier; paid via credit-based model | 4.3/5 |
| 11 | Logz.io | Managed open-source observability | AI-assisted observability with consumption-based pricing | From $0.92/GB/day (log management) | 4.5/5 |
| 12 | SolarWinds Log Analyzer | IT operations and server monitoring | Real-time log analysis tied to infrastructure monitoring | From $8/node/month | 4.5/5 |
Best 12 log monitoring software for 2026
1. Datadog Log Management
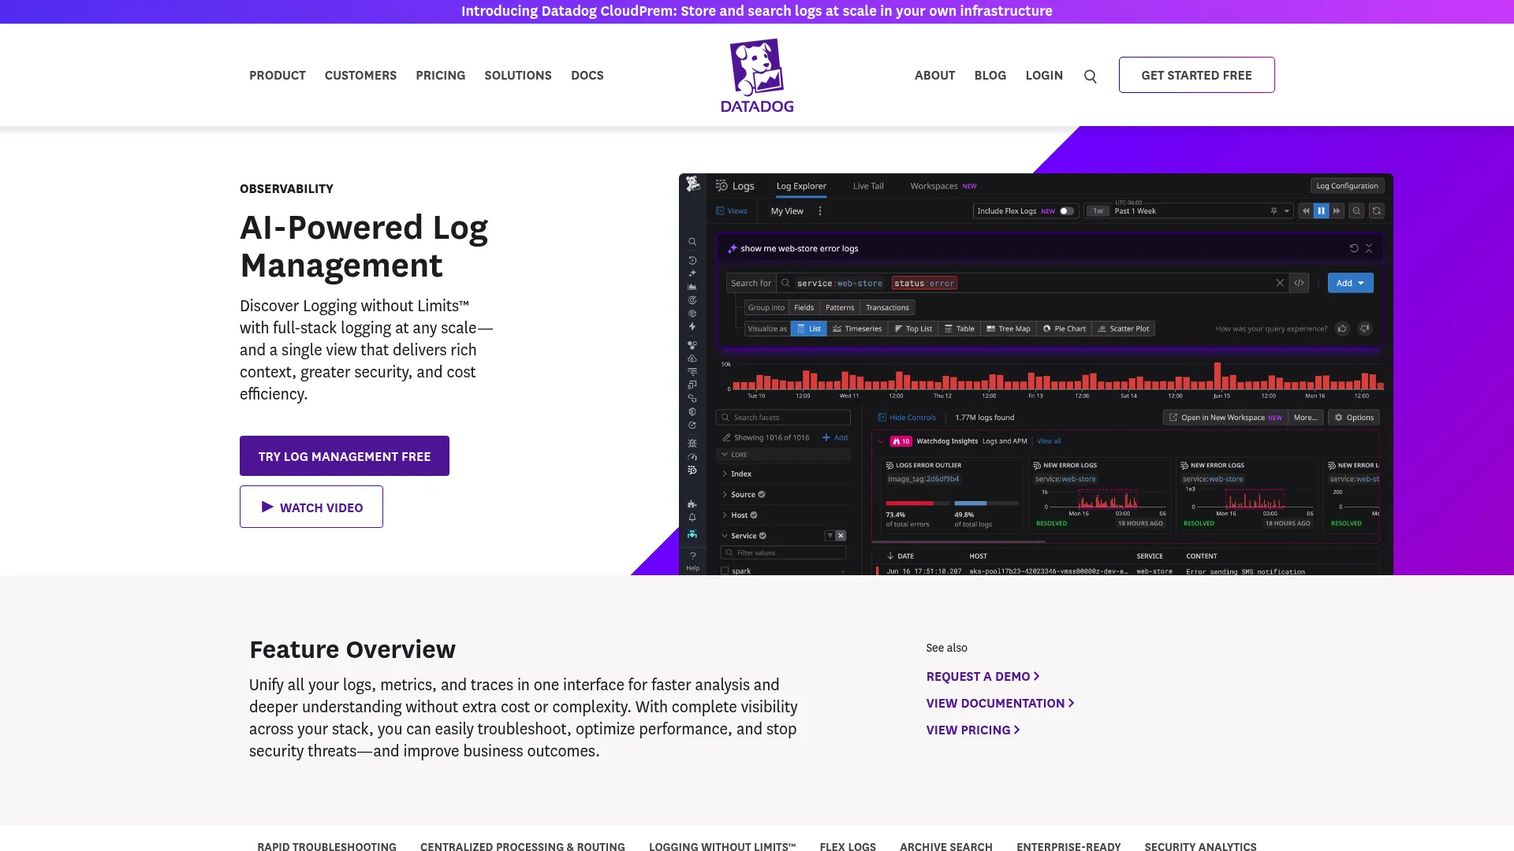
Datadog Log Management is the log analytics layer inside Datadog's unified observability platform. It collects, processes, indexes, and archives logs while connecting them to the same platform handling infrastructure metrics, distributed traces, APM, and security signals. Teams that already run Datadog for monitoring get log search without switching contexts during an incident.
Best for: Engineering and platform teams that want log monitoring inside a broader observability platform, and want correlated telemetry during incident response.
Key features
- Log Explorer with live search, filtering, and visualization
- Logging without Limits: Ingestion decoupled from indexing
- Flex Logs for long-term retention with separate storage and compute
- Log pipelines and processors for parsing and enrichment
- Log-based metrics and Watchdog Insights for anomaly detection
Why choose Datadog Log Management: The correlated telemetry model cuts investigation time significantly. When a trace shows a spike, the linked log view is one click away. Keep one planning conversation in mind: At high ingest volumes, the separation of ingestion, indexing, and Flex Logs tiers requires modeling before you commit. Run a 30-day ingest estimate before the trial ends.
Datadog Log Management pricing: Ingestion runs $0.10 per GB per month. Indexed log events start at $1.06 per million logs at 3-day retention, billed annually. Flex Logs storage costs $0.05 per million events stored per month; the Flex Logs Starter tier runs $0.60 per million events at 6 to 15 months retention. A 14-day product trial is available.
G2 rating: 4.4/5
2. Splunk
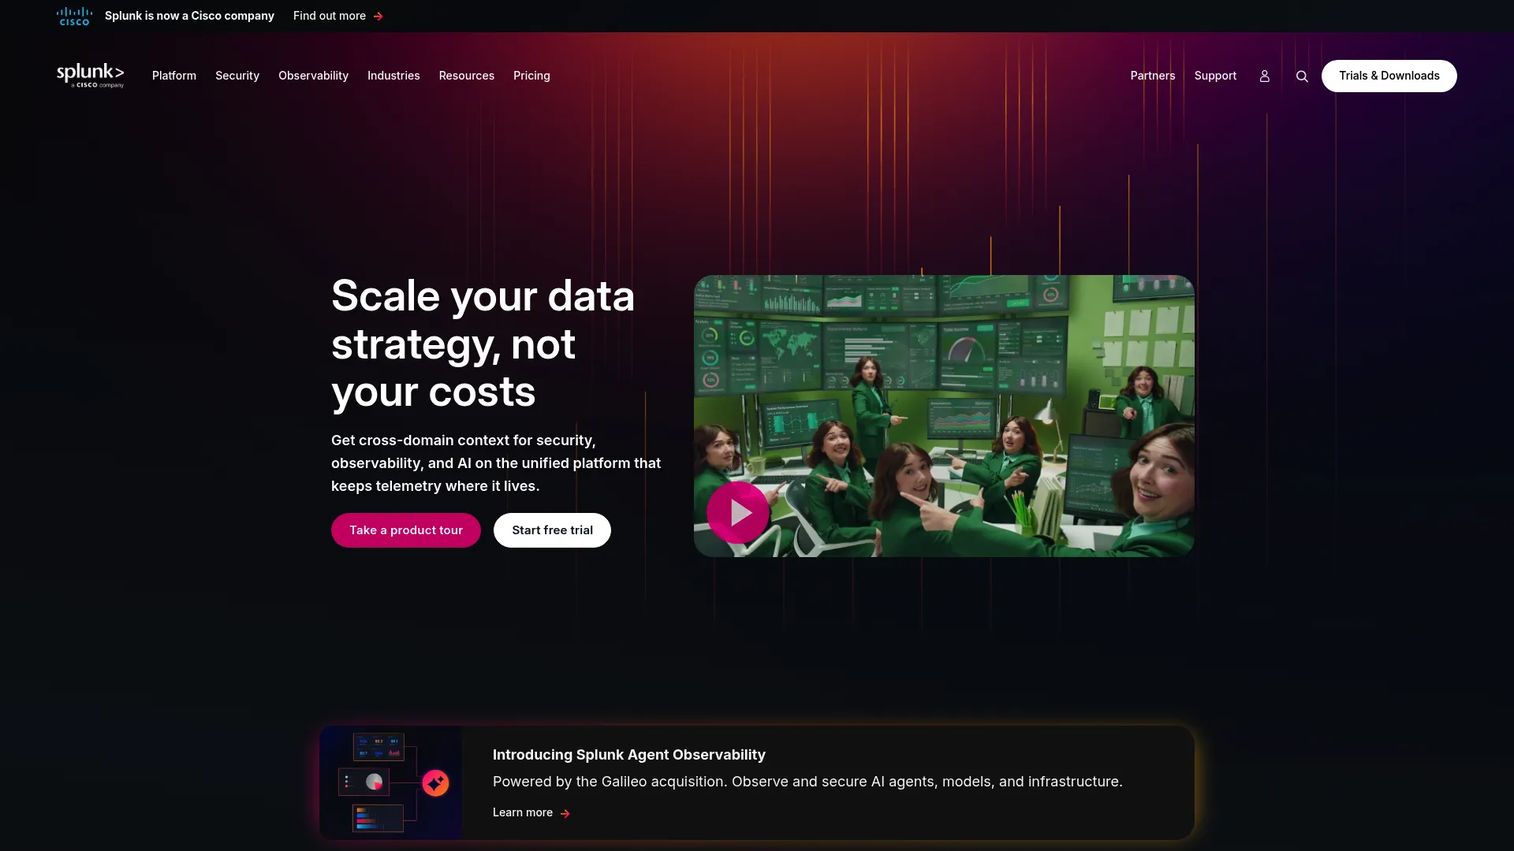
Splunk is the established standard for enterprise log search and machine data analytics. Its Search Processing Language (SPL) is expressive enough to handle complex security investigations, compliance queries, and operational troubleshooting across massive data volumes. Splunk Enterprise and Splunk Cloud both support security-focused workflows and integrate with the broader Cisco security portfolio.
Best for: Enterprises with demanding log search, security operations, and governance requirements, particularly teams that need SIEM-adjacent capabilities alongside operational monitoring.
Key features
- SPL search language for complex queries at enterprise scale
- Enterprise-scale indexing with deployment flexibility (cloud or self-managed)
- Security analytics workflows supporting SIEM, SOAR, and threat detection
- Dashboards, real-time alerts, and federated search across data lakes
- Prebuilt apps and integrations for infrastructure logs and network logs
Why choose Splunk: Depth and maturity are the arguments here. Security teams with existing SPL knowledge get a familiar environment. The trade-off worth modeling: Data volume and retention drive significant cost, so infrastructure logs from a large fleet should be estimated carefully before procurement. A trial is available for Splunk Cloud.
Splunk pricing: Splunk Observability Cloud starts at $15 per host per month for infrastructure monitoring, billed annually. The App and Infrastructure tier runs $60 per host per month; End-to-End is $75 per host per month. Splunk Platform, Enterprise Security, and SOAR pricing requires a quote from Splunk's sales team.
G2 rating: 4.4/5
3. Elastic Observability
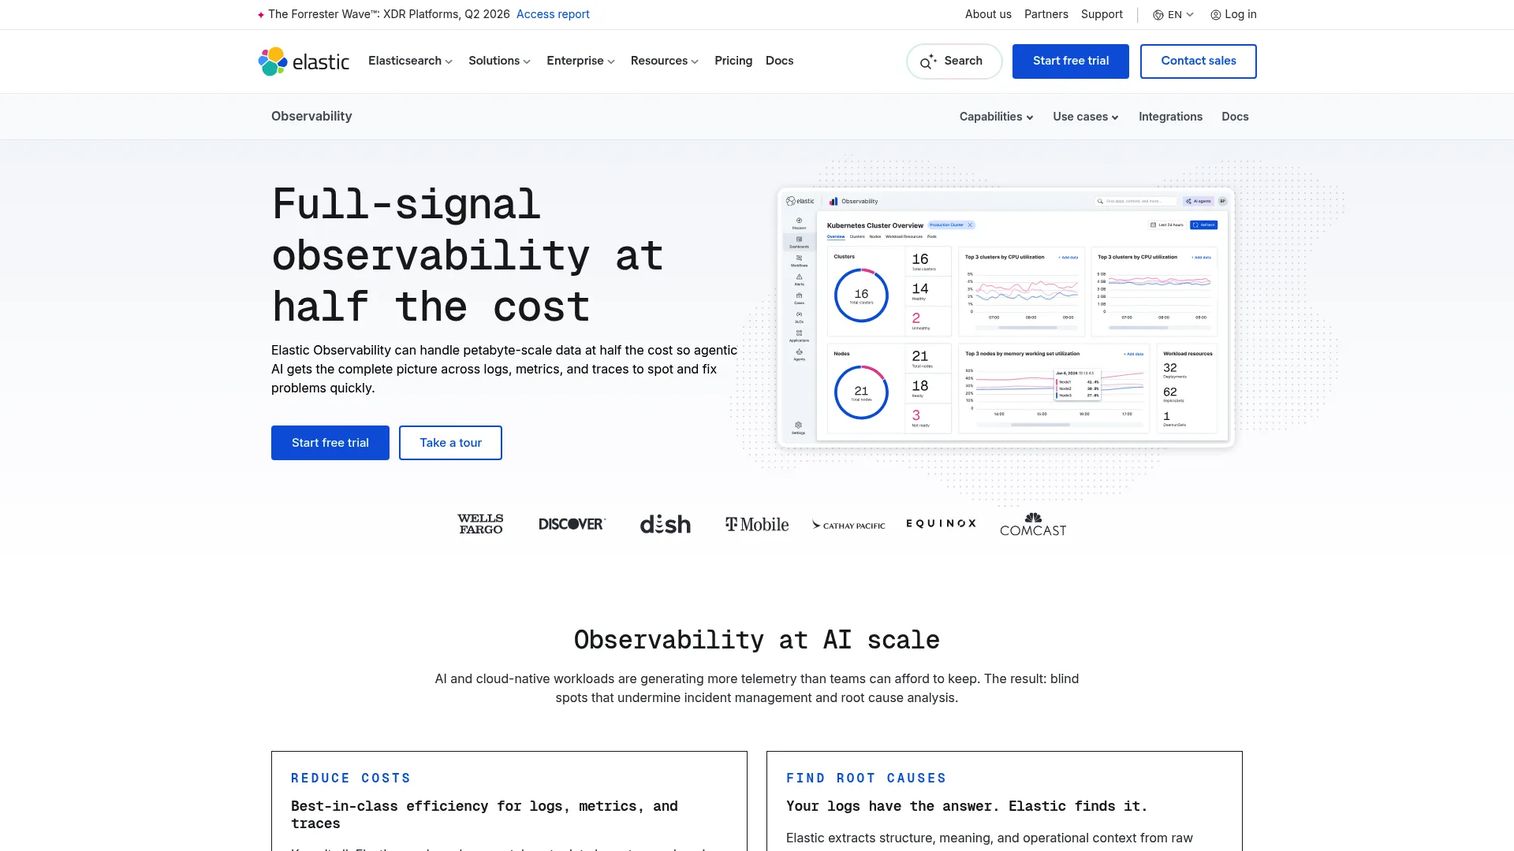
Elastic Observability brings logs, metrics, traces, and application performance monitoring together in a single platform built on Elasticsearch. Teams familiar with the Elastic stack, including Kibana and Elastic Agent, get observability logs alongside the search infrastructure they already operate. The platform supports OpenTelemetry natively, making it straightforward to integrate with modern telemetry pipelines.
Best for: Teams that already run Elasticsearch or Kibana and want search-driven observability across logs, APM, and distributed traces.
Key features
- Elasticsearch-powered log search with full-text and structured query support
- Kibana dashboards, saved searches, and alerting rules
- APM, distributed tracing, and service maps
- Elastic Agent for centralized data collection and management
- AI-assisted investigations and anomaly detection via machine learning
Why choose Elastic Observability: Search flexibility is the headline. Elasticsearch handles log volumes and query patterns that more opinionated platforms struggle with. Teams should evaluate operational overhead carefully when self-managing clusters. For teams considering Elastic-based log aggregation alongside other observability categories, also review API monitoring tools for adjacent coverage.
Elastic Observability pricing: Serverless Logs Essentials starts at $0.07 per GB ingested; the Complete tier starts at $0.09 per GB ingested, both consumption-based. Egress includes 50 GB free per month, then $0.05 per GB. A free trial is available on Elastic Cloud.
G2 rating: 4.3/5
4. New Relic
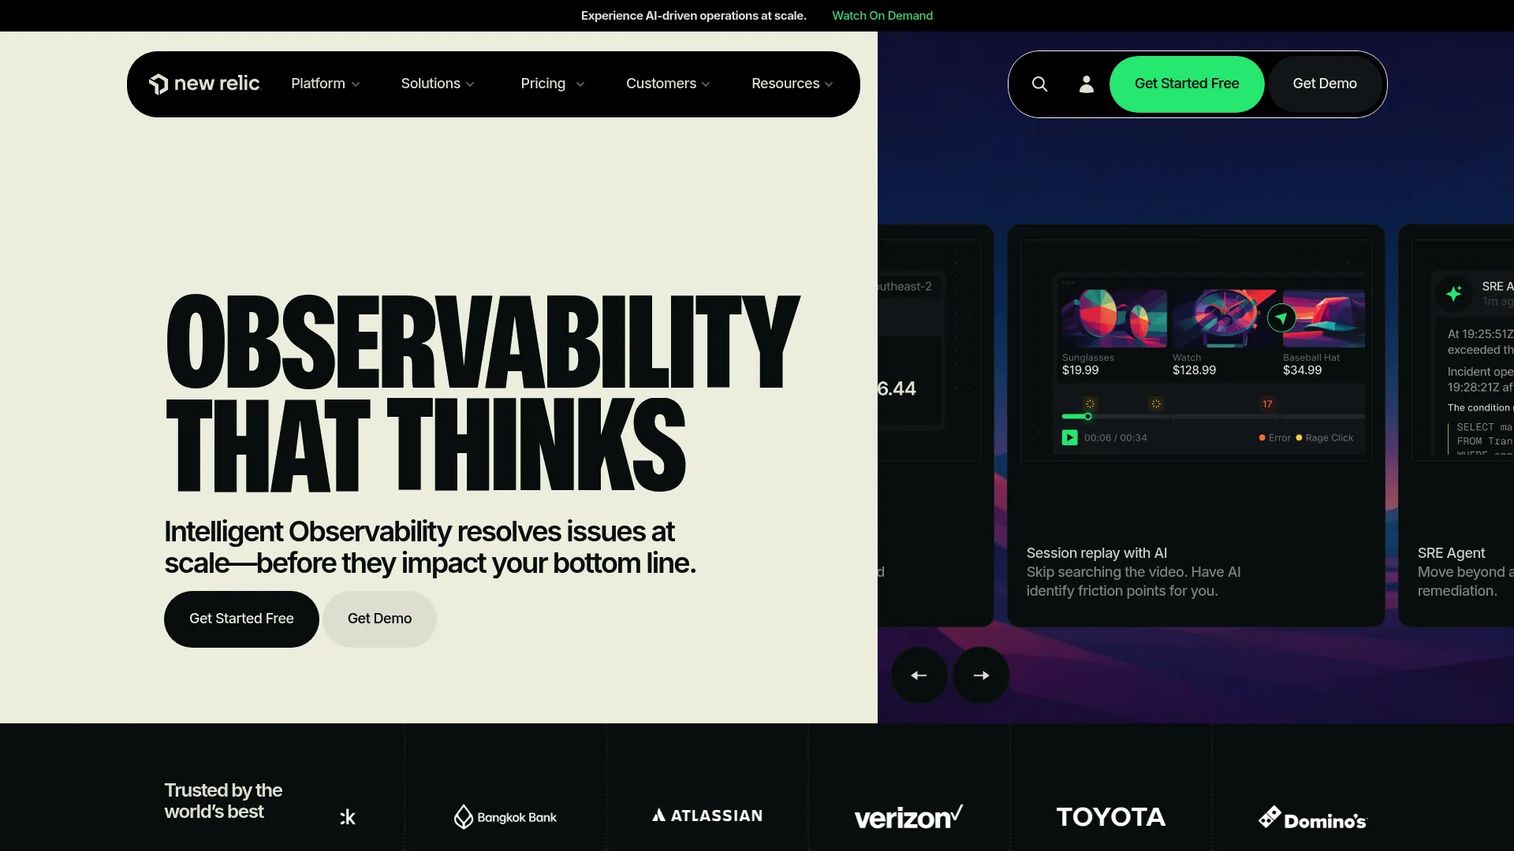
New Relic is a full-stack observability platform that connects log data to application performance, infrastructure health, browser monitoring, and user experience in a unified view. Its usage-based telemetry model means teams pay for what they ingest, with a generous free tier covering 100 GB of data per month and one full platform user at no cost.
Best for: Product engineering teams that want application log monitoring alongside APM and service health without managing separate tools.
Key features
- Logs in context: Linked directly to traces and APM transactions
- NRQL query language for cross-telemetry analysis
- Applied Intelligence for alert noise reduction and incident correlation
- Telemetry data platform supporting OpenTelemetry logging and custom metrics
- Alerting, dashboards, and service level management
Why choose New Relic: The free tier makes it accessible for teams that want to evaluate before committing. NRQL makes it easier to query logs and metrics in the same query, which shortens investigation time during incidents. Teams whose primary need is a standalone log archive rather than correlated telemetry should compare retention economics before scaling ingest.
New Relic pricing: Free tier includes 100 GB of data ingest per month and one full platform user, permanently. Standard plans start at $10 per month for the first full platform user, then $99 per month for additional users (maximum five). Pro runs $349 per user per month on an annual commitment. Data beyond the free 100 GB is $0.40 per GB.
G2 rating: 4.4/5
5. Dynatrace
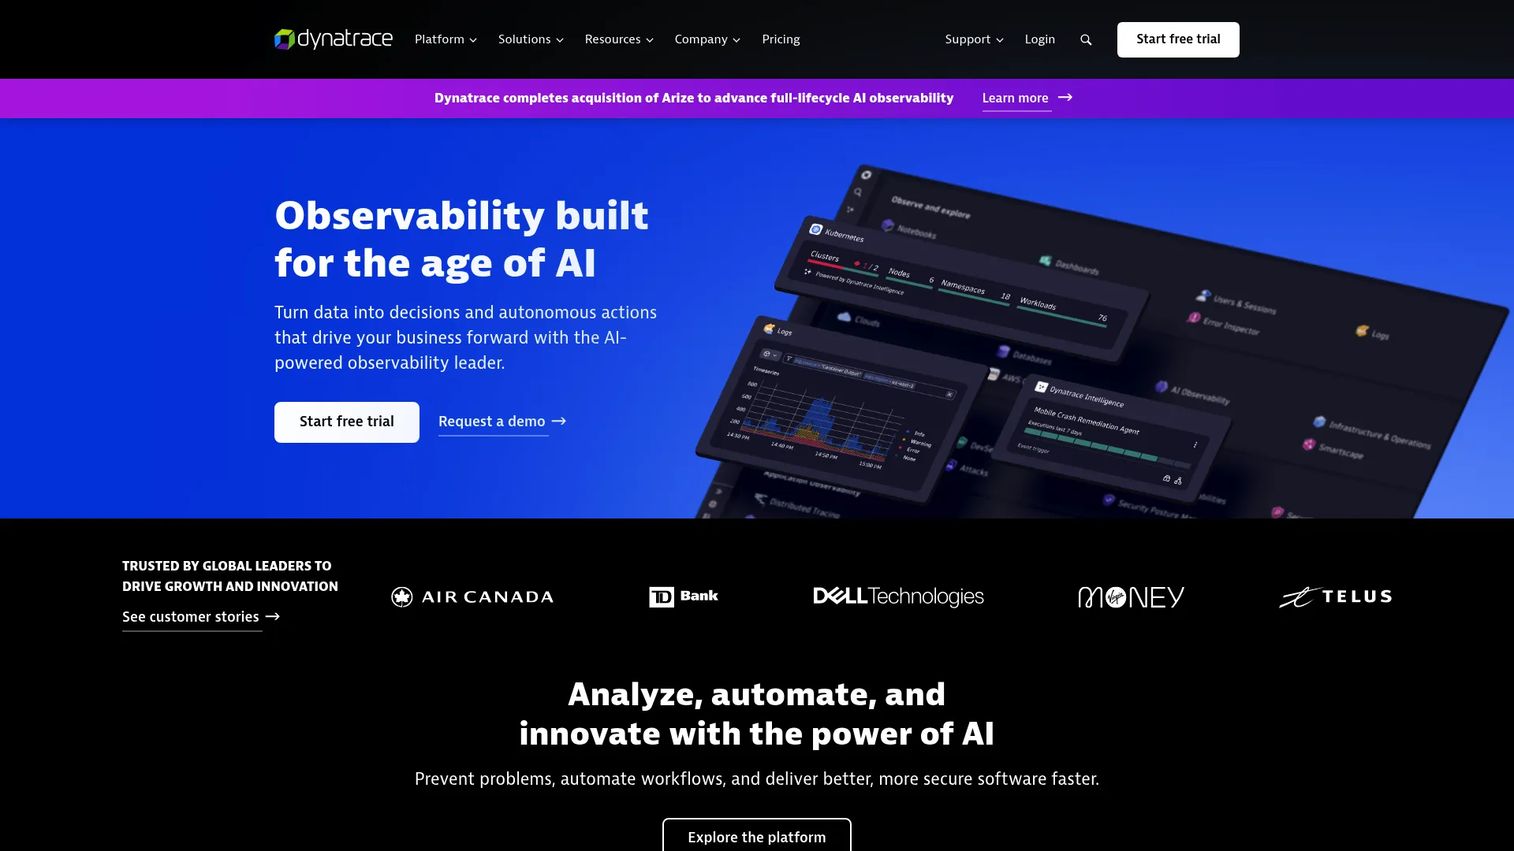
Dynatrace is an agentic AI observability platform that combines log analytics, infrastructure monitoring, application performance monitoring, and automated root-cause analysis in one environment. Its Davis AI engine surfaces causal relationships across logs, metrics, and traces, reducing the manual investigation work that slows incident response in complex hybrid and Kubernetes environments.
Best for: Large organizations that want automated problem detection and root-cause guidance across cloud and on-premises infrastructure, without relying on manual dashboard review.
Key features
- Davis AI for automated root-cause analysis and predictive alerts
- Grail data lakehouse for log analytics with DQL query language
- Full-stack Kubernetes observability with container, pod, and service context
- Service topology mapping for dependency-aware incident investigation
- Unified observability across cloud, hybrid, and on-premises environments
Why choose Dynatrace: If your team spends significant time correlating alerts manually across multiple tools, Davis AI addresses that directly. Buyers should validate pricing against expected telemetry volume: Dynatrace uses a platform subscription model where capabilities draw from a shared commitment at rate-card pricing. A 15-day free trial is available.
Dynatrace pricing: Foundation and Discovery starts at $7 per host per month. Infrastructure Monitoring runs $29 per host per month. Full-Stack Monitoring costs $58 per 8 GiB host, consumption-based. Pricing is billed annually through a Platform Subscription model.
G2 rating: 4.5/5
6. Grafana Loki
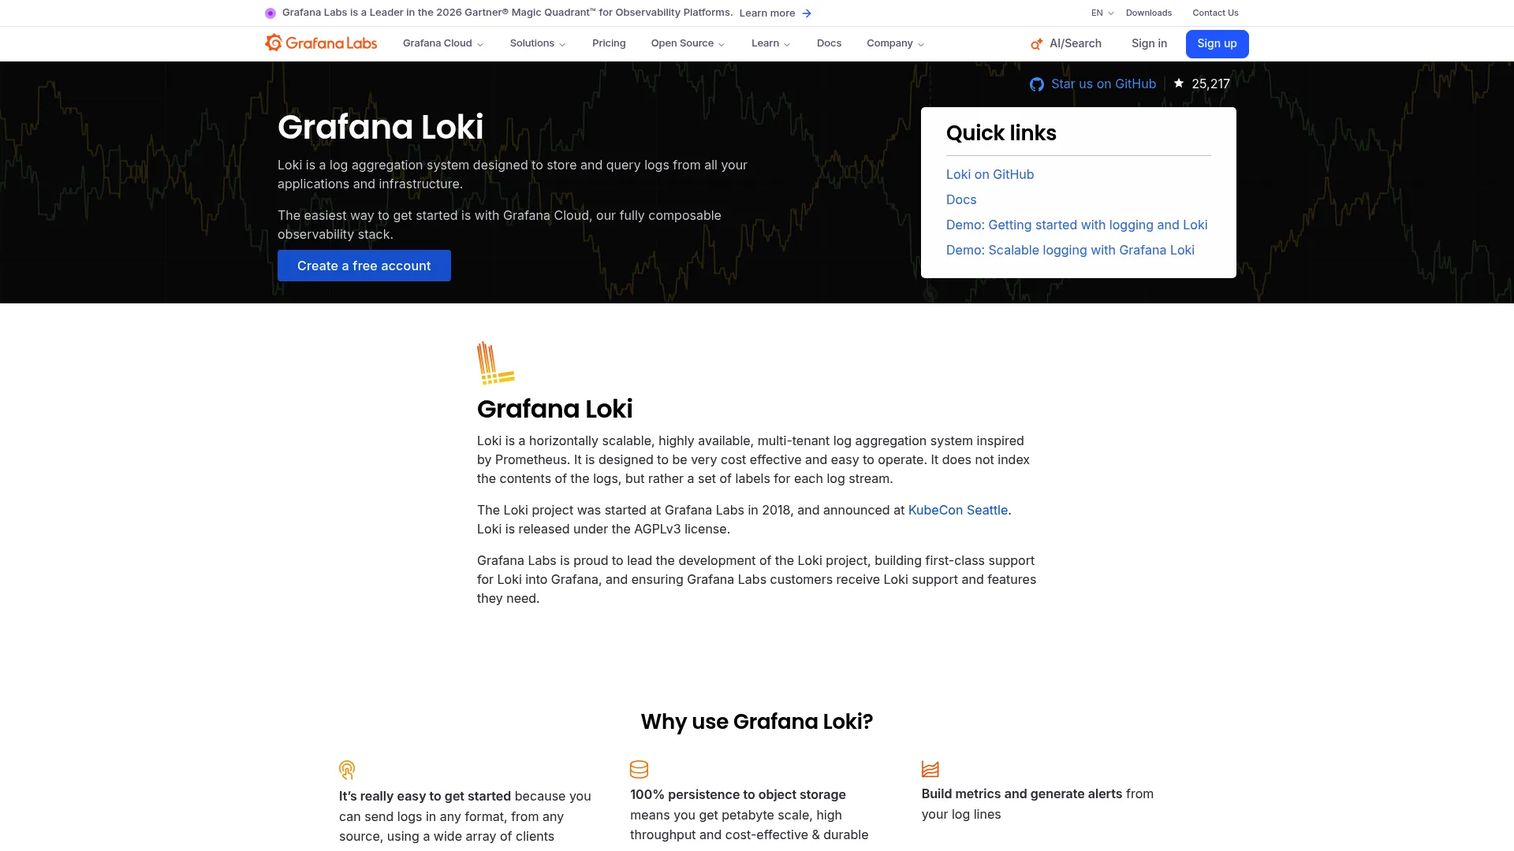
Grafana Loki is an open-source, horizontally scalable log aggregation system designed to work alongside Grafana, Prometheus, and Tempo. Instead of indexing full log content, Loki indexes only metadata labels, storing compressed log chunks in object storage. This approach keeps infrastructure costs lower than full-text indexing platforms at high volume, making it a strong fit for Kubernetes logging where pod metadata is the primary query dimension.
Best for: Kubernetes and cloud-native teams that already use Grafana dashboards and want cost-aware log aggregation without running a separate search cluster.
Key features
- Label-based indexing with log chunks stored in object storage
- LogQL for log filtering, parsing, and log-derived metrics
- Multi-tenant architecture for team or environment isolation
- Built-in alerting via the Loki ruler
- Native Grafana integration for unified dashboards and annotations
Why choose Grafana Loki: The tight Grafana fit is the main argument. If your team already queries metrics in Grafana, adding Loki means one interface for logs and metrics together. Teams that need broad full-text search across unstructured log content should evaluate LogQL query patterns against their actual log formats before committing.
Grafana Loki pricing: The open-source project is free to self-manage. Grafana Cloud Logs, powered by Loki, includes a free tier with 50 GB ingested per month and 14-day retention. The Pro plan starts at $19 per month plus usage. Enterprise starts at a $25,000 annual spend commitment.
7. OpenObserve
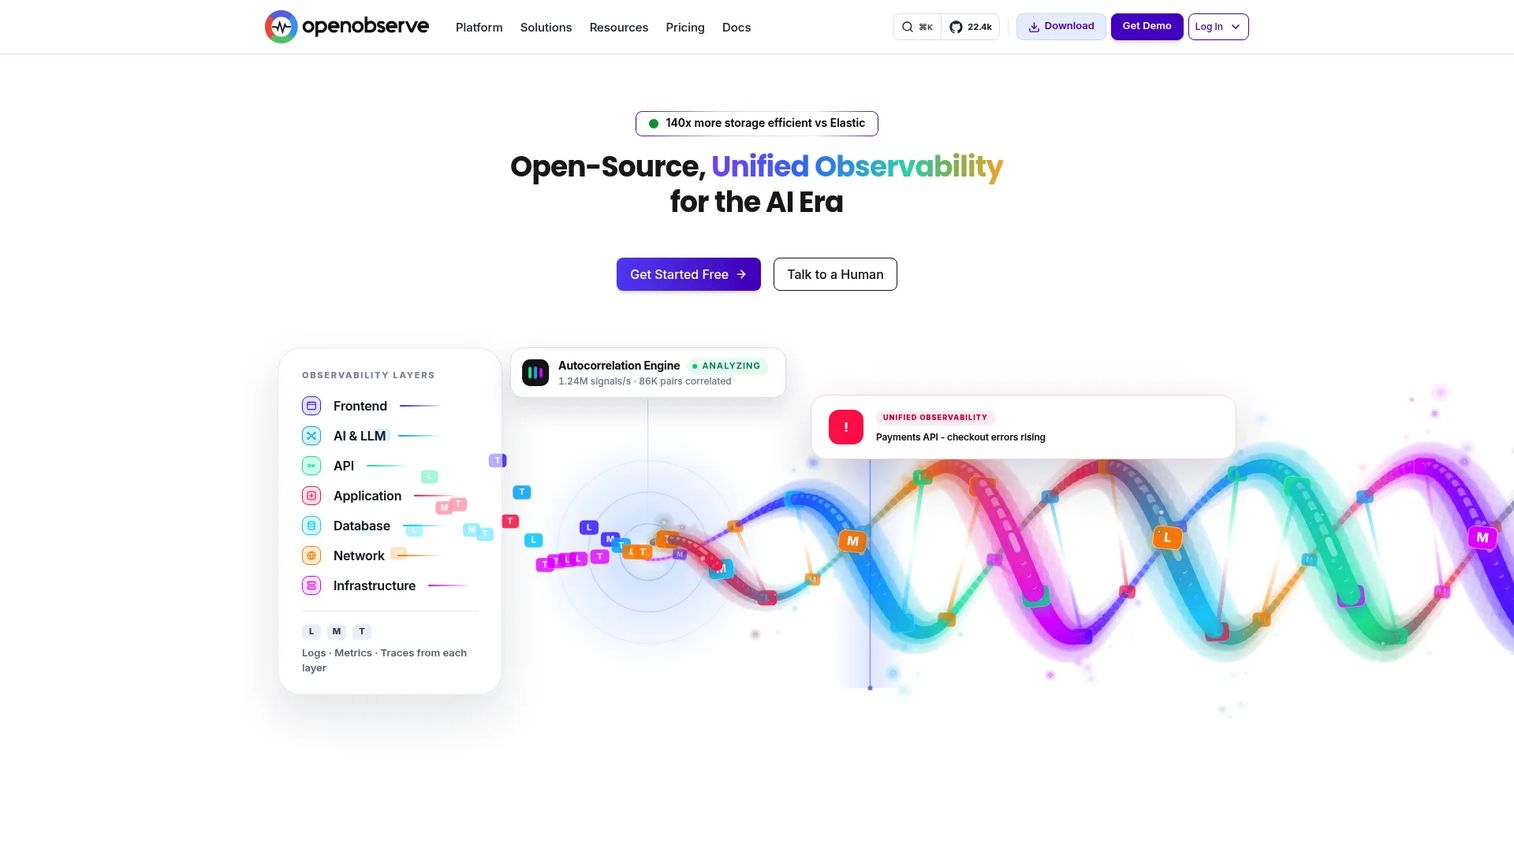
OpenObserve is an open-source cloud-native observability platform that handles logs, metrics, and traces using object storage and a columnar data format. SQL-based log querying, OpenTelemetry support, and a low per-GB cloud price make it competitive for teams dealing with high log volumes where retention costs on traditional indexing platforms would run high.
Best for: Engineering teams with high daily log volume and firm cost-control requirements who want an observability platform that scales retention without scaling indexing costs proportionally.
Key features
- SQL log querying for teams comfortable with structured query patterns
- Object storage architecture for lower log storage costs at volume
- Columnar data format optimized for analytical queries
- Native OpenTelemetry support for logs, metrics, and traces
- Dashboards, alerting, real user monitoring, and session replay
Why choose OpenObserve: The retention economics are the draw. Teams moving large volumes of application logs through Datadog or Elastic often find OpenObserve meaningfully cheaper for long-term log storage. Evaluate ecosystem maturity, integration depth, and support SLAs against a larger vendor before making the switch on a critical production workload.
OpenObserve pricing: Cloud pricing runs $0.30 per GB for logs, metrics, and traces, plus $0.01 per GB query volume, usage-based. Self-hosted Open Source is free. The Enterprise tier includes advanced capabilities and is free up to 50 GB of ingestion per day; contact sales for higher volumes. The free cloud tier was discontinued in June 2025.
G2 rating: 5.0/5
8. OpenSearch
OpenSearch is an Apache 2.0-licensed search and analytics suite covering log analytics, observability, security analytics, and machine learning. Forked from an earlier version of Elasticsearch, it gives teams full control over their search infrastructure without licensing fees. Managed OpenSearch is available through AWS and other cloud providers for teams that want the capabilities without operating clusters.
Best for: Teams that need open-source search infrastructure for log analytics and want to avoid vendor lock-in on the underlying search engine.
Key features
- Full-text and structured search across log records
- OpenSearch Dashboards for visualization and operational analysis
- Alerting plugin for threshold-based and anomaly-based notifications
- Security plugin with RBAC, field-level security, and audit logging
- Observability plugins for logs, metrics, and distributed traces
Why choose OpenSearch: Open-source governance and no licensing fees make it attractive for teams with the operational capacity to run search clusters. AWS managed OpenSearch removes cluster operations overhead for teams already in that cloud. Bear in mind that cluster sizing, index management, and search performance tuning require specific expertise at scale.
OpenSearch pricing: The OpenSearch software is free under the Apache 2.0 license. Infrastructure and managed service costs apply when running it. AWS OpenSearch Service and other managed providers charge based on instance size, storage, and data transfer, priced through their respective platforms.
G2 rating: 4.4/5
9. Graylog
Graylog is a centralized log management and SIEM platform built around structured log collection, stream-based routing, pipeline processing, and correlation-based alerting. It is used by both IT operations teams managing infrastructure logs and security operations teams running compliance investigations and threat detection workflows.
Best for: Security and IT operations teams that need structured log management with configurable parsing, stream routing, event correlation, and compliance archiving.
Key features
- Streams and pipelines for routing and processing log data by source or type
- Search, dashboards, and reporting across centralized log management
- Event correlation and alerting for security and operational workflows
- Data enrichment with threat intelligence feeds
- Archive and retention controls with tiered storage options
Why choose Graylog: The pipeline architecture is practical for teams that need different retention and access rules for different log sources. Graylog Open covers a broad set of centralized logging use cases at no cost. The Enterprise and Security tiers add data tiering, correlation, SIEM capabilities, and AI-generated incident reports for teams that need them.
Graylog pricing: Graylog Open is free and source-available. Graylog Enterprise starts at $15,000 per year on an annual subscription. Graylog Security starts at $18,000 per year. Licensed plans start from 10 GB per day or 100 GCUs.
G2 rating: 4.4/5
10. Sumo Logic
Sumo Logic is a cloud-native SaaS platform covering log analytics, infrastructure observability, cloud SIEM, and security analytics. It ships with prebuilt applications for popular cloud services, Kubernetes, and security use cases, reducing the setup time to get useful dashboards and alerting in place. The platform uses a credit-based consumption model with a free tier and a 30-day full-feature trial.
Best for: DevOps and SecOps teams at cloud-scale organizations that want managed log analytics with security analytics and compliance reporting in a single SaaS platform.
Key features
- Cloud log analytics with real-time search and visualization
- Cloud SIEM for security event correlation and threat detection
- Prebuilt applications for AWS, Kubernetes, and security data sources
- AI-powered troubleshooting and conversational analysis
- Compliance reporting and hundreds of integrations
Why choose Sumo Logic: The prebuilt application library reduces time to first value for common cloud and Kubernetes log sources. Teams should model ingest volume and retention against the credit-based pricing to estimate monthly costs before committing. Security-focused buyers should evaluate whether they need the observability and SIEM packages together or separately.
Sumo Logic pricing: A free account and a 30-day full-feature trial are available. Paid plans use a credit-based model. The Essentials tier is self-service; Enterprise Suite requires a quote from Sumo Logic's sales team.
G2 rating: 4.3/5
11. Logz.io
Logz.io is a managed observability platform that brings together log management, infrastructure monitoring, and distributed tracing in a consumption-based pricing model. It supports OpenTelemetry for telemetry collection and includes an AI Agent for automated root-cause analysis, making it relevant for teams that want open-source observability capabilities without operating the underlying components themselves.
Best for: Engineering and operations teams that prefer the architecture of open-source observability tooling but want managed operations and AI-assisted analysis rather than running every component themselves.
Key features
- Managed log analytics with search, alerting, and dashboards
- OpenTelemetry support for logs, metrics, and traces
- AI Agent for automated root-cause analysis across telemetry types
- Data Optimization Hub for filtering telemetry and controlling ingest costs
- Agentic observability layer for AI-driven investigation workflows
Why choose Logz.io: The combination of open-source familiarity and managed operations removes a common objection for teams that want ELK-style log analytics without cluster maintenance. Compare retention costs and overage pricing carefully. Monthly billing runs 1.2x the annual rate, so the pricing difference between commitment options is worth modeling before a trial decision.
Logz.io pricing: Log management runs $0.92 per ingested GB per day. Infrastructure monitoring is $0.40 per 1,000 time series metrics per day. Distributed tracing costs $0.16 per 1 million spans per day. A free trial is available for the Pro tier; Enterprise pricing requires a quote. Prices reflect the AWS us-east region.
G2 rating: 4.5/5
12. SolarWinds Log Analyzer
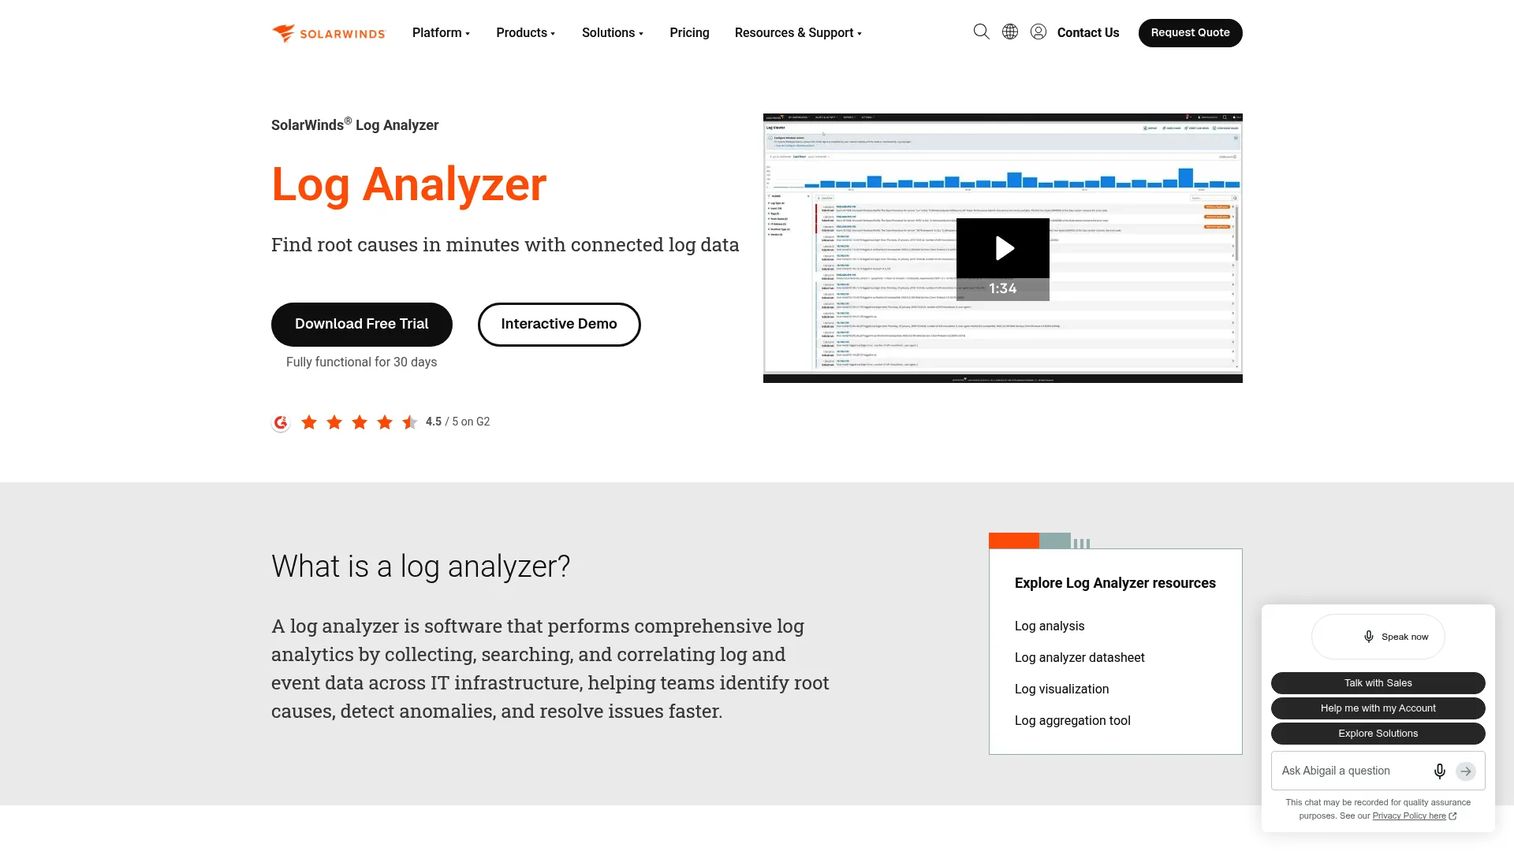
SolarWinds Log Analyzer is a log and event analysis tool designed for IT operations teams managing servers, network devices, and hybrid infrastructure. It centralizes syslog, SNMP traps, Windows events, and VMware events, then correlates log data with network and server performance metrics through PerfStack. It is packaged as part of SolarWinds Observability Self-Hosted.
Best for: IT operations teams that already use SolarWinds for network and infrastructure monitoring and want to add real-time log monitoring without switching platforms.
Key features
- Centralized collection of syslog, SNMP traps, Windows events, and VMware events
- Real-time log streaming and event visualization
- Built-in search and filters by log type, node, IP address, and time range
- PerfStack integration for correlating logs with network and server performance
- Customizable alerting for log events and threshold conditions
Why choose SolarWinds Log Analyzer: Teams already running SolarWinds for infrastructure monitoring gain log correlation without a separate platform. The familiar IT ops workflow and infrastructure context reduce onboarding time for ops-focused teams. Cloud-native engineering teams with container-heavy environments should compare it against observability-first platforms before committing.
SolarWinds Log Analyzer pricing: Priced as part of SolarWinds Observability Self-Hosted at $8 per node per month, with volume discounts available on multi-year contracts billed annually. A 30-day fully functional trial is available.
G2 rating: 4.5/5
Considerations when choosing log monitoring software
Start with incident workflow, not feature volume
Map the path from alert to root cause to owner handoff before evaluating dashboards. A tool with elegant visualizations but slow log search will frustrate the on-call engineer who needs to find the failing service in 10 minutes. Run the three queries your team runs during actual incidents and compare how each candidate performs.
Model retention costs before the trial
Pricing for log monitoring platforms depends on ingest volume, indexed data, retention period, rehydration frequency, and cold archive usage. For a practical estimate, take one month of real log volume, apply the vendor's ingest and indexing rates at 90-day retention, then add rehydration assumptions. This calculation often shifts which tool looks cost-effective more than any feature comparison.
Check Kubernetes and OpenTelemetry fit
Ask whether the platform attaches pod names, namespace, deployment labels, and container metadata automatically. Confirm OpenTelemetry Collector compatibility, since most modern cloud-native stacks route telemetry through a collector before the log platform. Ephemeral workloads produce logs that disappear fast; the platform needs to capture and index them before the pod is gone.
Validate governance and access control
RBAC, audit logs, retention policies, data residency, SSO, and sensitive field masking matter in enterprise evaluations and security reviews. Confirm which tier includes each control and whether the vendor's data processing agreements match your organization's requirements. This is a point for your security and compliance teams to verify, not something to assume from the pricing page.
Test query speed with your own log patterns
Demo environments use clean, low-volume data. Your production logs are messy, inconsistent, and high-volume. Before a purchase decision, run a proof-of-concept with a representative data sample, including the noisiest sources and the most complex queries your team uses. Query latency at real volume can differ significantly from trial conditions.
Conclusion
The log monitoring software market offers strong options at every tier. For broad observability with correlated telemetry, Datadog Log Management is the default choice for teams already standardizing on one platform. Splunk covers enterprise search depth and security analytics workflows that other platforms match only partially. Elastic Observability fits Elastic-native teams that need powerful log search alongside APM and traces.
For cloud-native Kubernetes logging, Grafana Loki pairs naturally with existing Grafana investments. OpenObserve addresses high-volume retention economics that make other platforms expensive at scale. Graylog and Sumo Logic serve security and compliance-focused operations teams. SolarWinds Log Analyzer fits IT operations teams already running SolarWinds infrastructure monitoring.
The right next step: Shortlist three tools, estimate 90 days of log volume and retention costs for each, and run a 14 to 30 day POC with real log data. Include your SRE, security, and platform stakeholders in the evaluation criteria before anyone falls in love with a dashboard.
Once your team has settled on a log monitoring platform, the next challenge is helping buyers and internal stakeholders understand how your product integrates with that stack. If your presales team needs to walk prospects through complex observability integrations without rebuilding live demo environments, interactive demos give you a way to show the story clearly.
Start your journey with Guideflow today!
FAQs
Log monitoring software collects machine-generated log records from applications, servers, containers, network devices, and cloud services, then centralizes them for search, analysis, and alerting. Core functions include ingestion, parsing, real-time search, dashboards, and retention management. Examples of log sources include application error logs, Kubernetes pod logs, server event logs, database query logs, and authentication logs.
Log monitoring focuses on active detection: Real-time search, alerting on patterns, and helping engineers investigate incidents as they happen. Log management covers the full data lifecycle, including collection, routing, storage, retention policy enforcement, archiving, and access governance. Modern platforms typically handle both, but the emphasis shifts depending on whether the primary buyer is an SRE team or a security operations team.
SIEM (Security Information and Event Management) platforms focus on security event correlation, threat detection, compliance investigations, and incident response workflows. Log monitoring platforms address operational troubleshooting and observability across engineering and infrastructure teams. The distinction blurs at the product level: Splunk and Graylog Security serve both purposes, while platforms like Grafana Loki focus on operational observability without SIEM capabilities. Many teams run logs through an observability platform and then forward security-relevant events to a dedicated SIEM.
Grafana Loki is purpose-built for Kubernetes label-based log aggregation and works natively with Grafana dashboards. Datadog Log Management and Dynatrace both attach Kubernetes metadata automatically and correlate pod logs with infrastructure metrics. Elastic Observability, New Relic, OpenObserve, and OpenSearch can all handle Kubernetes logging with appropriate agent configuration and OpenTelemetry Collector setup. The right choice depends on whether your team prioritizes search depth, cost efficiency, or existing platform fit.
Log monitoring pricing drivers include ingest volume, indexed data size, retention period, number of hosts or seats, rehydration frequency, and security add-ons. Usage-based platforms like Datadog, Elastic, and OpenObserve charge primarily per GB ingested. Host-based platforms like Dynatrace and SolarWinds charge per monitored node. Before buying, model one month of real log volume at your expected retention period. A 90-day retention estimate on a high-volume fleet can shift total cost significantly between vendors.
Run the three queries your on-call team uses during a real incident. Test ingest from your primary log sources, confirm parsing produces structured fields your team can filter on, and check how long a complex search takes at full data volume. Validate alert quality with a sample of known-good conditions, confirm RBAC restricts access correctly, and test dashboard load times. If long-term retention matters, send a month of historical data and time a rehydration query.
Correlated telemetry shortens incident investigation: You can follow a trace to a log line without switching tools or copying timestamps. Teams running Datadog, Dynatrace, or New Relic get that correlation by default. Many successful teams use separate tools for each signal type, with clear ownership and routing, and manage without full unification. The decision depends on how often incidents require cross-signal investigation and whether your teams can coordinate across multiple dashboards under pressure.
Start with the signals closest to user impact: Application error logs, API gateway logs, authentication events, and database error logs. Add deployment logs so you can correlate releases with incident timing. Infrastructure event logs from servers and Kubernetes nodes round out the operational baseline. Security-relevant access logs, including privileged account activity and configuration changes, matter for compliance and security operations. Once those sources are ingested and producing alerts, expand from there based on where incidents have previously been hard to diagnose.