

Someone on the engineering team just pushed a coverage number into the deal room. "We're at 82%." The prospect nods. Everyone feels a little safer. And that number, on its own, proves almost nothing about whether the tests catch real bugs.
Coverage measures which lines of code ran during your test suite. It does not measure whether those tests would fail when something breaks. You can hit high coverage with weak assertions, and you can have brilliant tests that still leave risky paths untouched. The number is a signal, not a verdict.
That gap matters more than it used to. Around 74% of large enterprises had fully implemented CI/CD pipelines by 2025, up from 42% in 2020, according to MarketIntelo. When every merge runs through automated gates, coverage stops being a quarterly report and becomes a live control on what ships. The market has followed: code coverage tooling was valued at $1.2B in 2025 and is projected to reach $2.2B by 2034, per the same MarketIntelo research.
So the real decision is not "what's our number." It's which tool fits your language, plugs into your CI pipeline, and surfaces coverage where developers actually make decisions, inside the pull request. A Java monorepo, a Python service, and a polyglot startup all need different answers. If you also evaluate the developer tooling landscape more broadly, our roundup of the best AI code generation tools is a useful companion read.
This guide sorts the options so you can pick fast.
What's inside
This guide compares 12 real code coverage tools, from language-native coverage libraries to hosted CI workflow platforms and polyglot reporting layers. It is written for engineering teams choosing a stack, and for the presales and technical validation folks who need to understand coverage well enough to answer buyer questions about release confidence.
We chose the list on four criteria: stack fit (does it cover your language natively), CI/CD and pull request workflow support, reporting depth (line, branch, function, and condition coverage), and real developer adoption. No vanity metrics, no filler tools.
TL;DR
- Best overall for PR feedback and cross-language workflow: Codecov.
- Best free Java coverage library: JaCoCo.
- Best Python coverage standard: Coverage.py.
- Best private-repo coverage tracking with simple pricing: Coveralls.
- Best cloud quality gate platform: SonarQube Cloud.
- Best language-specific picks: Coverlet and dotCover for .NET, Kover for Kotlin, Istanbul / NYC for JavaScript, gcovr for C/C++, and Clover for legacy Java and Groovy.
- Rule of thumb: Start with the language-native tool, then add a workflow layer when you need pull request feedback or cross-team visibility.
What are code coverage tools?
Code coverage tools measure which parts of your source code are executed when your automated tests run, then report that data as coverage metrics.
Those metrics come in a few flavors, and knowing the difference keeps you honest:
- Line coverage: Which individual lines of code ran at least once. The most common headline number, and the easiest to inflate.
- Branch coverage: Whether each decision path (both the
ifand theelse) was exercised. Stronger signal than line coverage, because a single line can hide multiple untested paths. - Function coverage: Whether each function or method was called during tests.
- Statement coverage: Whether each executable statement ran, similar to line coverage but counted at the statement level.
- Condition coverage: Whether each boolean sub-expression inside a decision evaluated both true and false.
In practice, code coverage testing tools do a handful of concrete jobs:
- Instrument your code so the runtime can track what executed, either on the fly or at build time.
- Generate coverage reports in formats like HTML, XML, LCOV, Cobertura, and JSON for humans and downstream tools.
- Integrate with CI/CD so coverage runs on every commit and pull request.
- Enforce quality gates by failing a build or blocking a merge when coverage drops below your thresholds.
Here is the part every honest guide has to say out loud: good coverage can coexist with weak tests. A suite can execute 90% of your lines while asserting almost nothing. Coverage tells you what ran. Assertion quality tells you whether it mattered. Treat the number as a floor for confidence, not proof of it. A study of 47 software projects found average coverage sitting around 74 to 76% in real life, per research cited by LaunchDarkly, which is a more useful reference point than any aspirational target.
When to use code coverage tools
Coverage tooling earns its place in three situations. Most teams hit all three eventually.
Protect releases in CI
Use coverage as a gate when you want to block low-confidence merges automatically. The pattern that works: run coverage on every pull request, post the delta as a PR comment, and set a status check that fails when coverage on changed lines drops below a threshold. That keeps quality visible at the exact moment a reviewer decides whether to approve. Gating on the whole codebase tends to punish people for old debt, so most teams gate on changed code instead.
Choose a tool by language
Use a language-native tool first when your stack leans heavily toward one language. JaCoCo for Java, Coverage.py for Python, Istanbul / NYC for JavaScript, Coverlet for .NET, Kover for Kotlin, gcovr for C and C++. These tools understand the runtime and produce accurate instrumentation. Layer a reporting or workflow tool on top only after the native measurement is solid.
Reduce blind spots in technical validation
Use coverage to get fast signal on what changed, what is untested, and where the risky paths sit. This is where presales and technical buyers care too. When a prospect asks "how do you know a release is safe," a coverage gate tied to changed code is a concrete, defensible answer. It turns "trust us" into a visible control.
Comparison table
Pricing and ratings below reflect what each vendor publishes on its own site, plus verified G2 listings. Many of these tools are open source, so their pricing is free by nature and no G2 rating is published. Verify usage-based and paid tiers against the vendor page before you commit, since plans change.
| # | Product | Intent | Key differentiation | Pricing | G2 rating |
|---|---|---|---|---|---|
| 1 | Codecov | Hosted coverage in the PR workflow | Coverage diffing, test analytics, flaky test detection | Free plan; paid from $5/user/mo | 3.9/5 |
| 2 | Coverage.py | Python coverage measurement | Line and branch coverage, multi-format reports | Free, open source | Not listed |
| 3 | JaCoCo | Java coverage library | On-the-fly JVM instrumentation, CI-friendly reports | Free, open source | 4.5/5 |
| 4 | Coveralls | Hosted coverage tracking | Simple per-repo pricing, coverage history | Free for public; from $10/mo | 4.9/5 |
| 5 | SonarQube Cloud | Coverage plus code quality gates | Coverage inside broader static analysis | Free plan; Team from $32/mo | 4.4/5 |
| 6 | Istanbul / NYC | JavaScript and TypeScript coverage | Native JS instrumentation, many reporters | Free, open source | Not listed |
| 7 | Coverlet | .NET coverage framework | Cross-platform, multiple report formats | Free, open source | Not listed |
| 8 | dotCover | .NET coverage in-IDE | Visual Studio and Rider integration | From $609/user/yr (in dotUltimate) | 4.1/5 |
| 9 | Kover | Kotlin coverage for Gradle | Native Kotlin coverage, Gradle plugin | Free, open source | Not listed |
| 10 | Clover | Java and Groovy coverage | Per-test coverage, test optimization | Free, open source | Not listed |
| 11 | pytest-cov | pytest-integrated coverage | Coverage inside pytest runs, xdist support | Free, open source | Not listed |
| 12 | gcovr | C and C++ coverage reporting | gcov report generation, many formats | Free, open source | Not listed |
1. Codecov
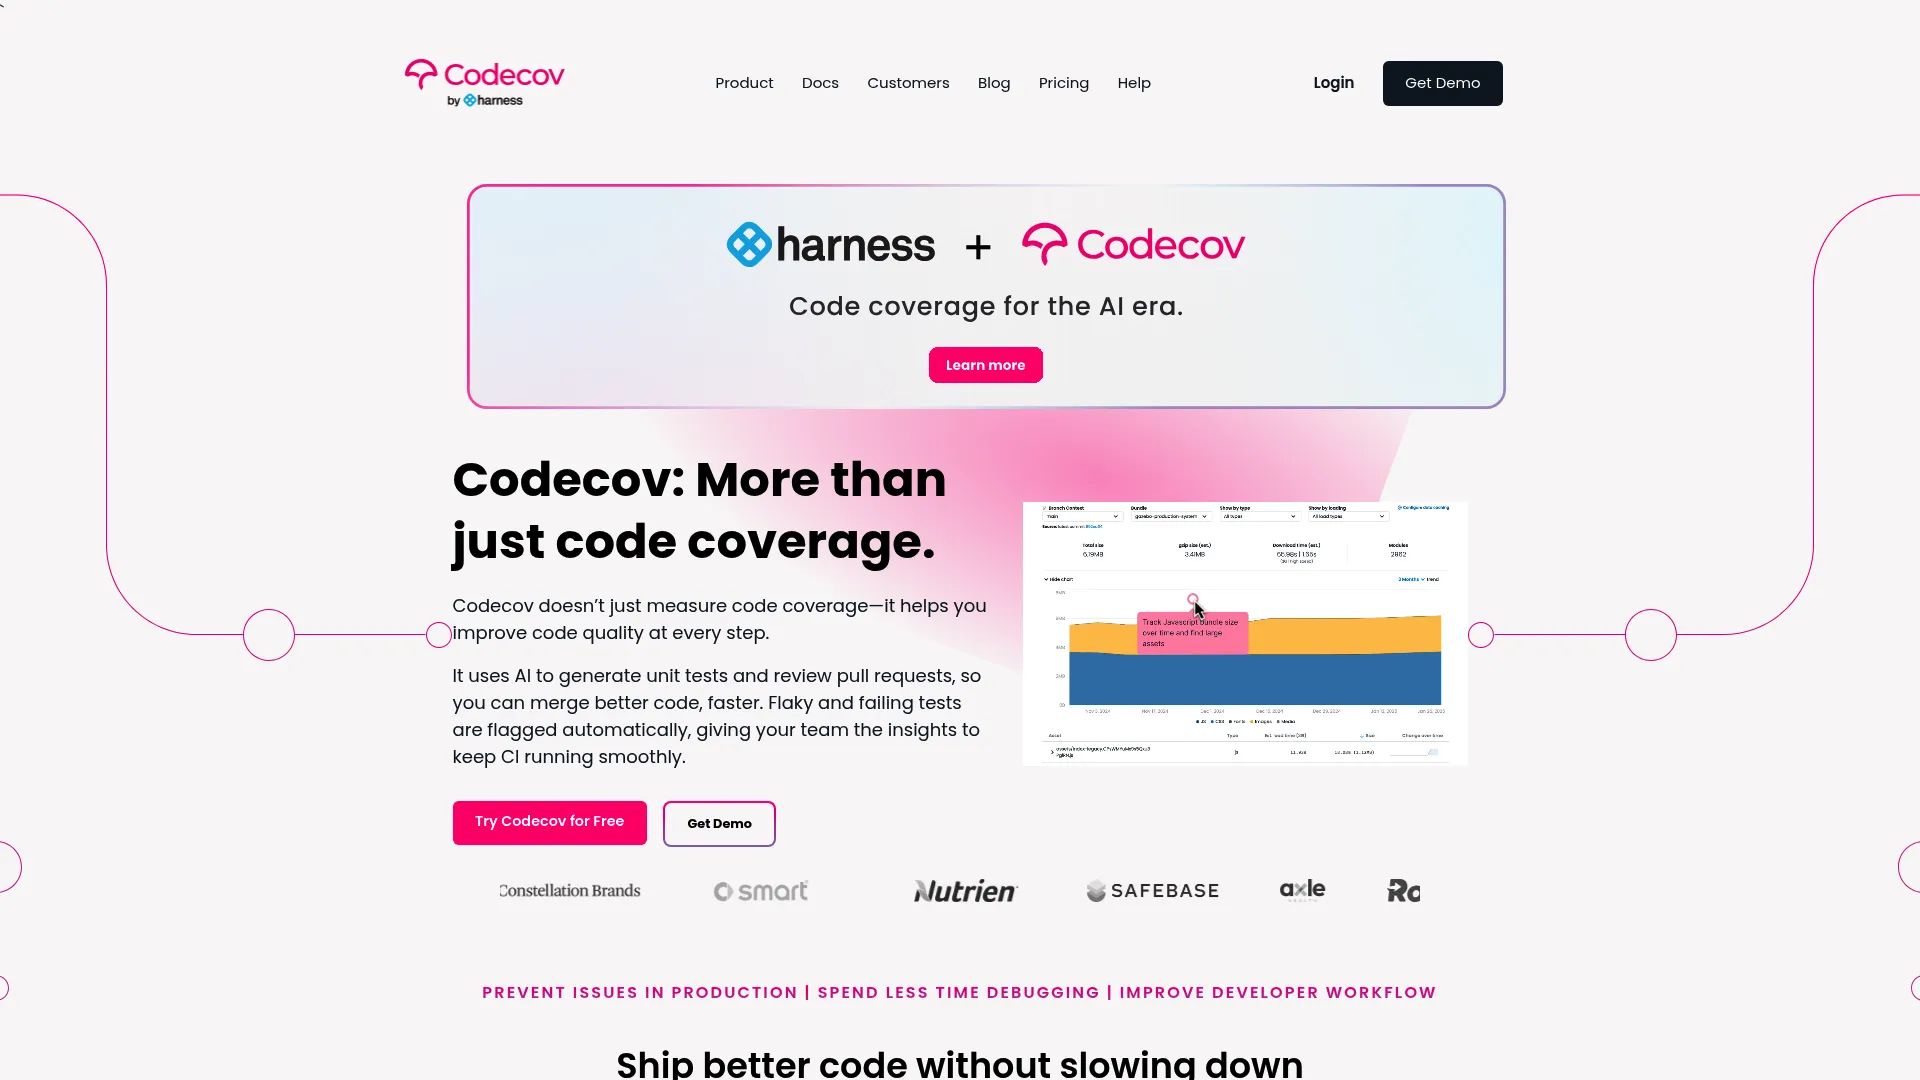
Codecov is a hosted code coverage and test analytics platform built to live inside the pull request, not in a dashboard nobody opens. It ingests coverage reports from your CI, computes the diff against the base branch, and posts the result directly on the PR so reviewers see exactly what changed and what stayed untested. It works across languages, which makes it a natural fit for polyglot teams juggling Java, Python, JavaScript, Go, and more.
Beyond raw coverage, Codecov layers in test analytics and flaky test detection, so you can spot the tests that pass and fail inconsistently and drain trust in your suite. That flaky test intelligence is a real differentiator for teams whose CI has become noisy. Bundle analysis and PR alerts round out the picture.
Best for: Teams that want coverage and test health to show up automatically in every pull request, across multiple languages.
Key strengths
- Coverage diffing: Shows coverage change on the exact lines a PR touches, not just a whole-repo number.
- Test analytics and flaky detection: Surfaces unreliable tests before they erode confidence in the suite.
- Bundle analysis and PR alerts: Catches bundle size regressions and posts context where developers review.
Why choose Codecov: If your review workflow is the place coverage decisions actually get made, Codecov puts the numbers there instead of a separate report. It suits teams standardizing coverage across several languages who want one place to see coverage, flaky tests, and merge risk.
Codecov pricing: The Developer plan is free for open source and limited private use. Team is $5 per user per month and Pro is $12 per user per month. Enterprise is custom pricing. Codecov holds a 3.9 out of 5 rating on G2.
2. Coverage.py
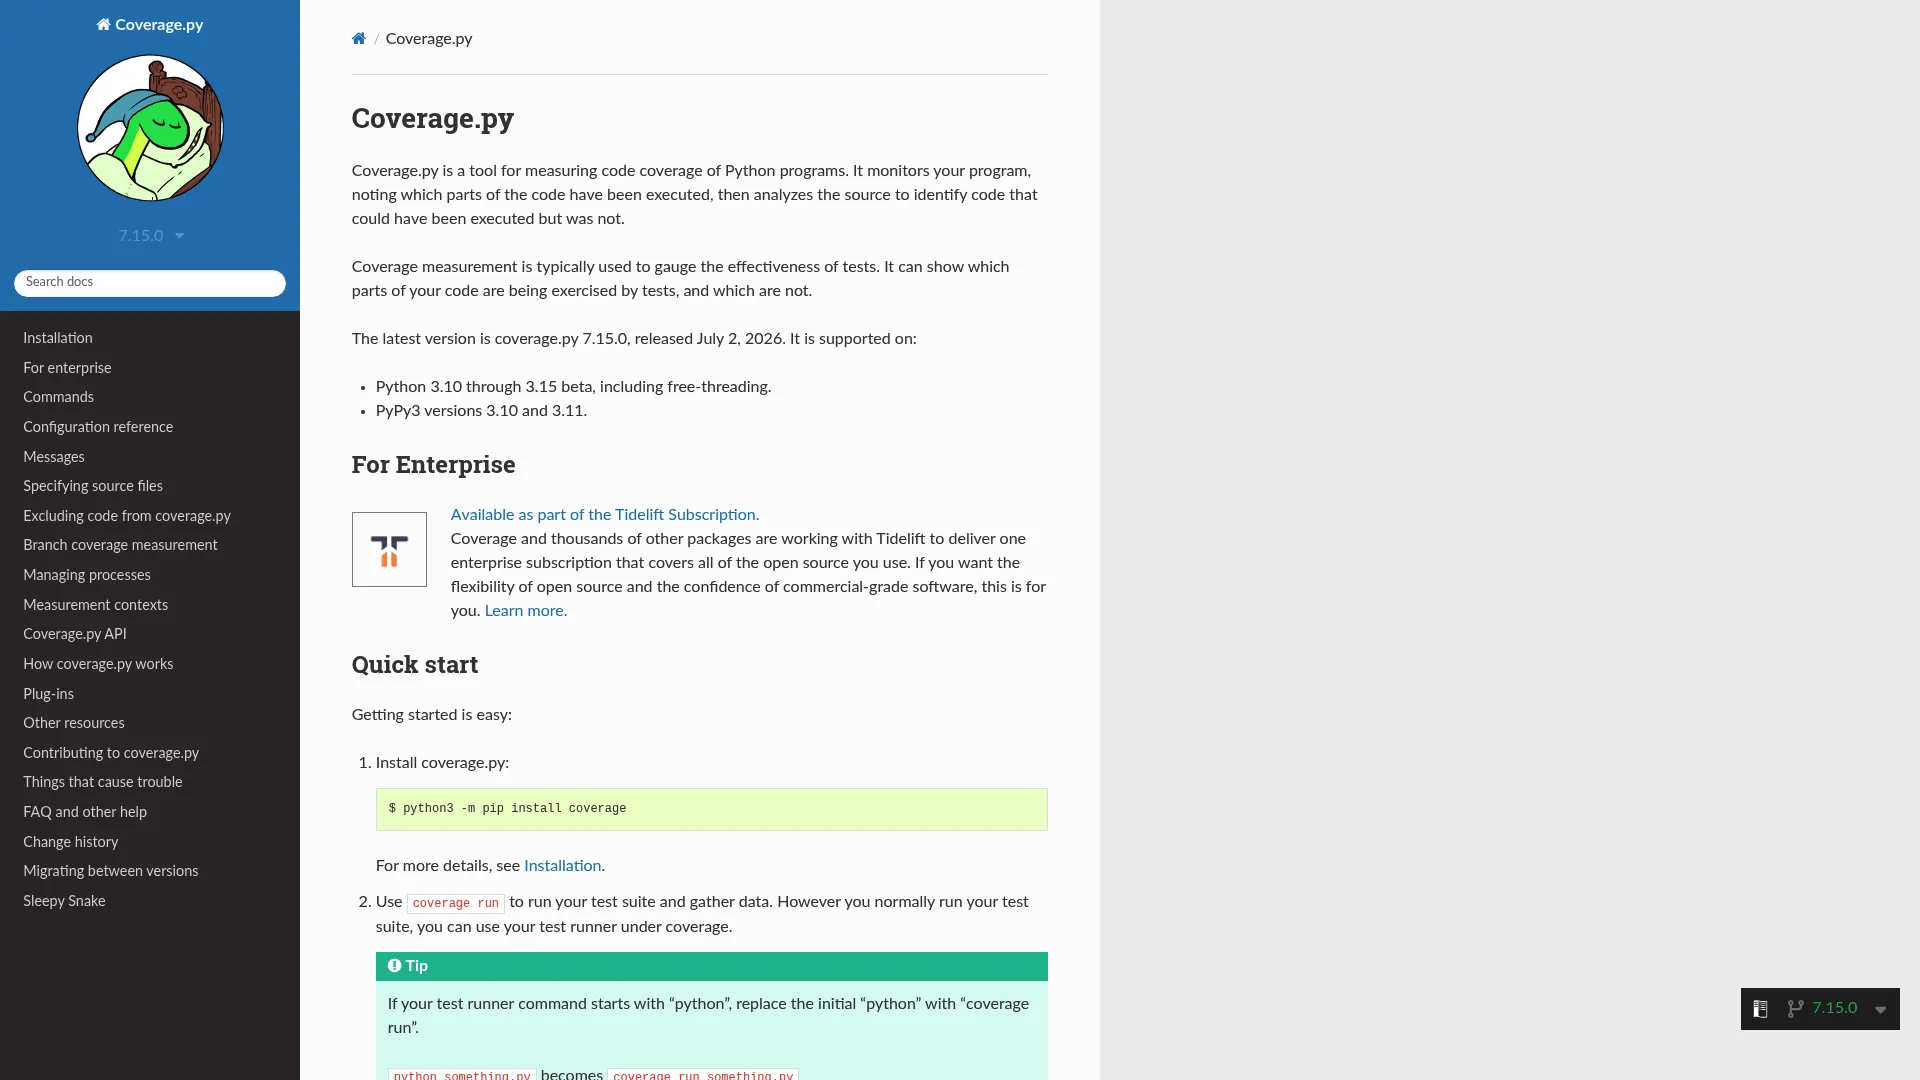
Coverage.py is the default reference point for measuring test coverage in Python. Most Python teams either use it directly or use a tool that wraps it. It runs your test suite, records which lines and branches executed, and reports what was missed, all from a straightforward command-line workflow that fits neatly into scripts and CI.
For unit test coverage it does exactly what you want without ceremony. It measures both line coverage and branch coverage, tells you which tests ran which lines, and produces reports in text, HTML, XML, LCOV, and JSON so you can feed downstream reporting or quality gate tools. Professional support is available through Tidelift for teams that need it.
Best for: Python teams that want accurate, no-nonsense coverage measurement and flexible report output.
Key strengths
- Line and branch coverage: Measures both, so you catch untested decision paths, not just unexecuted lines.
- Which-tests-ran-which-lines: Maps execution back to specific tests for debugging gaps.
- Multi-format reports: Exports text, HTML, XML, LCOV, and JSON for humans and downstream tooling.
Why choose Coverage.py: It is the standard because it is accurate, well documented, and integrates with everything in the Python ecosystem. If you write Python and need code coverage, this is the foundation you build on before adding any hosted layer.
Coverage.py pricing: Coverage.py is free and open source. There is no public pricing page, and paid professional support is offered separately through Tidelift.
3. JaCoCo
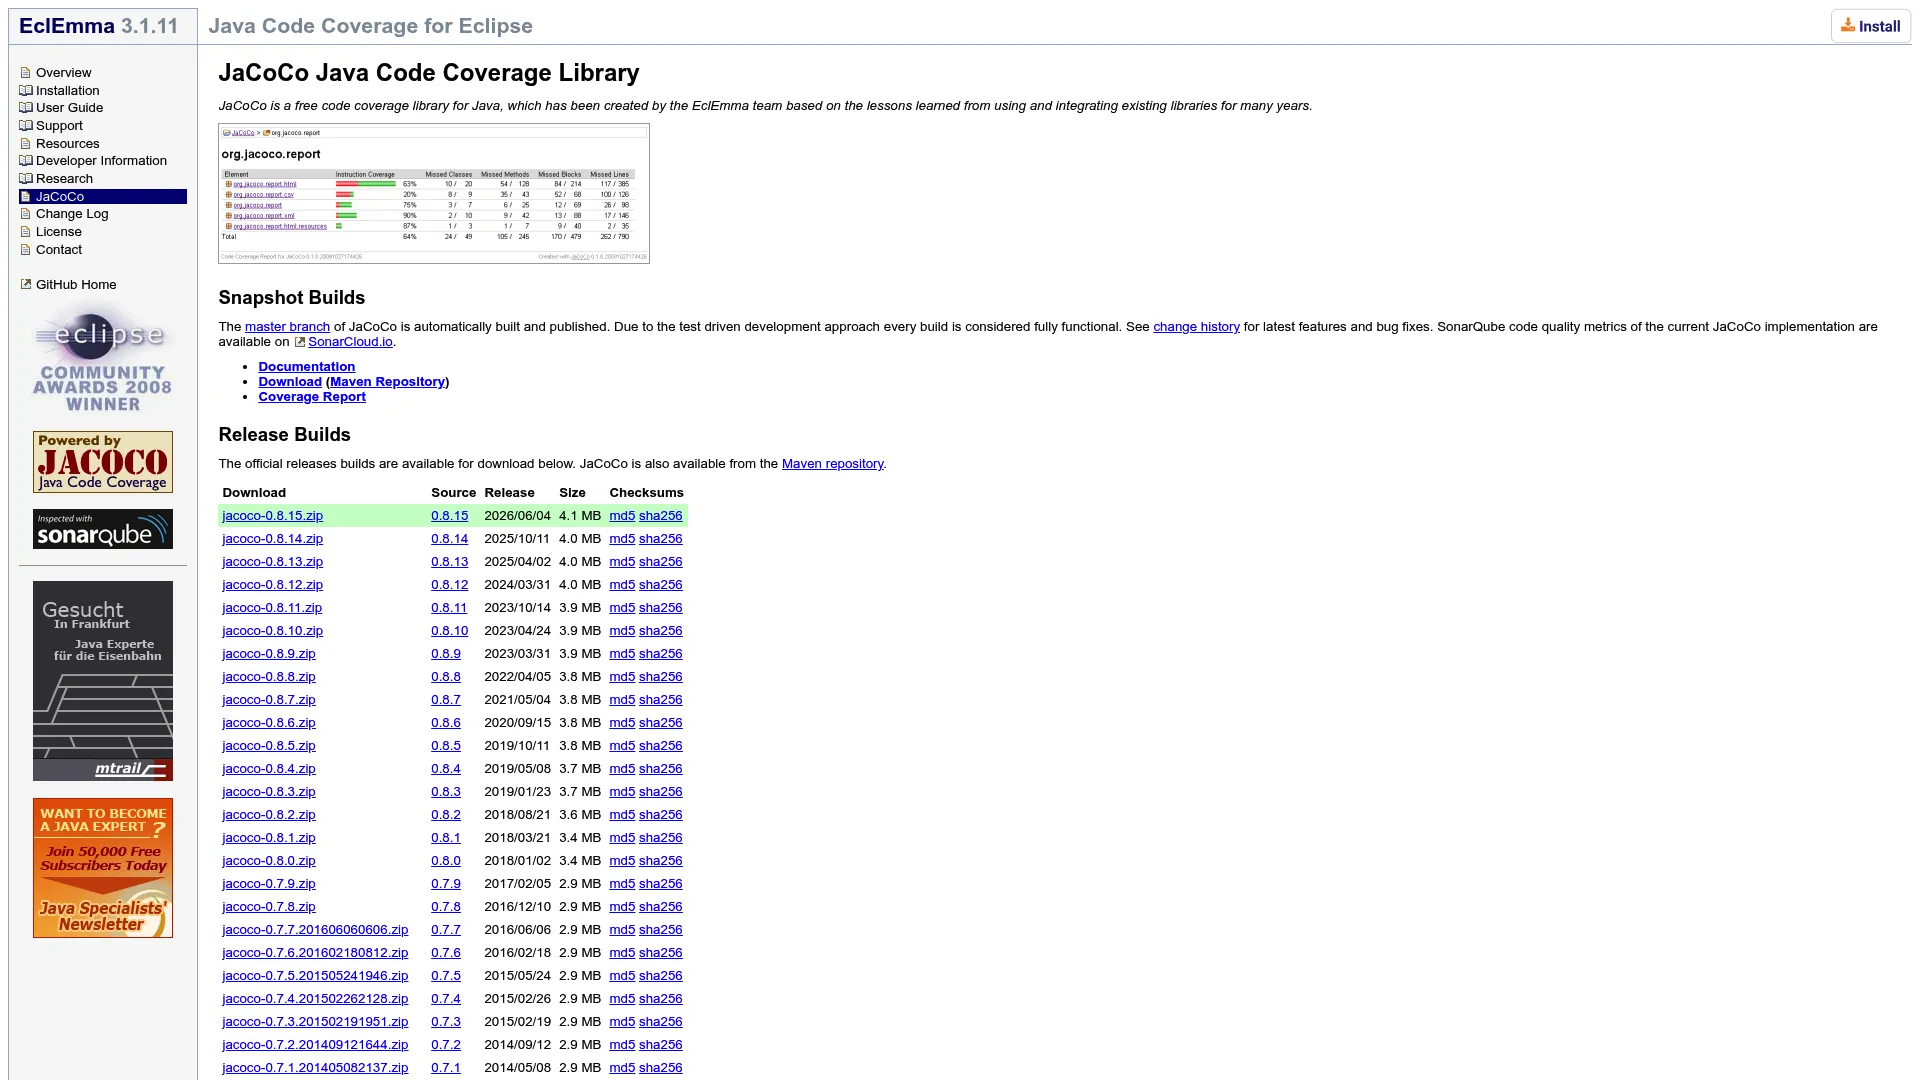
JaCoCo is the standard code coverage library for Java and JVM-based environments. If you are searching for code coverage tools for Java, this is almost always where the search ends. It uses a Java agent to instrument bytecode on the fly, so it measures coverage without requiring source-level changes, and it plugs cleanly into Maven, Gradle, and CI pipelines.
Best for: Java and JVM teams that need accurate, build-integrated coverage with detailed metric breakdowns.
Key strengths
- On-the-fly instrumentation: A Java agent instruments bytecode at runtime, no source changes required.
- Deep metric coverage: Reports instructions, branches, lines, methods, types, and complexity.
- CI-friendly reports: Outputs HTML, XML, and CSV for pipelines and downstream tools.
Why choose JaCoCo: It is free, open source, and the de facto standard, which means broad tooling support and easy hiring. Most Java teams start here and add a hosted reporting layer only when they want cross-repo visibility.
JaCoCo pricing: JaCoCo is free and open source, with no paid tiers listed on the official site. It holds a 4.5 out of 5 rating on G2.
4. Coveralls
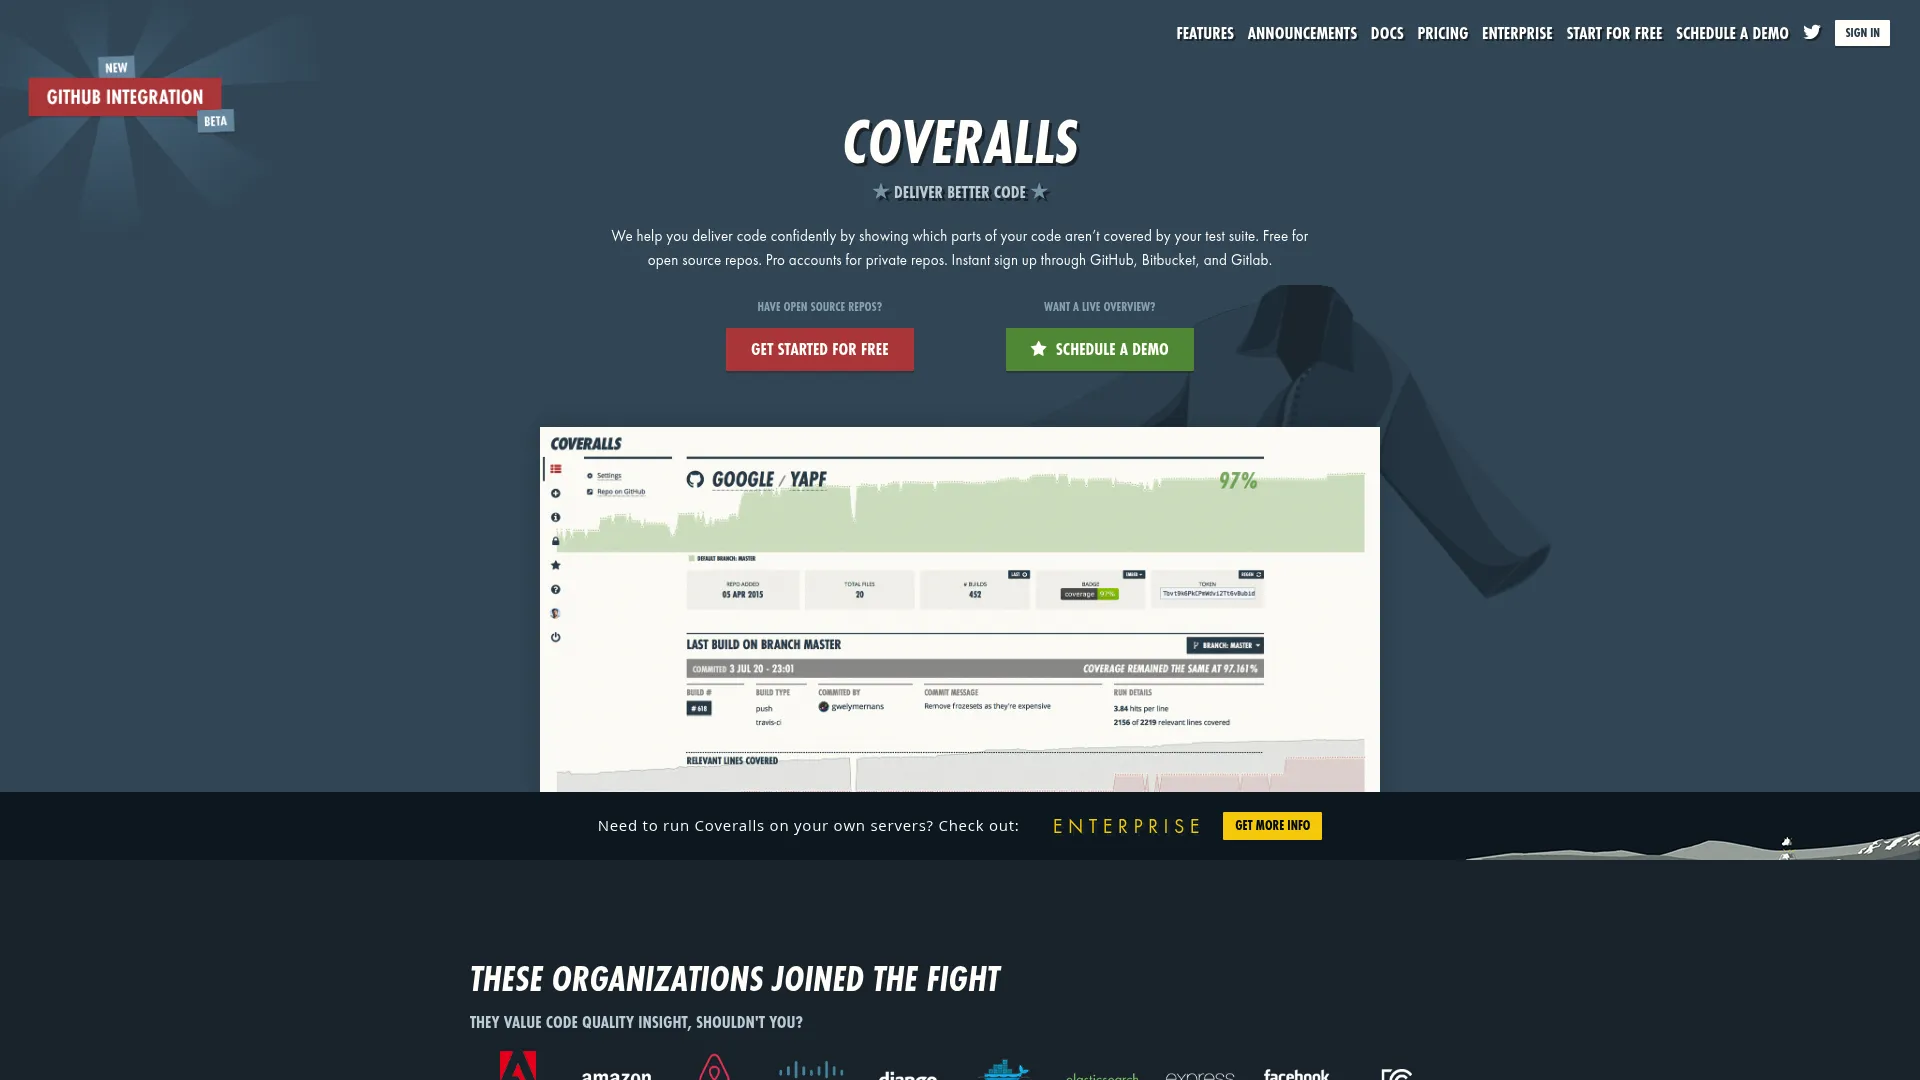
Coveralls is a hosted service for tracking test coverage over time across public and private repositories. It takes coverage reports from your CI, stores the history, and shows how coverage trends commit by commit. It posts PR comments and status updates so coverage changes are visible during review, and it supports major CI services and languages.
The appeal is straightforward pricing and simple coverage history. Open source repos are free, and private repo plans are priced by the number of repos rather than per seat, which keeps costs predictable as your team grows. That per-repo model with generous user access makes it attractive for teams who want coverage reporting without seat-count math.
Best for: Teams that want hosted coverage history and pull request feedback with simple, repo-based pricing.
Key strengths
- Coverage history and statistics: Tracks how coverage trends over time, commit by commit.
- PR comments and status checks: Surfaces coverage changes during code review.
- Broad CI and language support: Integrates across major CI services and many languages.
Why choose Coveralls: If your priority is a clean, affordable way to see coverage history and get PR feedback without worrying about per-user costs, Coveralls fits. It is a solid hosted layer on top of a language-native tool like Coverage.py or JaCoCo.
Coveralls pricing: Public repositories are free. Private repo pricing starts at $10 per month for the Starter plan and scales up through Org, Pro, Unlimited, and enterprise tiers based on repo count. Coveralls holds a 4.9 out of 5 rating on G2.
5. SonarQube Cloud
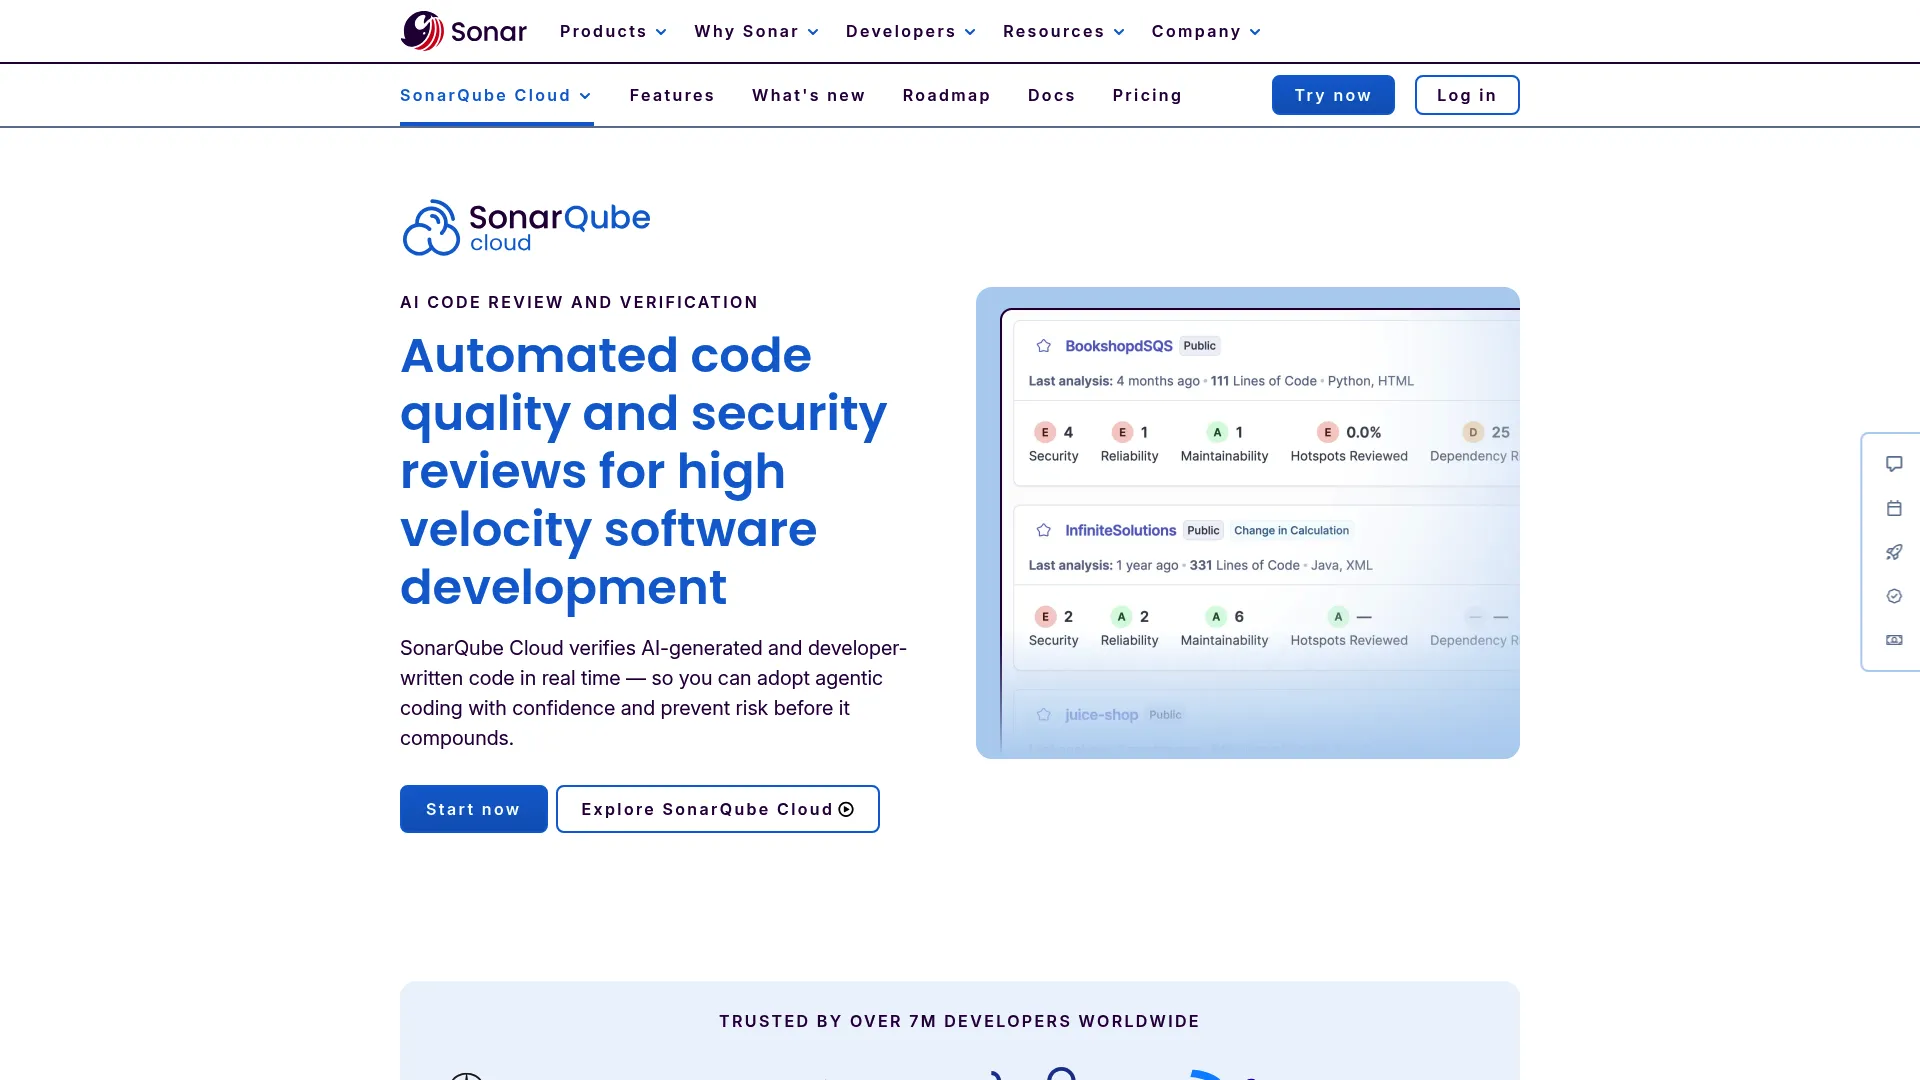
SonarQube Cloud treats coverage as one input into a broader picture of code quality and security. It runs automated code review in your CI/CD, applies quality gate checks on pull requests, and flags vulnerabilities and code smells alongside coverage on new code. For teams that want coverage plus static analysis in one managed place, it consolidates the stack.
The quality gate model is the draw here. Instead of coverage living in isolation, SonarQube Cloud can block a merge when new code fails to meet coverage thresholds and other quality rules together. That makes it a strong fit for polyglot teams who want a single set of gates enforced consistently across languages.
Best for: Teams that want coverage folded into managed code quality and security gates rather than run as a standalone metric.
Key strengths
- Quality gate checks on PRs: Blocks merges that fail coverage and quality rules on new code.
- Automated code review in CI/CD: Runs analysis on every pull request automatically.
- Security analysis: Flags vulnerabilities and code smells alongside coverage.
Why choose SonarQube Cloud: Choose it when coverage is one part of a wider code quality mandate and you would rather manage one platform than several. It appeals to teams that want static analysis, security scanning, and coverage gates unified.
SonarQube Cloud pricing: There is a free plan that is always free. The Team plan starts at $32 per month, and Enterprise is quote-based annual pricing. SonarQube Cloud holds a 4.4 out of 5 rating on G2.
6. Istanbul / NYC
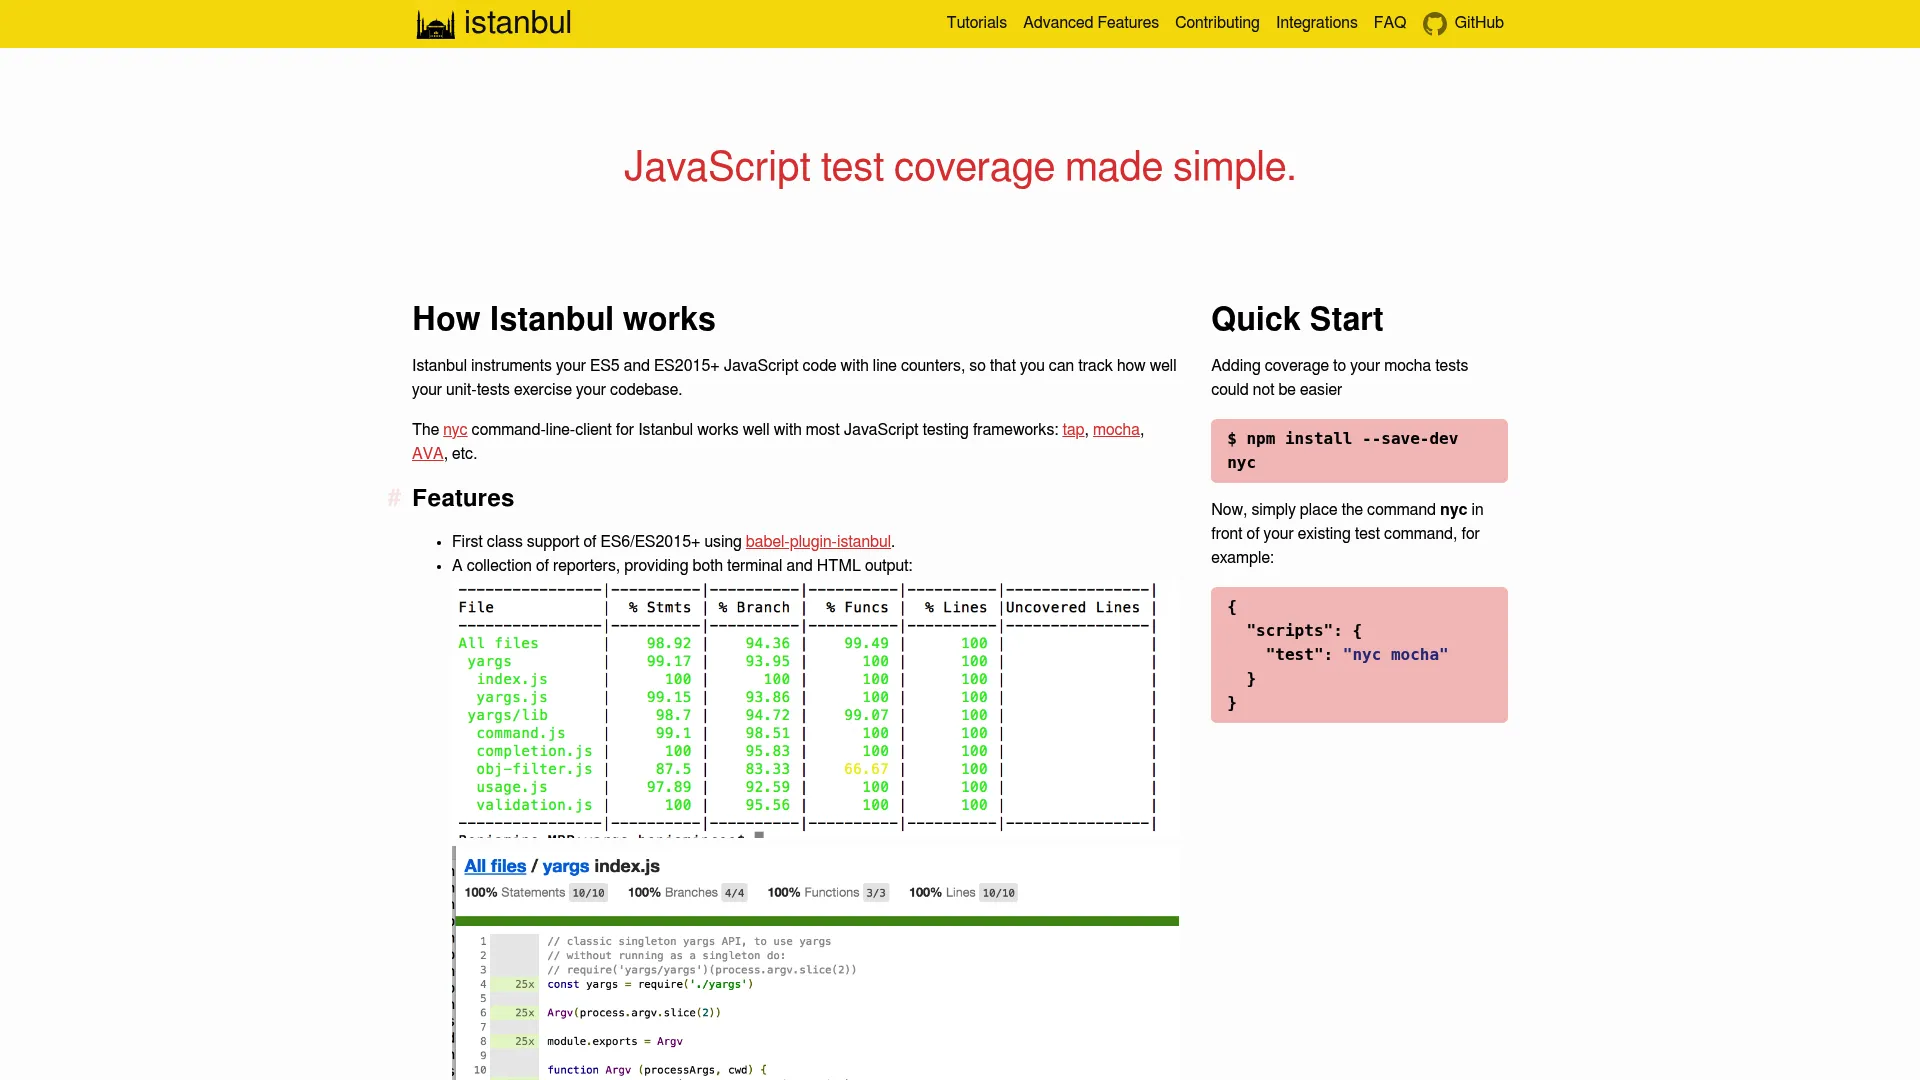
Istanbul / NYC is the workhorse for JavaScript and TypeScript coverage, where NYC is the command-line interface to the Istanbul instrumentation library. If you are looking at code coverage tools for JavaScript, this is the native layer that most higher-level reporting and dashboard tools sit on top of. It supports modern ES2015+ syntax through babel-plugin-istanbul and works with popular test frameworks.
For Node and frontend test workflows it is the standard measurement engine. It plays well with Mocha, AVA, Tap, and Jest, and it ships multiple reporters, from terminal summaries to full HTML reports. Because so many tools build on it, you often get Istanbul coverage without realizing it is the thing doing the work underneath.
Best for: JavaScript and TypeScript teams that need native coverage instrumentation for Node and frontend suites.
Key strengths
- Modern JS support: Handles ES2015+ and TypeScript via babel-plugin-istanbul.
- Broad framework support: Works with Mocha, AVA, Tap, Jest, and more.
- Multiple reporters: Outputs terminal, HTML, and other coverage report formats.
Why choose Istanbul / NYC: It is the de facto JavaScript coverage tool, so it integrates with essentially the entire JS testing ecosystem. Use it as your measurement layer and pair it with a hosted service like Codecov or Coveralls for history and PR feedback.
Istanbul / NYC pricing: Istanbul / NYC is free and open source, with no paid tiers or public pricing page.
7. Coverlet
Coverlet is a cross-platform code coverage framework for .NET, and a common default for C# teams that need coverage in their build pipelines. It measures line, branch, and method coverage, and it hooks into modern .NET test runners so coverage collection happens as a natural part of running tests, not as a bolt-on step.
Its flexibility across .NET workflows is the reason it shows up so often. Coverlet supports the Microsoft Testing Platform, VSTest, MSBuild, and .NET global tool workflows, so it fits whether you run tests locally, in CI, or through the SDK. It generates reports in JSON, Cobertura, LCOV, and OpenCover formats, which feed cleanly into services like Codecov or Coveralls.
Best for: .NET and C# teams that want free, cross-platform coverage integrated into build and CI pipelines.
Key strengths
- Line, branch, and method coverage: Covers the core metrics C# teams need.
- Runner flexibility: Works with Microsoft Testing Platform, VSTest, MSBuild, and the .NET global tool.
- Multiple report formats: Exports JSON, Cobertura, LCOV, and OpenCover for downstream tooling.
Why choose Coverlet: For a .NET team that wants coverage in CI without licensing costs, Coverlet is the standard open-source choice. Its Cobertura and LCOV output makes it easy to pipe results into a hosted reporting layer.
Coverlet pricing: Coverlet is free and open source. There is no public pricing page or paid tier.
8. dotCover
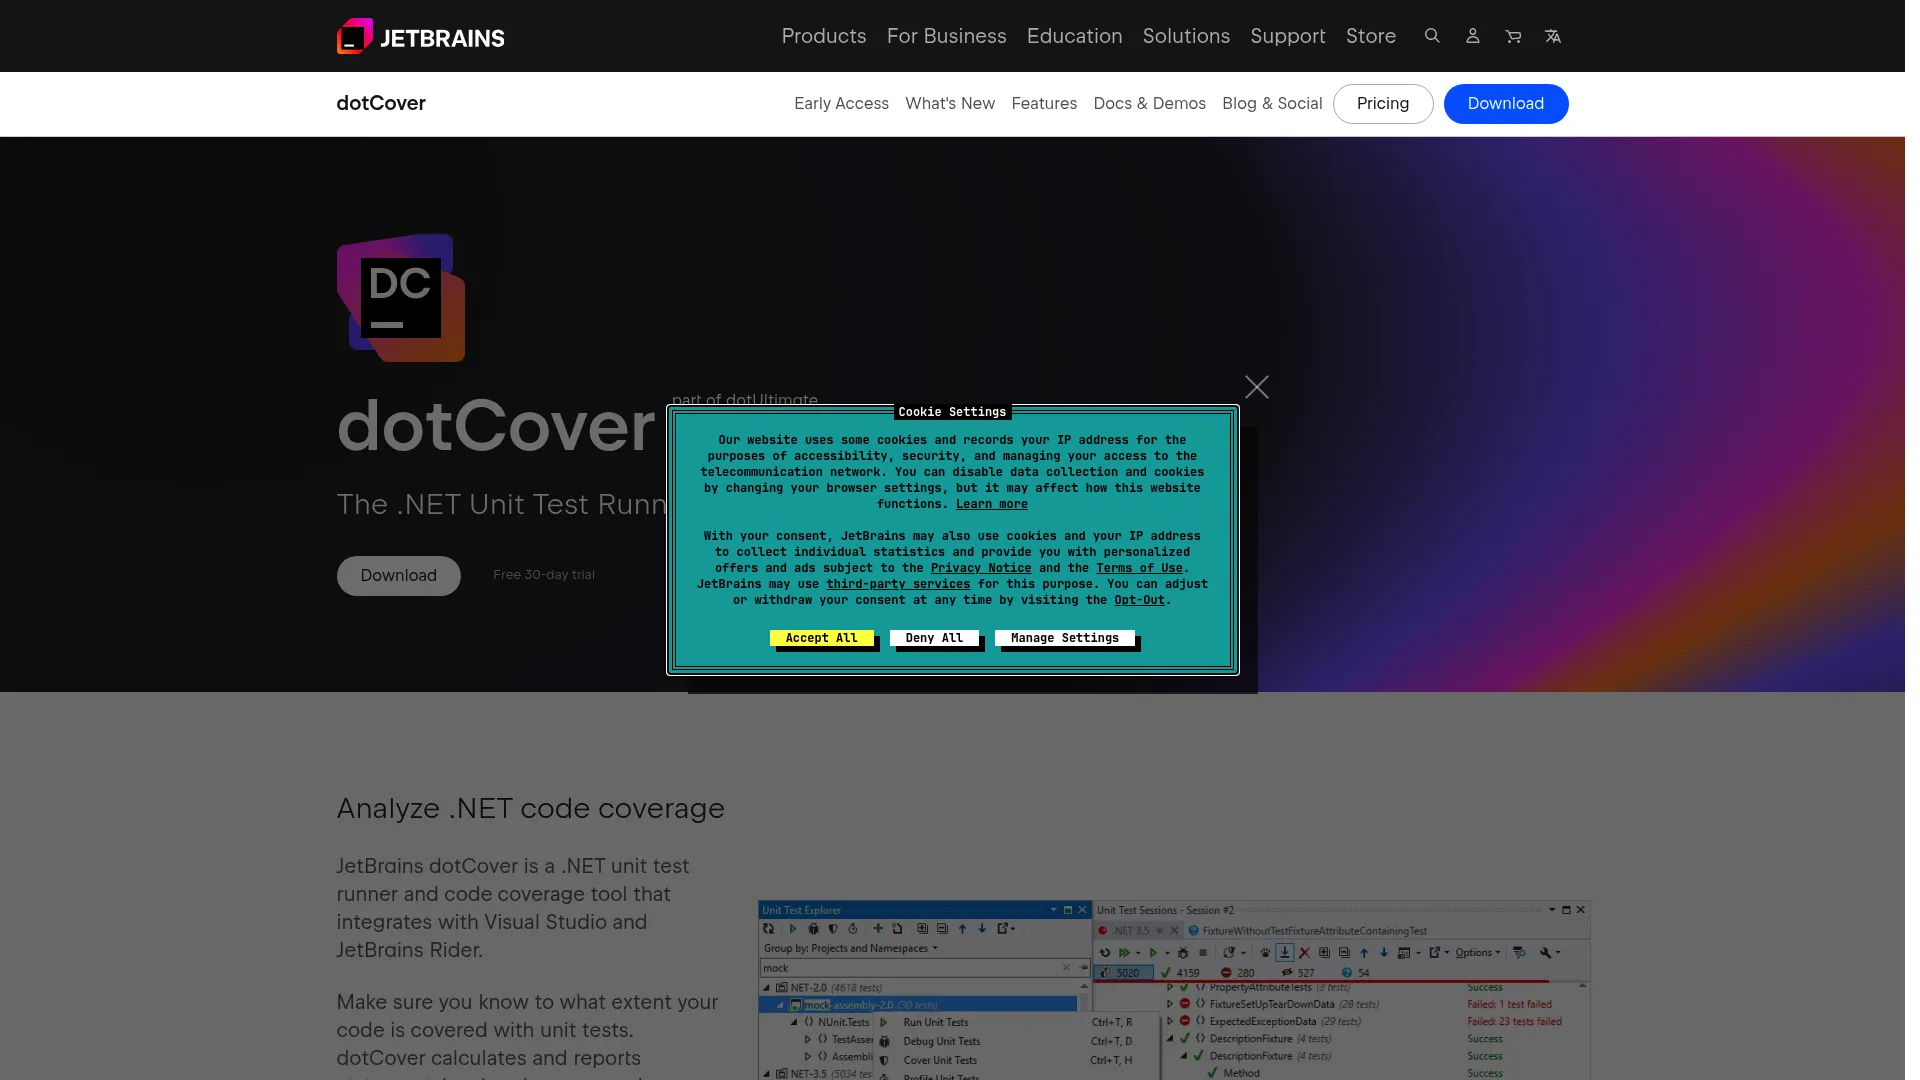
dotCover is JetBrains' .NET unit test runner and code coverage tool, built for developers who live inside Visual Studio or Rider. It gives you statement-level coverage and continuous testing directly in the IDE, so you can see which lines your tests cover and rerun affected tests as you edit, without leaving your editor.
The draw is the developer-centric experience. Where a CLI tool like Coverlet fits pipelines, dotCover fits the daily inner loop, with coverage highlighting in the editor and integration into the JetBrains toolchain. Teams already invested in Rider or ReSharper often prefer it for the tight, in-IDE feedback.
Best for: .NET teams that want rich in-IDE coverage and continuous testing inside Visual Studio or Rider.
Key strengths
- In-IDE integration: Coverage highlighting and test running inside Visual Studio and Rider.
- Statement-level coverage: Fine-grained .NET coverage detail.
- Continuous testing: Reruns affected tests automatically as you edit.
Why choose dotCover: If your team already uses JetBrains tools and values coverage feedback while writing code rather than only in CI, dotCover is the natural pick. It complements, rather than replaces, a CLI tool for pipeline coverage.
dotCover pricing: dotCover is licensed as part of the dotUltimate pack, which starts at $609 per user per year, or the All Products Pack at $979 per user per year. It is not sold as a standalone plan. dotCover holds a 4.1 out of 5 rating on G2.
9. Kover
Kover is Kotlin's own code coverage tool for Gradle, maintained within the Kotlin ecosystem. Kotlin teams reach for it because generic JVM wrappers do not always handle Kotlin-specific constructs cleanly, and Kover is designed with Kotlin in mind while still supporting mixed Kotlin and Java codebases.
For Android and JVM projects, it slots into Gradle builds as a plugin and works with IntelliJ and JaCoCo Kotlin coverage agents under the hood. It is configuration-cache compatible, which keeps Gradle builds fast. That native fit is why Kotlin teams often prefer it over a generic coverage wrapper.
Best for: Kotlin teams, especially in the Android and JVM ecosystem, that want native coverage in Gradle builds.
Key strengths
- Gradle plugin: Native Kotlin coverage integrated into the Gradle build.
- Agent compatibility: Works with IntelliJ and JaCoCo Kotlin coverage agents.
- Configuration cache compatible: Keeps Gradle builds fast and cache-friendly.
Why choose Kover: Kotlin teams that want coverage tuned to the language, rather than adapted from a Java tool, land on Kover. It is the natural default for Kotlin-first and Android projects using Gradle.
Kover pricing: Kover is an open-source Gradle plugin with no public pricing or paid tiers.
10. Clover
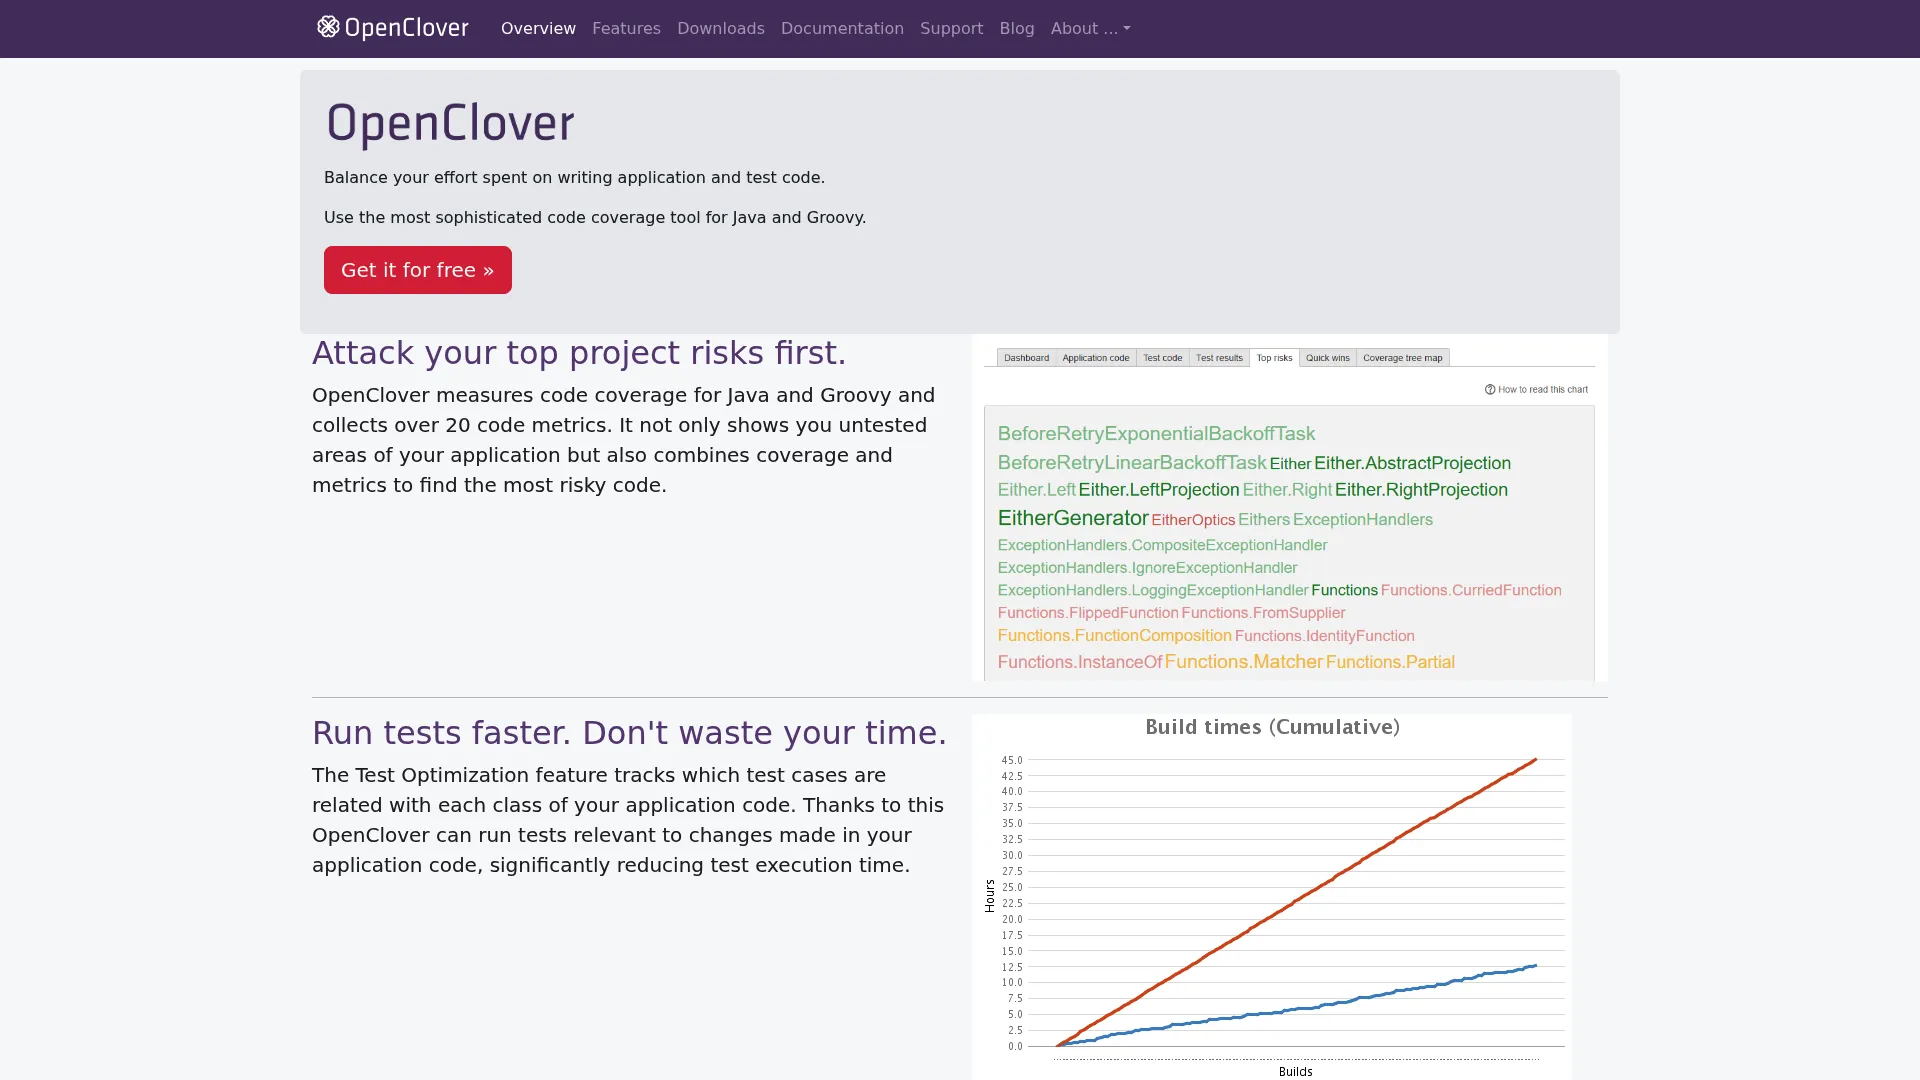
Clover, now maintained as OpenClover, is a code coverage and test optimization tool for Java, Groovy, and AspectJ. It played a significant historical role in the Java coverage world, and it still turns up in legacy and mixed environments where teams standardized on it years ago and never had a reason to switch.
Its distinguishing feature is per-test coverage and test optimization, which can identify and reorder or skip tests based on what changed. It generates reports in HTML, XML, PDF, JSON, and text. In many modern stacks JaCoCo is the more common starting point, but Clover remains relevant for teams with existing Groovy or AspectJ coverage needs and established Clover setups.
Best for: Java and Groovy teams maintaining legacy or mixed environments that need per-test coverage and optimization.
Key strengths
- Multi-language coverage: Java, Groovy, and AspectJ support in one tool.
- Per-test coverage: Ties coverage back to individual tests for optimization.
- Rich report formats: HTML, XML, PDF, JSON, and text output.
Why choose Clover: If you already run Clover, or you need Groovy and AspectJ coverage plus test optimization in one place, it earns its keep. New Java projects more often start with JaCoCo, but Clover holds its ground in established setups.
Clover pricing: OpenClover is free and open source. The official site offers it at no cost, with no public paid tiers.
11. pytest-cov
pytest-cov is a pytest plugin that adds coverage measurement and reporting directly to your test runs. If your team already uses pytest, this is the lightest way to get coverage: it wraps Coverage.py, so you get the same accurate measurement with a single flag on your pytest command. No separate coverage step, no extra orchestration.
It handles the practical details that trip up unit test coverage in real pipelines. pytest-cov automatically erases and combines .coverage files, supports coverage contexts with --cov-context=test, and works with xdist for distributed testing, so coverage stays correct even when tests run in parallel across workers.
Best for: Python teams already using pytest who want coverage folded into existing test runs with minimal setup.
Key strengths
- pytest-native: Adds coverage to test runs with a single command flag.
- Distributed test support: Works with xdist for parallel test execution.
- Coverage contexts: Tracks which test covered which lines via
--cov-context=test.
Why choose pytest-cov: When pytest is already your test runner, pytest-cov is the path of least resistance to coverage in CI. It gives you Coverage.py accuracy inside the workflow you already run.
pytest-cov pricing: pytest-cov is free and open source under the MIT license, installable via pip with no paid tiers.
12. gcovr
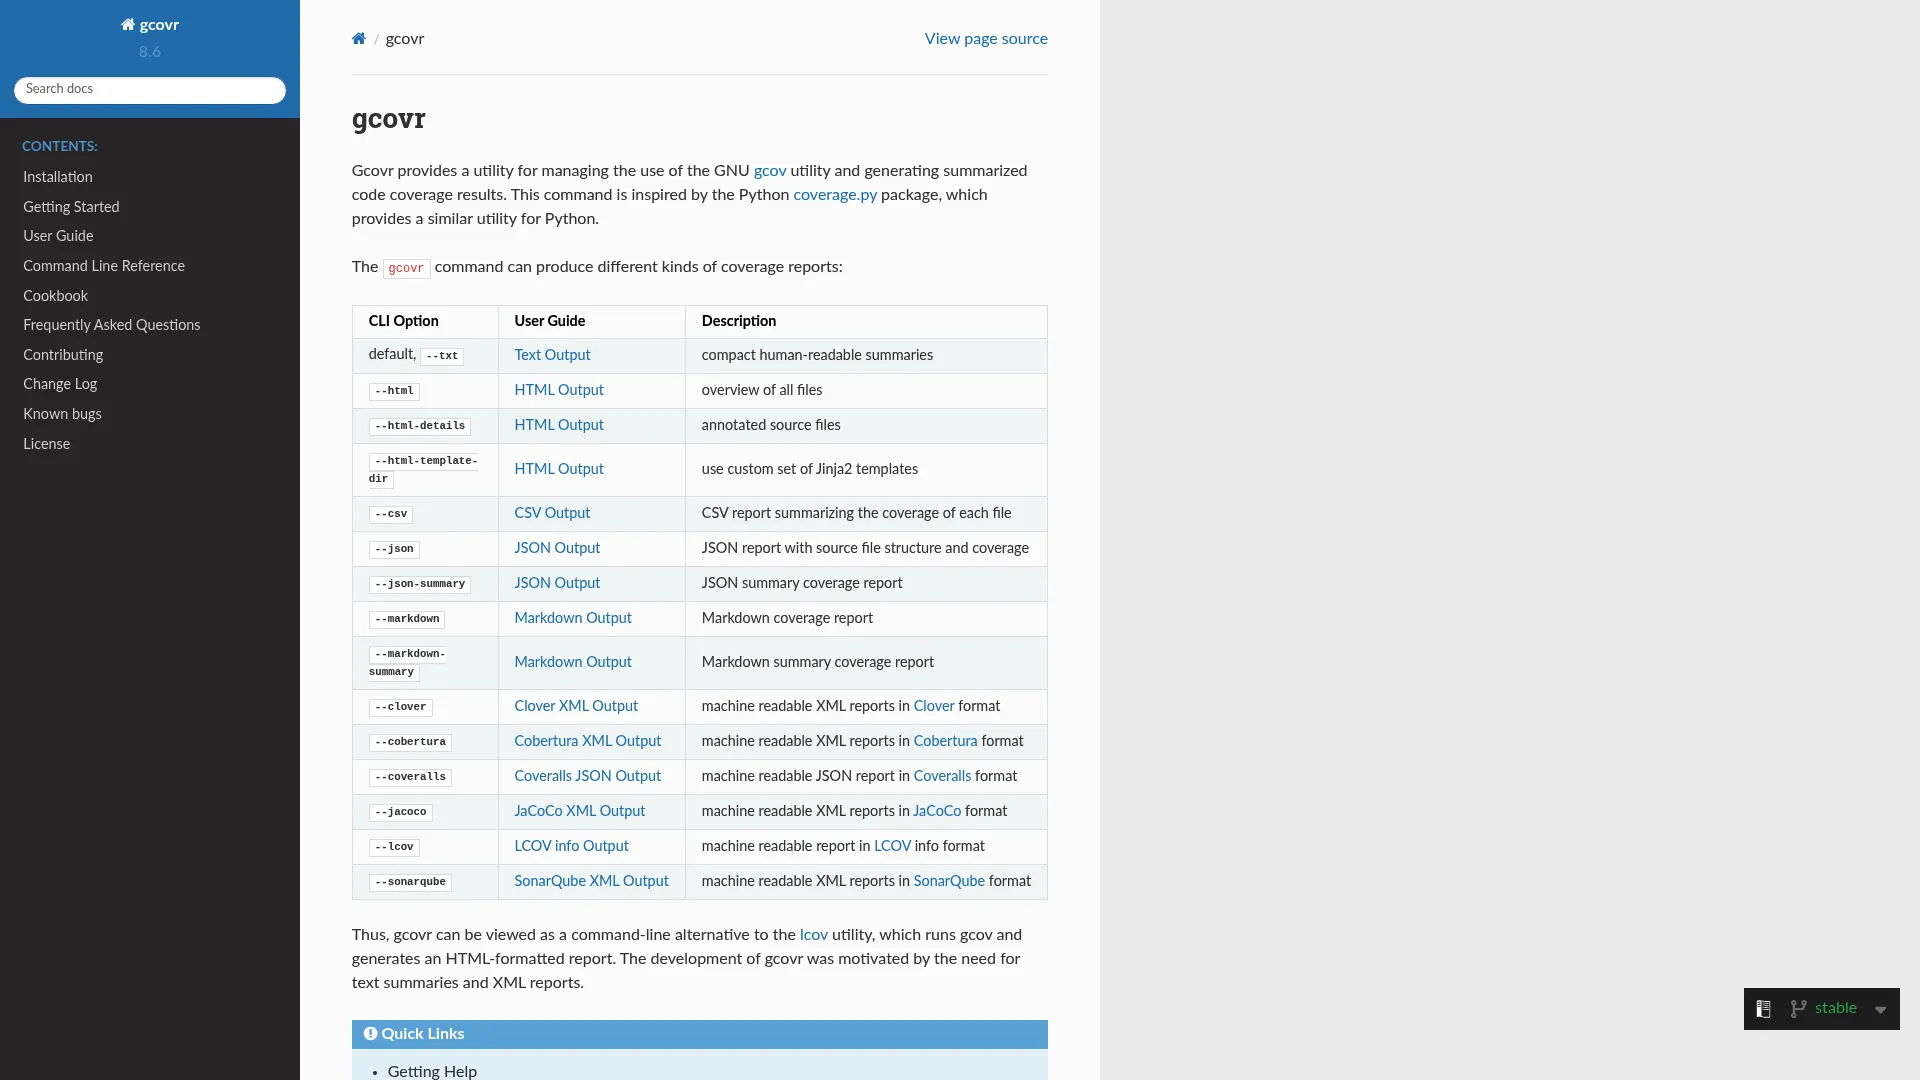
gcovr is a command-line coverage report generator for C and C++ projects built with GCC. It reads the raw gcov output that the compiler produces and turns it into readable, shareable reports, which is exactly what systems and embedded teams need when working with compiler-based coverage. It fits naturally into command-line and CI workflows.
Its strength is report generation breadth. gcovr produces text, HTML, CSV, JSON, Markdown, and XML reports, including annotated source-file HTML that shows exactly which lines were hit. It supports filters, configuration files, and reproducible timestamps, which matters for teams that need deterministic, comparable coverage output in CI.
Best for: C and C++ teams using GCC and gcov that need clean, multi-format coverage reports.
Key strengths
- Multi-format reports: Text, HTML, CSV, JSON, Markdown, and XML output.
- Annotated source reports: HTML that highlights covered and missed lines per file.
- CI-friendly configuration: Filters, config files, and reproducible timestamps.
Why choose gcovr: For compiler-based C/C++ coverage, gcovr turns raw gcov data into something a team can actually read and track. It is the standard command-line reporting layer for GCC-based projects.
gcovr pricing: gcovr is free and open source. There is no public pricing page or paid tier.
Considerations before you choose
A coverage tool is only useful if it fits how your team actually ships. Run through this checklist before committing.
Language and stack fit
Start with native support for your primary language. A Java shop wants JaCoCo, a Python team wants Coverage.py or pytest-cov, a .NET team wants Coverlet or dotCover. Polyglot teams should pick a reporting layer that ingests coverage from all their languages. Accurate instrumentation beats a slick dashboard every time.
CI/CD and pull request workflow
Decide where coverage should show up. If you want coverage to influence code review, prioritize tools that post PR comments and status checks, like Codecov, Coveralls, or SonarQube Cloud. Confirm the tool integrates with your specific CI service and can gate merges on changed code, not just the whole repo.
Reporting depth and formats
Check which coverage metrics you get. Line coverage alone is thin; branch and condition coverage tell you more about untested decision paths. Also confirm the report formats you need, such as Cobertura or LCOV, so results flow into your reporting layer without custom glue.
Thresholds and quality gates
Think about how you will set coverage thresholds. Blanket 80% targets across an entire codebase tend to backfire. Gating on new or changed code, with a sensible floor, keeps the pressure on quality where it belongs without punishing teams for legacy debt.
Cost and licensing
Most language-native tools are free and open source, which covers a lot of teams. Hosted services charge by user or by repo, so match the pricing model to how you are organized. A per-repo model like Coveralls suits large teams; a per-user model like Codecov suits smaller ones.
Conclusion
Coverage is a workflow decision, not a leaderboard. The 12 tools here sort cleanly by job. Codecov is the pick when you want coverage, test analytics, and flaky test intelligence living inside every pull request across languages. JaCoCo and Coverage.py are the language-native fundamentals for Java and Python, with Istanbul / NYC, Coverlet, dotCover, Kover, Clover, pytest-cov, and gcovr covering JavaScript, .NET, Kotlin, legacy Java, and C/C++.
For centralized reporting and history, Coveralls gives you simple per-repo tracking, and SonarQube Cloud folds coverage into broader quality and security gates.
The practical path is simple. Start with the language-native tool that produces accurate measurement, then add a workflow layer like Codecov, Coveralls, or SonarQube Cloud when you need pull request feedback or cross-team visibility. Gate on changed code, keep your assertions strong, and treat the percentage as a floor for confidence rather than a trophy. Pick the tool that fits your stack and your CI, and let the number do a job instead of just looking good in a slide.
FAQs
Code coverage measures which lines, branches, or functions of your source code were executed while your tests ran. It tells you what was exercised, not whether the tests were strong. A high number with weak assertions still leaves real risk, so treat coverage as a signal about untested paths, not proof of test quality.
Eighty percent is a common starting benchmark, not a rule. Research across 47 projects found real-world coverage often sits around 74 to 76%, per LaunchDarkly. The right target depends on how critical the code is, your stack, and your risk tolerance. Gating on new or changed code usually beats enforcing one blanket number everywhere.
Line coverage counts which lines of code executed at least once. Branch coverage checks whether each decision path was taken, including both sides of an if statement. Branch coverage is the stronger signal, because a single line can contain multiple untested paths that line coverage would happily report as covered.
JaCoCo is the default starting point for most Java and JVM teams. It instruments bytecode on the fly, reports instructions, branches, lines, methods, and complexity, and integrates cleanly with Maven, Gradle, and CI. Many teams pair it with a hosted layer like Codecov or Coveralls for coverage history and pull request feedback.
Coverage.py is the standard for Python code coverage, and most other Python tools wrap it. If you already use pytest, pytest-cov gives you the same accurate measurement with a single command flag. Both handle line and branch coverage and export reports in formats that feed hosted reporting services.
No. Coverage tools tell you what code ran during tests, not whether the tests would catch a bug. You can execute a line without asserting anything meaningful about its behavior. Assertion quality is what makes a test valuable, so use coverage to find gaps, then make sure the tests filling them actually check outcomes.
Coverage gates are useful when tied to changed code or a meaningful threshold. Blocking a merge because overall coverage dipped tends to punish teams for old debt. A better pattern is gating on the coverage of the lines a pull request touches, using tools like Codecov or SonarQube Cloud that post the delta directly in the PR.
Presales and sales engineers do not own coverage, but they field buyer questions about release confidence and security diligence. Knowing that coverage measures executed paths, that gates can enforce quality on changed code, and that the number is a floor rather than proof lets you support technical validation credibly instead of hand-waving through it.


.avif)