

Your Kubernetes footprint expanded. Your cloud spend climbed. Your incident channel got noisier, and the old host dashboard stopped telling you where performance was actually breaking. The question shifted from "do we need monitoring?" to "which platform can keep up with what we're running?"
The cloud monitoring market reached $3.6 billion in 2025 and is projected to hit $17.1 billion by 2033, according to Grand View Research (2026). Yet Grafana Labs' 2025 State of Observability report found that organizations use an average of eight observability technologies simultaneously. More tools, more gaps, more time spent stitching alerts together instead of resolving incidents.
This guide cuts through that noise. It covers 15 cloud infrastructure monitoring tools evaluated across deployment model, telemetry depth, Kubernetes coverage, and pricing behavior so you can build a shorter, sharper shortlist.
What's inside
This guide compares 15 cloud infrastructure monitoring tools for 2026, selected for DevOps, platform engineering, IT operations, and presales teams supporting technical validation and POC work.
- Coverage: Cloud, hybrid, Kubernetes, servers, networks, storage, and databases
- Telemetry depth: Metrics, logs, traces, events, alerts, and dashboards
- Deployment model: SaaS, open-source, self-hosted, and native cloud tools
- Buying fit: Cost behavior, implementation effort, integrations, and enterprise governance
Tools were chosen based on repeated SERP coverage, category fit, deployment model diversity, and buyer relevance. Pricing and G2 ratings were verified against live vendor pages and G2 listings before publication.
TL;DR
- Best overall SaaS observability platform: Datadog for teams that want infrastructure, APM, logs, security, and cloud monitoring under one commercial platform
- Best for enterprise root cause analysis: Dynatrace for large hybrid and multi-cloud teams that need AI-assisted problem detection at scale
- Best for usage-based full-stack monitoring: New Relic for teams that want broad telemetry with a free tier and consolidated observability
- Best open-source metrics backbone: Prometheus for Kubernetes-native teams with engineering capacity to operate their own stack
- Best native cloud starting points: Amazon CloudWatch, Azure Monitor, and Google Cloud Monitoring for teams staying inside a single provider's environment
What is cloud infrastructure monitoring software?
Cloud infrastructure monitoring software tracks the health, performance, availability, and dependencies of cloud, hybrid, and on-prem infrastructure using telemetry such as metrics, logs, traces, events, alerts, and topology data.
What it monitors:
- Compute hosts and virtual machines
- Containers and Kubernetes clusters
- Cloud services (IaaS, PaaS, and serverless functions)
- Networks, load balancers, and storage
- Databases and message queues
- Edge systems and on-prem servers
What it collects:
- Metrics: Counters, gauges, histograms
- Logs: Structured and unstructured event streams
- Traces: Distributed request paths across services
- Events: State changes, deployments, configuration drifts
- Topology: Service maps, dependency graphs
What it helps teams do:
- Detect outages and degraded services before customers report them
- Find root cause across multi-layer, multi-cloud environments
- Reduce alert noise through correlation and anomaly detection
- Measure service health against SLOs
- Validate POC success criteria during technical evaluations
- Prove operational readiness to procurement and security reviewers
Core features to evaluate:
- Infrastructure discovery and auto-instrumentation
- Dashboards, visualization, and alerting rules
- Cloud and Kubernetes integrations
- Logs, metrics, traces, and event correlation
- Anomaly detection and alert correlation
- Topology and dependency mapping
- Retention, reporting, and compliance controls
- APIs, webhooks, and incident tool integrations
Adjacent categories overlap here. Application performance monitoring tools focus on code-level latency, while API monitoring tools target endpoint health. Cloud infrastructure monitoring sits a layer below both, tracking the compute, network, and storage that everything else runs on.
When to use cloud infrastructure monitoring tools
Validate cloud health before incidents reach customers
Cloud monitoring should catch degraded hosts, saturated nodes, failed services, and latency spikes before your buyers or users notice. If your buyer is evaluating during a POC, the speed at which the tool surfaces a real signal is itself a proof point. Dashboards that are still empty after 30 minutes of setup lose evaluations.
Correlate infrastructure signals during incident response
Metrics alone stop being enough once your systems span Kubernetes, managed databases, queues, serverless functions, and third-party APIs. You need logs and traces correlated against the same timeline, dependency maps that show upstream and downstream impact, and alert correlation that suppresses noise while surfacing the actual cause.
Prove operational readiness across hybrid environments
Enterprise procurement, security review, and operational sign-off all require evidence of visibility across AWS, Azure, Google Cloud, on-prem servers, and containers. Teams supporting infrastructure software evaluations need monitoring that can demonstrate coverage across every environment the buyer already runs. AIOps tools often extend this layer with automated anomaly correlation and incident routing.
Cloud infrastructure monitoring tools comparison
Use this table as a starting point, not a substitute for a POC. Run at least two or three tools against the same success criteria before committing. Every pricing figure and G2 rating below was verified against live vendor pages and G2 listings.
| # | Product | Best for | Key differentiator | Pricing | G2 rating |
|---|---|---|---|---|---|
| 1 | Datadog | Cloud-native and multi-cloud SaaS observability | Broad infrastructure, APM, logs, security, and synthetics in one platform | From $15/host/month (annual) | 4.5/5 |
| 2 | Dynatrace | Enterprise hybrid and multi-cloud monitoring | AI-assisted root cause analysis and automated discovery | From $7/host/month (annual) | 4.5/5 |
| 3 | New Relic | Usage-based full-stack observability | Broad telemetry with a generous free tier | Free tier; from $10/month | 4.4/5 |
| 4 | Prometheus | Open-source Kubernetes metrics | Cloud-native pull-based metrics and PromQL | Free, open-source | 4.5/5 |
| 5 | Grafana Cloud | Managed open observability | Hosted Grafana, Loki, Tempo, and unified alerting | Free tier; from $19/month + usage | 4.5/5 |
| 6 | IBM Instana | Application and infrastructure dependency mapping | Automated discovery with 1-second monitoring granularity | From $0.03/MVS hour | 4.4/5 |
| 7 | Zabbix | Self-hosted open-source monitoring | Open-source core, free to deploy and operate | Free (Cloud from $50/month) | 4.3/5 |
| 8 | Checkmk | Hybrid IT infrastructure monitoring | 2,000+ integrations with rule-based auto-discovery | Free Community; Pro from €190/month | 4.7/5 |
| 9 | Nagios XI | Traditional IT infrastructure monitoring | Mature alerting with perpetual node-based licensing | Free (7 nodes); Standard from $2,595 | N/A on G2 |
| 10 | SolarWinds Observability | Hybrid infrastructure and network operations | Unified network, infra, log, and database observability | From $5/GB/month (log); $15.75/node/month (infra) | 4.3/5 |
| 11 | Splunk Observability Cloud | Log-heavy enterprise observability | OpenTelemetry-native with deep log, metric, and trace analytics | Free (up to 15 hosts); from $15/host/month | 4.3/5 |
| 12 | LogicMonitor | Agentless hybrid infrastructure monitoring | Automated discovery across 3,000+ integrations | From $16/Hybrid Unit/month | 4.5/5 |
| 13 | Amazon CloudWatch | AWS-native monitoring | Native AWS metrics, logs, alarms, and Container Insights | Usage-based; free tier includes 5 GB logs/month | 4.3/5 |
| 14 | Azure Monitor | Microsoft Azure-native monitoring | Native Azure telemetry with Log Analytics and Application Insights | Usage-based; platform metrics free | 4.3/5 |
| 15 | Google Cloud Monitoring | Google Cloud-native monitoring | Native GCP metrics, uptime checks, and Managed Prometheus | Usage-based; 150 MiB free/month | 4.2/5 |
Best 15 cloud infrastructure monitoring tools for 2026
The tools below are ordered by depth of coverage and general relevance to cloud-native and hybrid infrastructure teams. Each entry includes the presales and technical validation angle alongside standard feature and pricing information.
1. Datadog
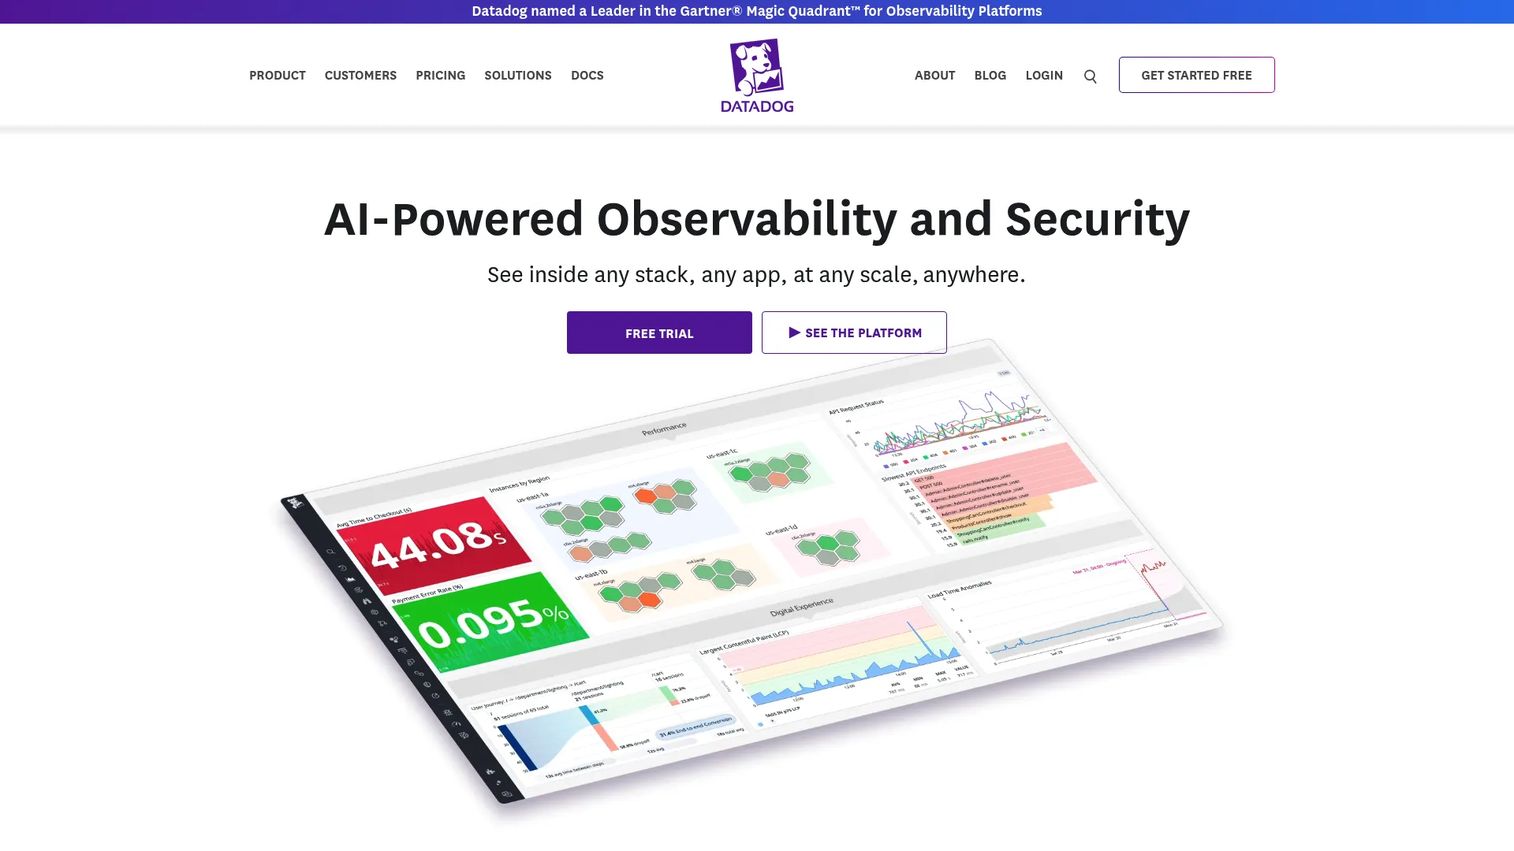
Datadog is a SaaS observability platform covering infrastructure monitoring, APM, distributed tracing, log management, synthetics, real user monitoring, cloud security, and network performance. It ships with 1,000+ integrations and OpenTelemetry support, so most environments connect without custom instrumentation. For presales teams supporting cloud-native buyers, Datadog's breadth means a single POC can demonstrate coverage across Kubernetes, multi-cloud, and legacy hosts simultaneously.
Best for: Cloud-native and multi-cloud engineering teams that want a single commercial SaaS platform spanning infrastructure, application, and security observability.
Key features
- Infrastructure host maps with live health visualization
- Kubernetes monitoring with cluster, namespace, and pod views
- Log management with pipeline parsing and anomaly detection
- APM and distributed tracing across 1,000+ integrations
- Watchdog AI anomaly detection for automatic surfacing of issues
Why choose Datadog: Choose it when the buyer wants one platform spanning the full engineering and operations stack without stitching together separate tools for logs, APM, and infrastructure. Cost modeling matters early: Pricing compounds across hosts, log volumes, container counts, and data retention.
Datadog pricing: Infrastructure Pro starts at $15 per host per month, billed annually ($18 on-demand). Enterprise runs $23 per host per month annually ($27 on-demand). Each product (APM, logs, synthetics) is priced separately.
G2 rating: 4.5/5
2. Dynatrace
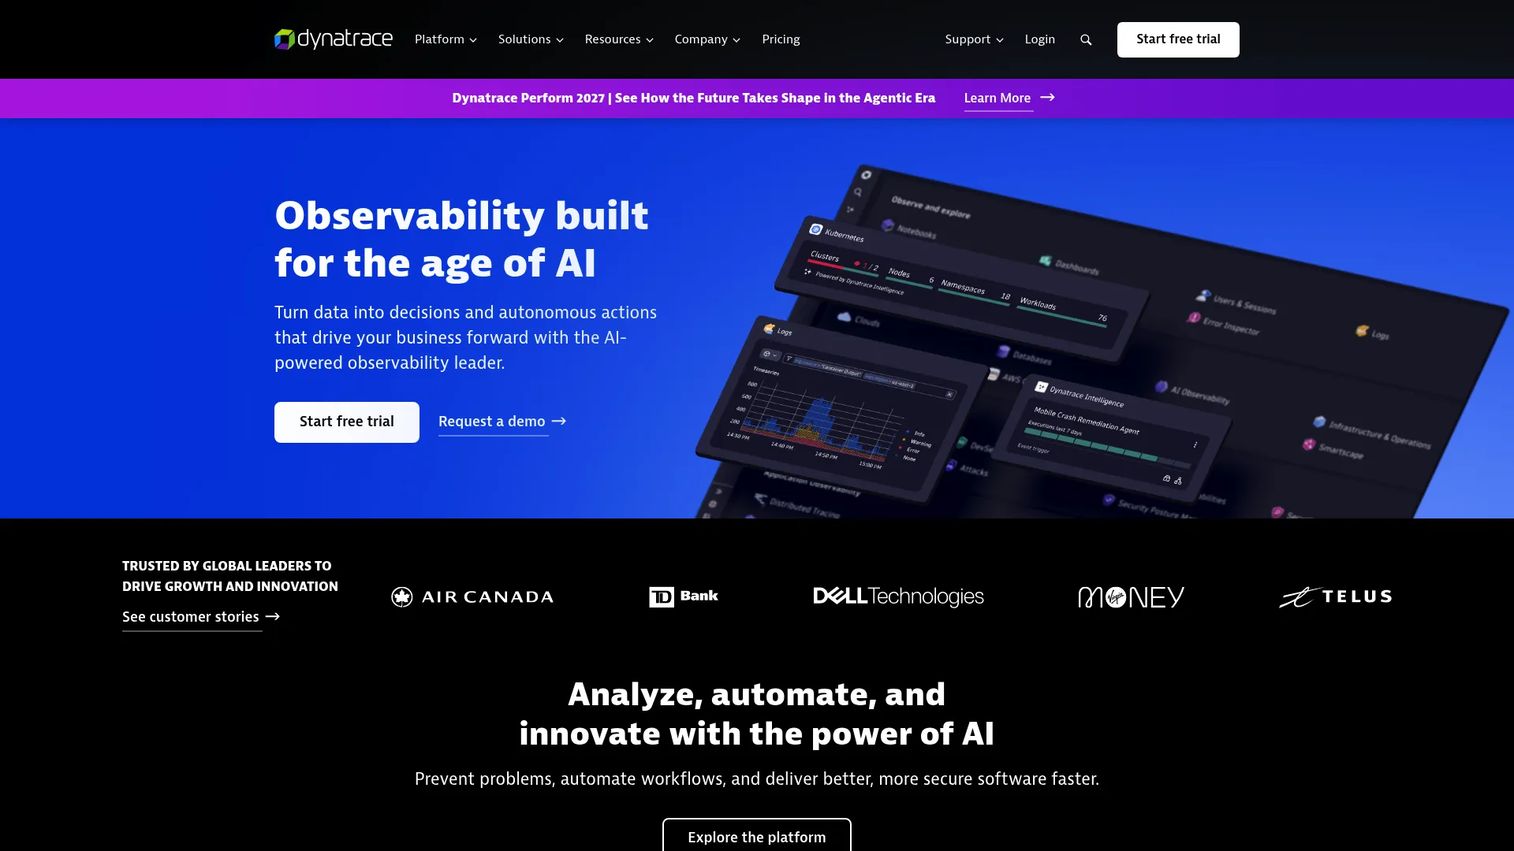
Dynatrace is an enterprise observability platform built around automated discovery, AI-assisted root cause analysis, and Smartscape topology. OneAgent deploys across hosts, containers, and cloud services and begins mapping dependencies automatically. Davis AI continuously analyzes telemetry to surface precise problem statements rather than raw alert floods. For enterprise hybrid evaluations, Dynatrace's automated context across services and infrastructure shortens the time from "something is wrong" to "here is the cause."
Best for: Large enterprises with complex hybrid or multi-cloud environments that need automated dependency mapping and AI-driven incident diagnosis.
Key features
- OneAgent auto-instrumentation across hosts, containers, and cloud
- Davis AI for root cause analysis and autonomous operations
- Smartscape real-time topology and dependency maps
- Kubernetes observability at cluster, node, pod, and container level
- Digital experience monitoring with session replay and synthetic checks
Why choose Dynatrace: Strongest when the buyer's environment spans many services, multiple cloud providers, and on-prem systems where alert correlation by hand is impractical. A 15-day free trial is available. Teams with simpler environments may find the platform's depth more than they need initially.
Dynatrace pricing: Foundation and Discovery starts at $7 per host per month (billed hourly at $0.01). Infrastructure Monitoring is $29 per host per month. Full-Stack Monitoring runs $58 per 8-GiB host per month. Kubernetes Platform Monitoring is $1.40 per pod per month. A 15-day free trial is available.
G2 rating: 4.5/5
3. New Relic
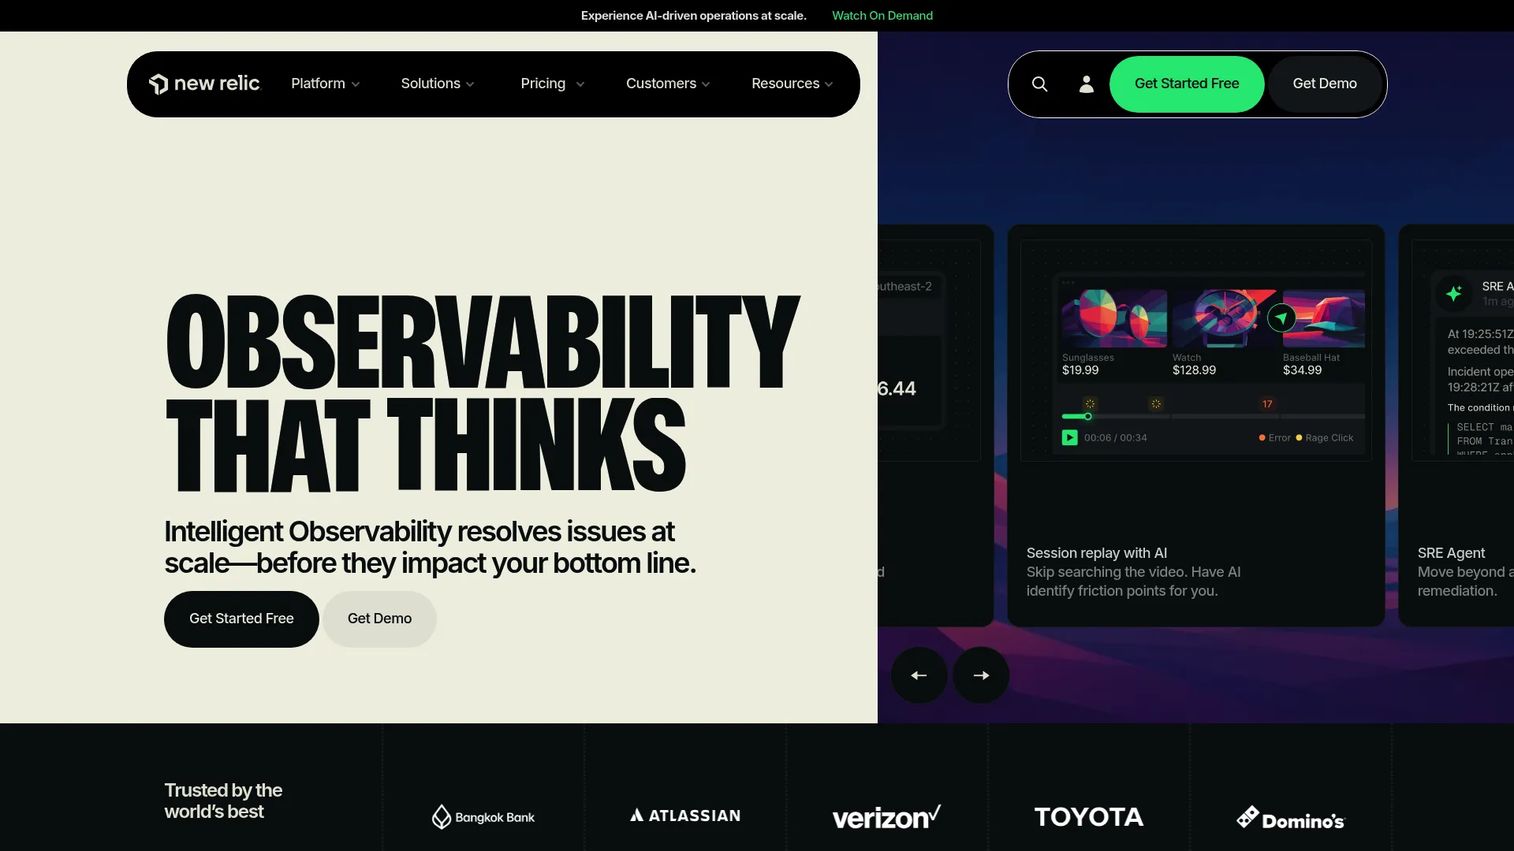
New Relic is a full-stack observability platform with infrastructure monitoring, APM, browser monitoring, mobile, synthetics, log management, and Kubernetes explorer. Pricing is usage-based, combining data ingest and user seats rather than fixed module bundles. The free tier includes one full platform user and 100 GB of monthly data ingest, making it practical for initial POC coverage before committing budget.
Best for: Engineering and DevOps teams that want broad telemetry across many product areas without buying separate modules at the start.
Key features
- Infrastructure monitoring for hosts, containers, and cloud services
- APM with distributed tracing and error analytics
- Log management with live-tail querying
- Kubernetes explorer with cluster, node, and workload views
- NRQL custom query language for flexible data exploration
Why choose New Relic: Fits teams that want many telemetry types in one product and need usage-based pricing that scales with actual consumption. The free tier is genuinely capable for a structured POC against a bounded environment.
New Relic pricing: Free tier at $0 includes one full platform user and 100 GB monthly ingest. Standard plan starts at $10 per month for the first full platform user (pay-as-you-go). Pro is $349 per full platform user per month, billed annually upfront. Enterprise pricing requires contacting sales.
G2 rating: 4.4/5
4. Prometheus
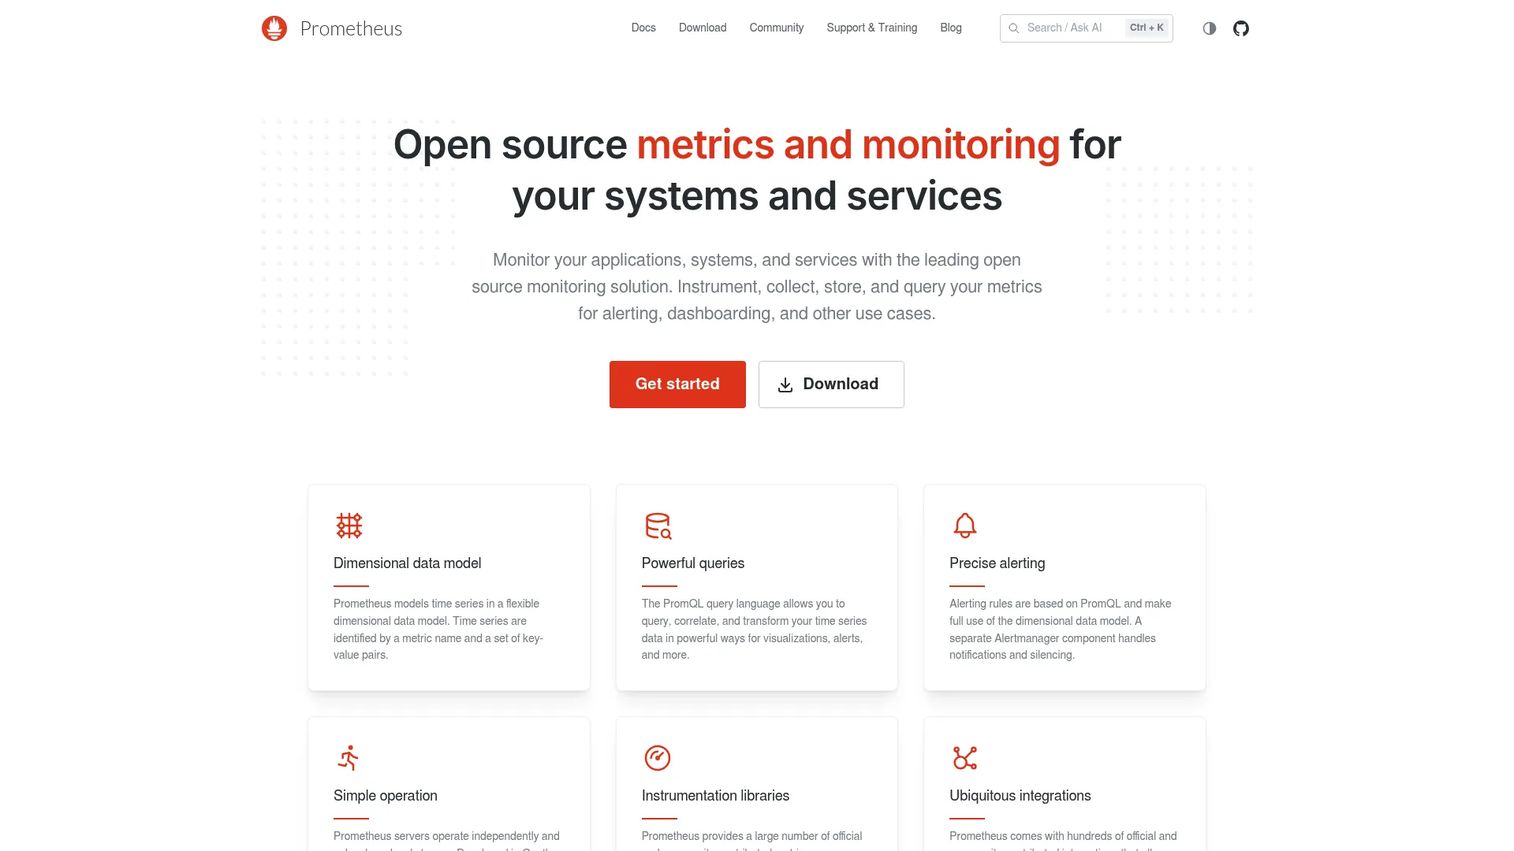
Prometheus is the open-source monitoring and alerting toolkit that became the de facto metrics standard for Kubernetes environments. It scrapes metrics from instrumented services and exporters using a pull model, stores them as time-series data, and surfaces them through PromQL. Alertmanager handles routing and deduplication. Prometheus does not ship with long-term storage or a built-in dashboard, so most deployments pair it with Grafana and a remote storage backend.
Best for: Engineering-led teams that can own their own metrics stack and want full control over retention, exporters, and query semantics.
Key features
- Pull-based metrics collection with configurable scrape intervals
- PromQL functional query language for flexible metric analysis
- Kubernetes exporters for cluster, node, and workload metrics
- Alertmanager integration for routing, grouping, and deduplication
- Large open-source exporter ecosystem covering hundreds of systems
Why choose Prometheus: Choose it when the team has the engineering capacity to operate and scale the stack. No license cost means the real expense is in storage, maintenance, on-call ownership, and eventual migration to long-term storage solutions. Teams evaluating open-source infrastructure observability often find business activity monitoring tools useful for adjacent operational data.
Prometheus pricing: Prometheus is free and open-source software. Operating costs come from infrastructure, storage, and engineering time, not license fees.
G2 rating: 4.5/5
5. Grafana Cloud
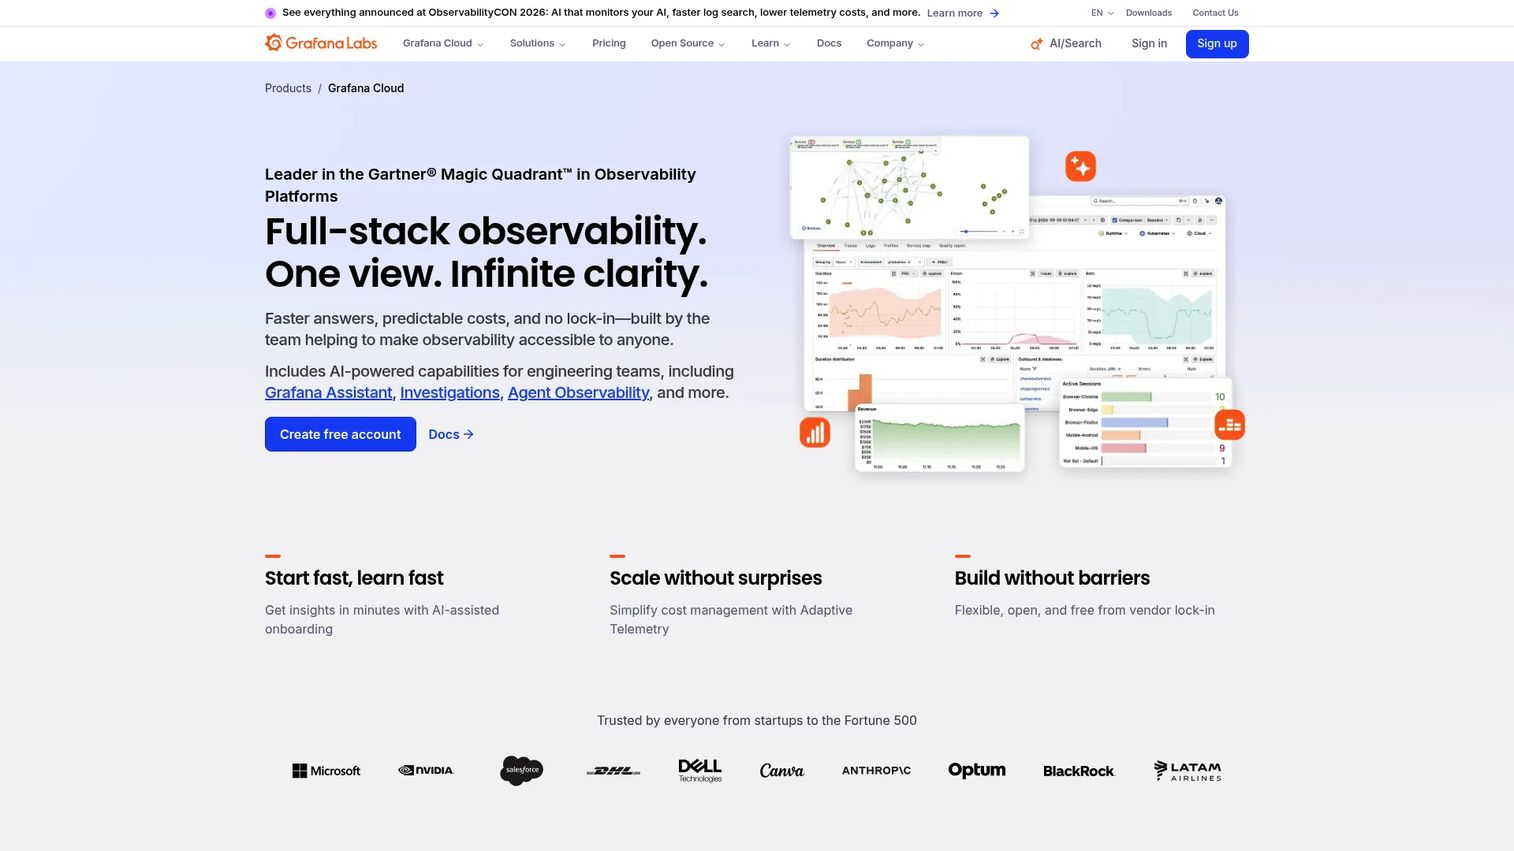
Grafana Cloud is a managed observability platform that hosts Grafana dashboards, Prometheus-compatible metrics (Mimir), Loki logs, Tempo traces, Pyroscope profiling, and unified alerting under one managed service. It uses OpenTelemetry natively and includes an AI assistant for incident investigation. Teams already running Grafana or Prometheus on-prem can migrate to the managed version without rebuilding their dashboards or alert rules.
Best for: Engineering teams that want managed open-standards observability without operating every backend component themselves.
Key features
- Managed Grafana dashboards with shared team workspaces
- Hosted Prometheus-compatible metrics via Mimir
- Loki log aggregation and querying
- Tempo distributed tracing
- Unified alerting with multi-channel notification routing
Why choose Grafana Cloud: Fits teams already invested in the Grafana ecosystem who want SaaS scale and reliability without managing Loki, Tempo, and Mimir clusters separately. The free tier is a real starting point, not a trial gate.
Grafana Cloud pricing: Free tier at $0 with usage-limited access. Pro starts at $19 per month plus usage-based charges for metrics, logs, traces, and users. Enterprise requires a $25,000 annual spend commitment.
G2 rating: 4.5/5
6. IBM Instana
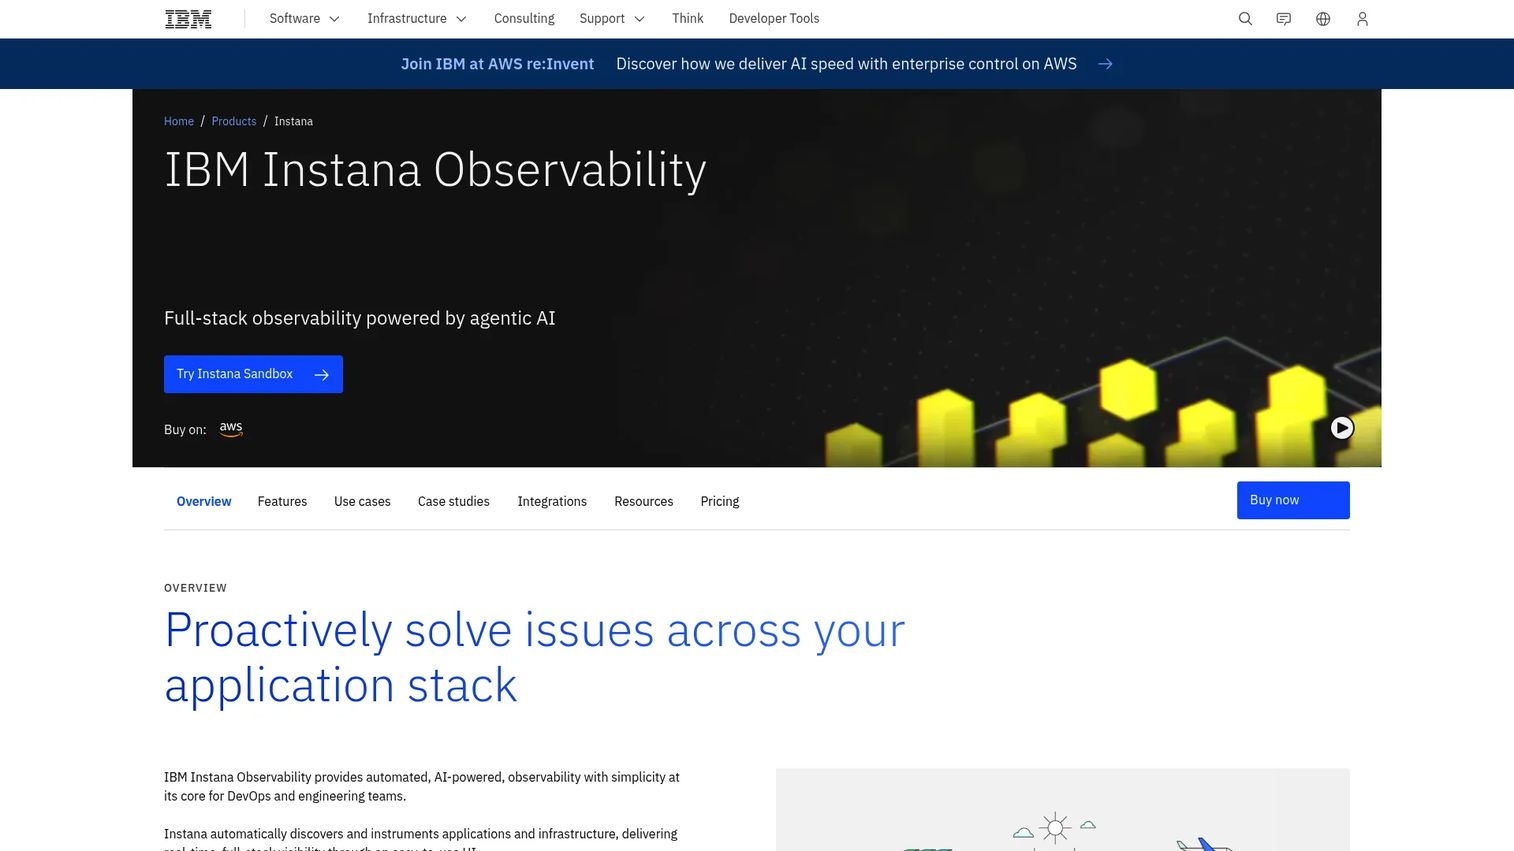
IBM Instana is an observability platform focused on automated discovery, real-time dependency mapping, application performance monitoring, and infrastructure context at one-second granularity. Agents deploy across hosts and containers and immediately begin mapping service relationships without manual configuration. For technical evaluations where buyers need to understand service-to-infrastructure dependencies quickly, Instana's automated context reduces POC setup time considerably.
Best for: DevOps and SRE teams evaluating infrastructure observability where fast automated discovery and application-to-infrastructure context are the primary requirements.
Key features
- Automated discovery and real-time dependency mapping
- 1-second monitoring granularity for infrastructure and applications
- Distributed tracing across microservices
- Root cause analysis with AI-powered incident investigation
- Infrastructure monitoring alongside application performance data
Why choose IBM Instana: Strong in POC scenarios where buyers want to see their environment mapped without manual configuration work. The IBM ecosystem integration also matters for enterprise buyers already running IBM infrastructure.
IBM Instana pricing: PayPerUse starts at $0.03 per MVS hour per month. SaaS starts at $21.20 per MVS per month. Self-hosted runs $385.20 per MVS per year. A 14-day free trial is available.
G2 rating: 4.4/5
7. Zabbix
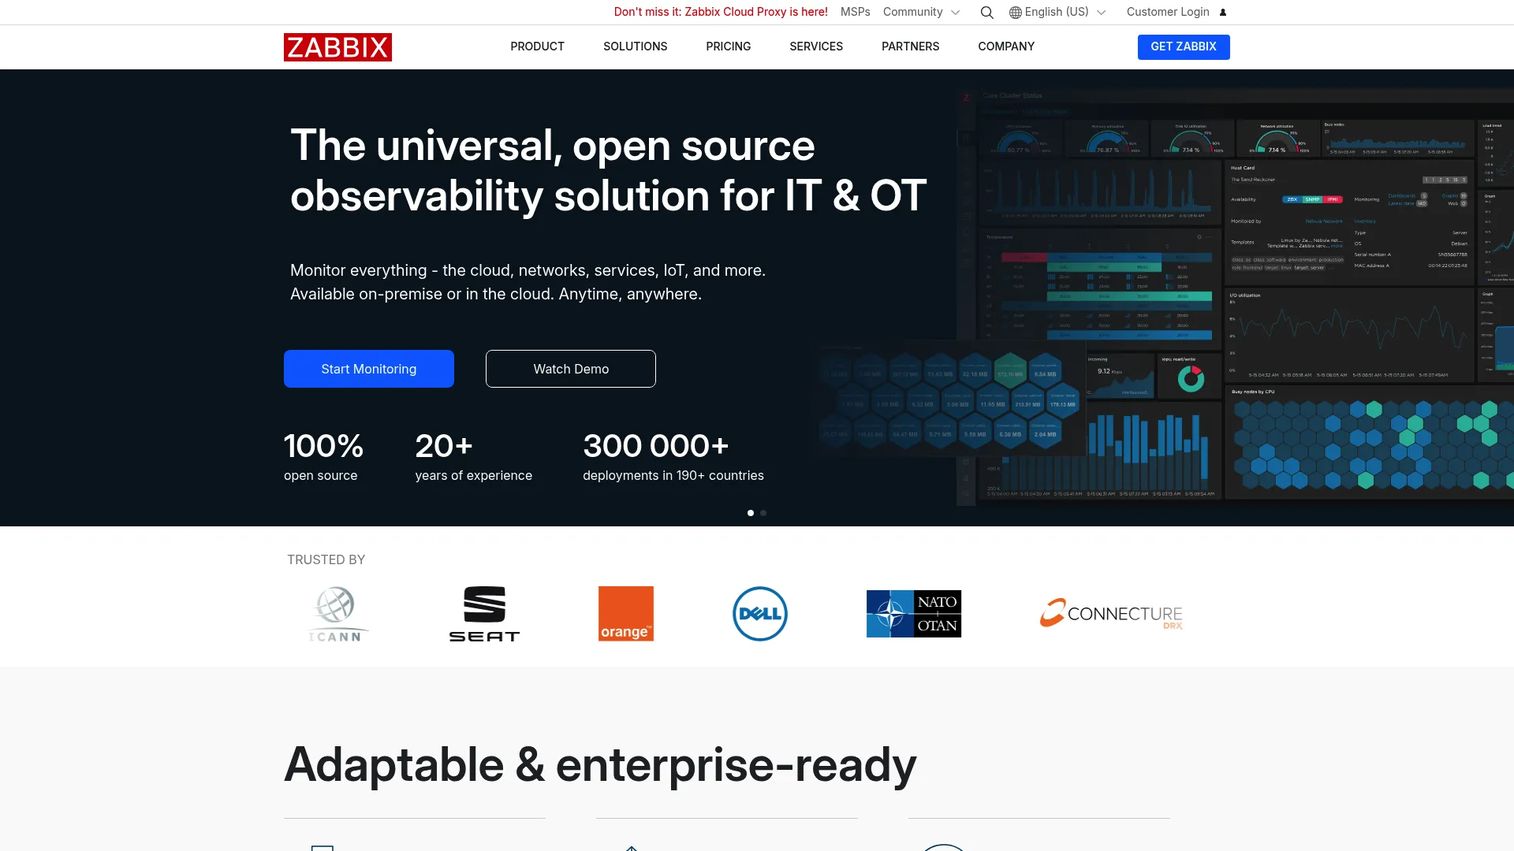
Zabbix is a mature open-source monitoring platform for servers, networks, virtual machines, applications, and cloud services. The software itself is free to download and operate. It supports SNMP, IPMI, JMX, agent-based, and agentless monitoring across thousands of hosts. A large template library covers common integrations without custom scripting, and the platform includes anomaly detection, trend prediction, and auto-remediation features that many teams expect from commercial tools.
Best for: Organizations that want self-hosted infrastructure monitoring at scale with no per-host license fee and strong internal operations capability.
Key features
- Agent-based and agentless monitoring across servers, VMs, networks, and cloud
- SNMP and IPMI support for network devices and hardware
- Template library with 1,000+ pre-built monitoring configurations
- Real-time anomaly detection and trend prediction
- Alerting, escalation workflows, and auto-remediation actions
Why choose Zabbix: Choose it when the team has strong internal operations skills, prefers to own its monitoring stack, and needs to cover a large and diverse infrastructure footprint without paying per host. The real cost is engineering time for setup, upgrades, and maintenance.
Zabbix pricing: Zabbix software is free and open-source. Zabbix Cloud starts at $50 per month for a hosted deployment. Support subscriptions (Silver from €245 per month, Gold from €660 per month, annual billing) add SLA-backed support and expert access.
G2 rating: 4.3/5
8. Checkmk
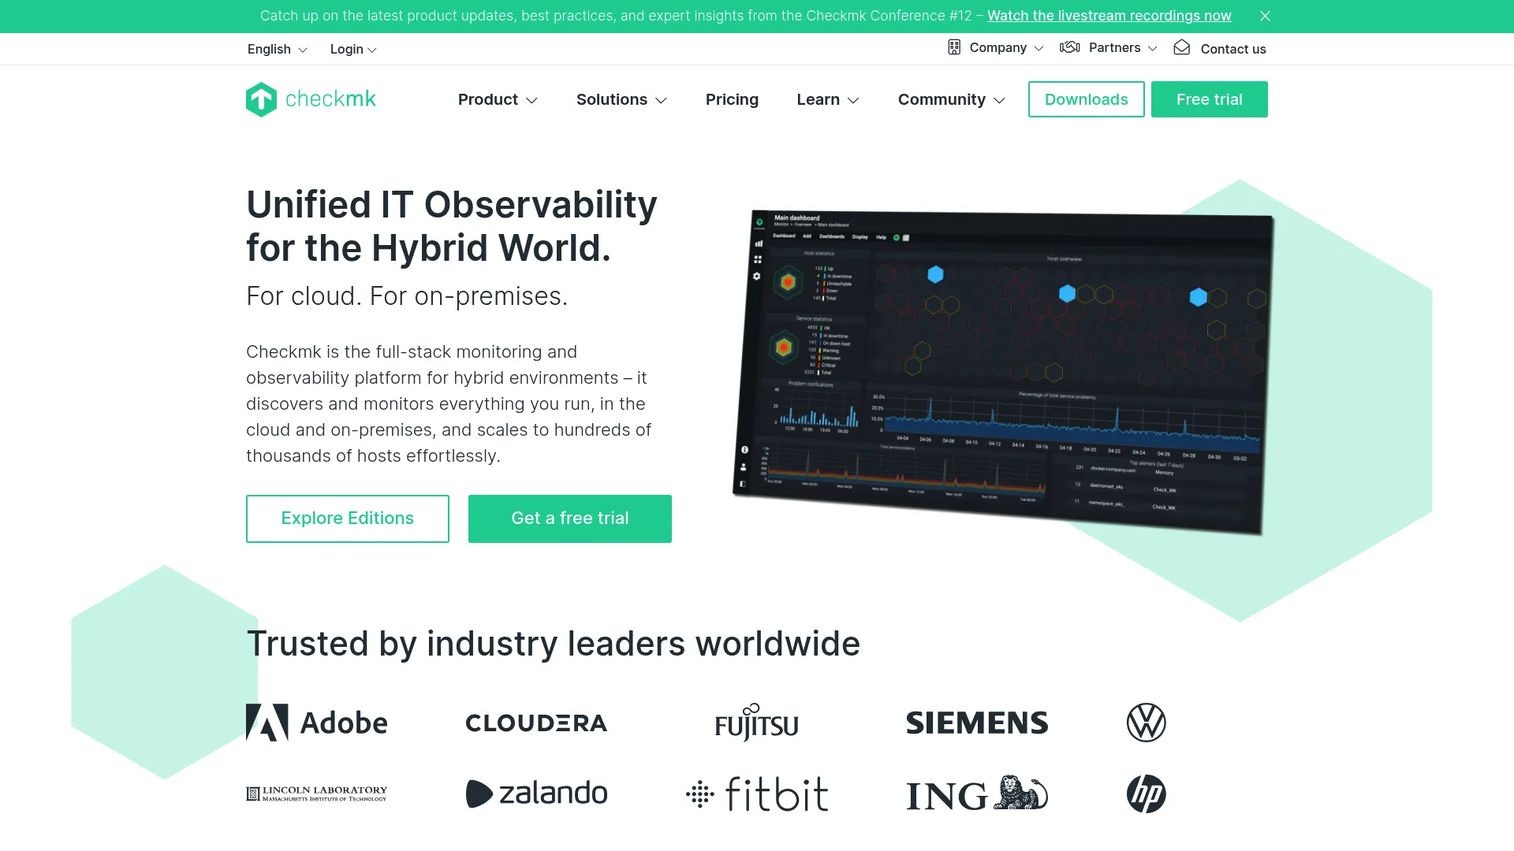
Checkmk is a hybrid IT monitoring platform with 2,000+ built-in integrations and automated host and service discovery. It monitors servers, networks, cloud workloads, Kubernetes clusters, applications, and user experience from one interface. Rule-based configuration reduces manual setup at scale, and a free Community edition covers teams that need a capable self-hosted monitor without a commercial license.
Best for: IT operations teams that manage mixed infrastructure, need strong host-level and network visibility, and want meaningful automation without rebuilding rules from scratch.
Key features
- 2,000+ integrations covering servers, networks, cloud, and containers
- Automated host and service discovery with rule-based configuration
- Agent-based and SNMP monitoring for diverse environments
- Kubernetes and container monitoring
- REST API and distributed monitoring for multi-site deployments
Why choose Checkmk: Good fit for IT operations teams moving away from older monitoring setups that require too much manual work. The Community edition gives a genuine free path for evaluation before committing to Pro or Ultimate.
Checkmk pricing: Community edition is free and open-source. Pro starts at €190 per month, billed annually. Ultimate starts at €275 per month, billed annually.
G2 rating: 4.7/5
9. Nagios XI
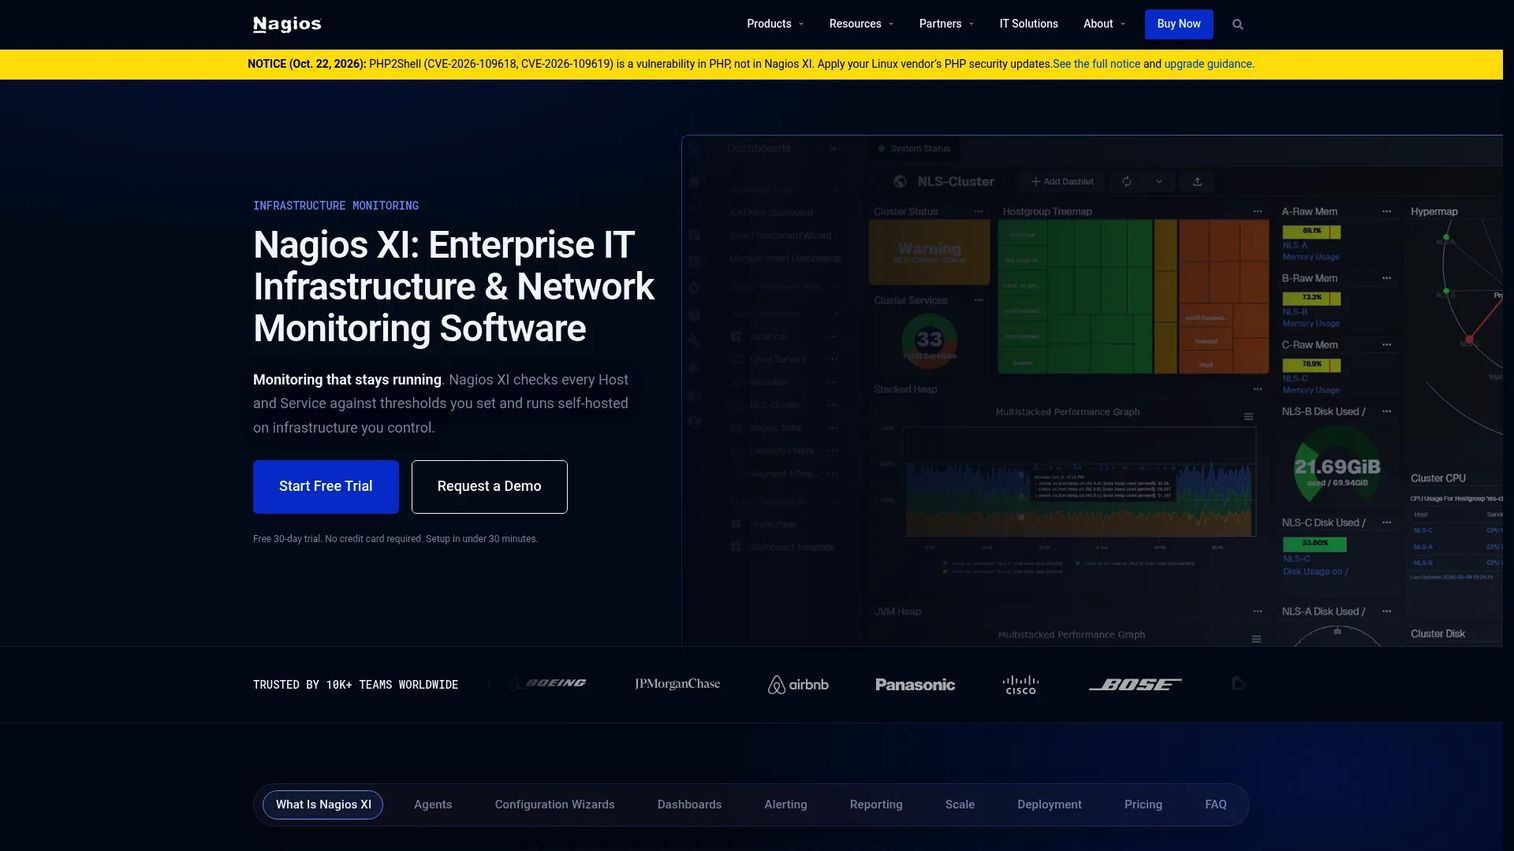
Nagios XI is a long-standing IT infrastructure monitoring product for servers, services, applications, and network devices. It uses a perpetual node-based license model, which differs significantly from the per-host SaaS subscriptions that dominate the commercial observability market. A plugin ecosystem with thousands of community-contributed checks covers most standard infrastructure components.
Best for: IT teams with traditional monitoring requirements, existing Nagios knowledge, and a preference for perpetual licensing over subscription pricing.
Key features
- Host and service monitoring for Linux, Windows, macOS, AIX, and network devices
- 90+ configuration wizards and auto-discovery
- Threshold-based alerting with escalation rules and notifications
- SLA reporting and scheduled capacity planning dashboards
- REST API for integration with external systems
Why choose Nagios XI: Works well for teams that value a mature plugin ecosystem and want predictable perpetual licensing rather than usage-based subscription costs. Cloud-native teams with Kubernetes-heavy environments may find the platform's telemetry correlation capabilities thinner than commercial observability platforms.
Nagios XI pricing: A free edition covers up to 7 nodes or 100 services. Standard is $2,595 for a perpetual 100-node license. Enterprise is $4,690 as an add-on to any XI license. Sitewide pricing with unlimited nodes requires contacting sales.
10. SolarWinds Observability
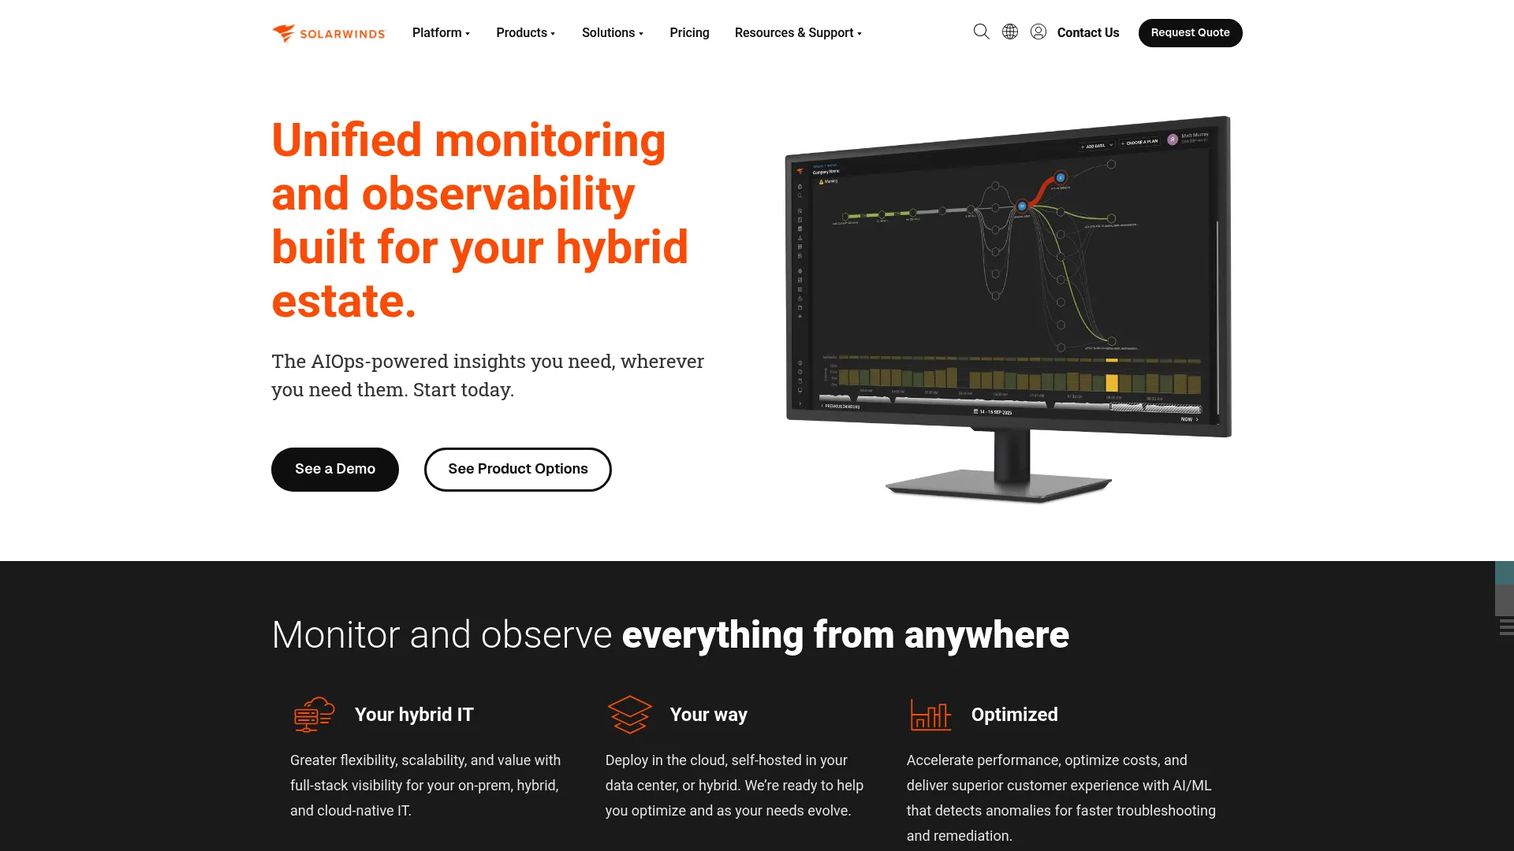
SolarWinds Observability is a hybrid observability and monitoring platform combining application, network, infrastructure, database, log, and digital experience monitoring under a unified interface. It ships with AIOps-backed anomaly detection and alert prioritization, along with service maps for understanding dependencies across hybrid environments. SolarWinds' heritage in network and infrastructure monitoring means network performance gets genuine depth rather than basic SNMP polling.
Best for: IT operations teams where network performance and infrastructure health are closely linked and need to be monitored together rather than in separate tools.
Key features
- Full-stack visibility across applications, networks, infrastructure, and databases
- Unified metrics, traces, logs, database queries, and user experience data
- AIOps anomaly detection and alert prioritization
- Service maps for dependency visualization across hybrid environments
- Log observability with search and analytics
Why choose SolarWinds Observability: Fits organizations where network performance is a first-class concern alongside infrastructure health. Multi-year contracts are the standard buying motion, so model total cost against projected node and log volume growth before committing.
SolarWinds Observability pricing: Network and Infrastructure Observability starts at $15.75 per node per month (multi-year contracts, billed annually). Log Observability starts at $5.00 per GB per month. Application Observability starts at $27.50 per service per month.
G2 rating: 4.3/5
11. Splunk Observability Cloud
Splunk Observability Cloud is an OpenTelemetry-native observability platform for infrastructure monitoring, APM, real user monitoring, synthetic monitoring, database monitoring, and log analytics. It correlates Splunk Platform log data with metrics and traces through Log Observer Connect, which matters for enterprises already running Splunk for security and IT operations. Free access covers up to 15 hosts, making initial POC coverage manageable.
Best for: Enterprises with log-heavy environments that need deep analytics across high-volume telemetry, or organizations already invested in the Splunk platform.
Key features
- Infrastructure monitoring with real-time alerts and dashboards
- Application performance monitoring with profiling
- OpenTelemetry-native data collection across services
- Log Observer Connect for correlating Splunk logs with metrics and traces
- AI-powered analytics and guided troubleshooting
Why choose Splunk Observability Cloud: Strongest when the buyer already uses Splunk for log management or security, since the Log Observer Connect integration removes the need to re-ingest data. Teams without existing Splunk investment should model whether the combined Splunk Platform and Observability Cloud cost fits their budget.
Splunk Observability Cloud pricing: Free for up to 15 hosts. Infrastructure plan starts at $15 per host per month, billed annually. App and Infrastructure runs $60 per host per month. End-to-End is $75 per host per month.
G2 rating: 4.3/5
12. LogicMonitor
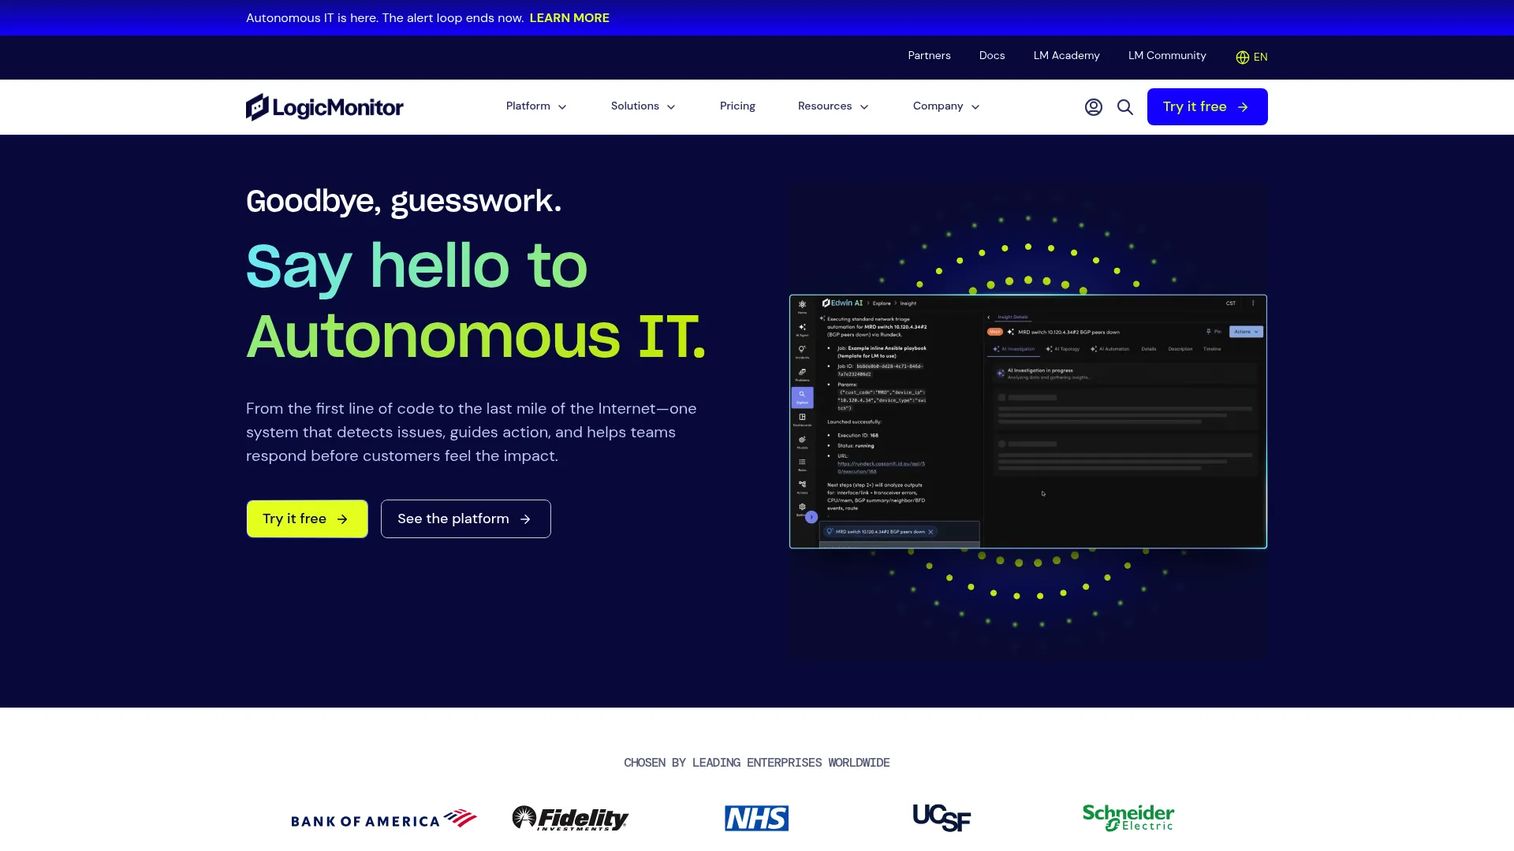
LogicMonitor is a SaaS-based hybrid observability platform with agentless discovery, topology mapping, dynamic thresholds, cloud monitoring, log management, synthetic monitoring, and AI-driven anomaly detection. With 3,000+ integrations, it connects across cloud providers, on-prem infrastructure, networking equipment, and applications without requiring extensive custom configuration. A 15-day free trial is available for evaluation.
Best for: IT operations teams that want broad hybrid monitoring coverage with automated discovery and minimal manual configuration during initial rollout.
Key features
- Agentless discovery across cloud, on-prem, and network infrastructure
- Topology and dependency mapping across hybrid environments
- Dynamic thresholds with AI-powered anomaly detection
- Network monitoring with device-level visibility
- 3,000+ integrations covering cloud providers and infrastructure components
Why choose LogicMonitor: Fits teams that need fast time-to-first-signal across a wide infrastructure footprint without building monitoring configurations from scratch. The Hybrid Unit pricing model means cost scales predictably as the monitored estate grows.
LogicMonitor pricing: Essentials starts at $16 per Hybrid Unit per month. Advanced runs $27 per Hybrid Unit per month. Signature with Edwin AI is $53 per Hybrid Unit per month. A 15-day free trial is available.
G2 rating: 4.5/5
13. Amazon CloudWatch
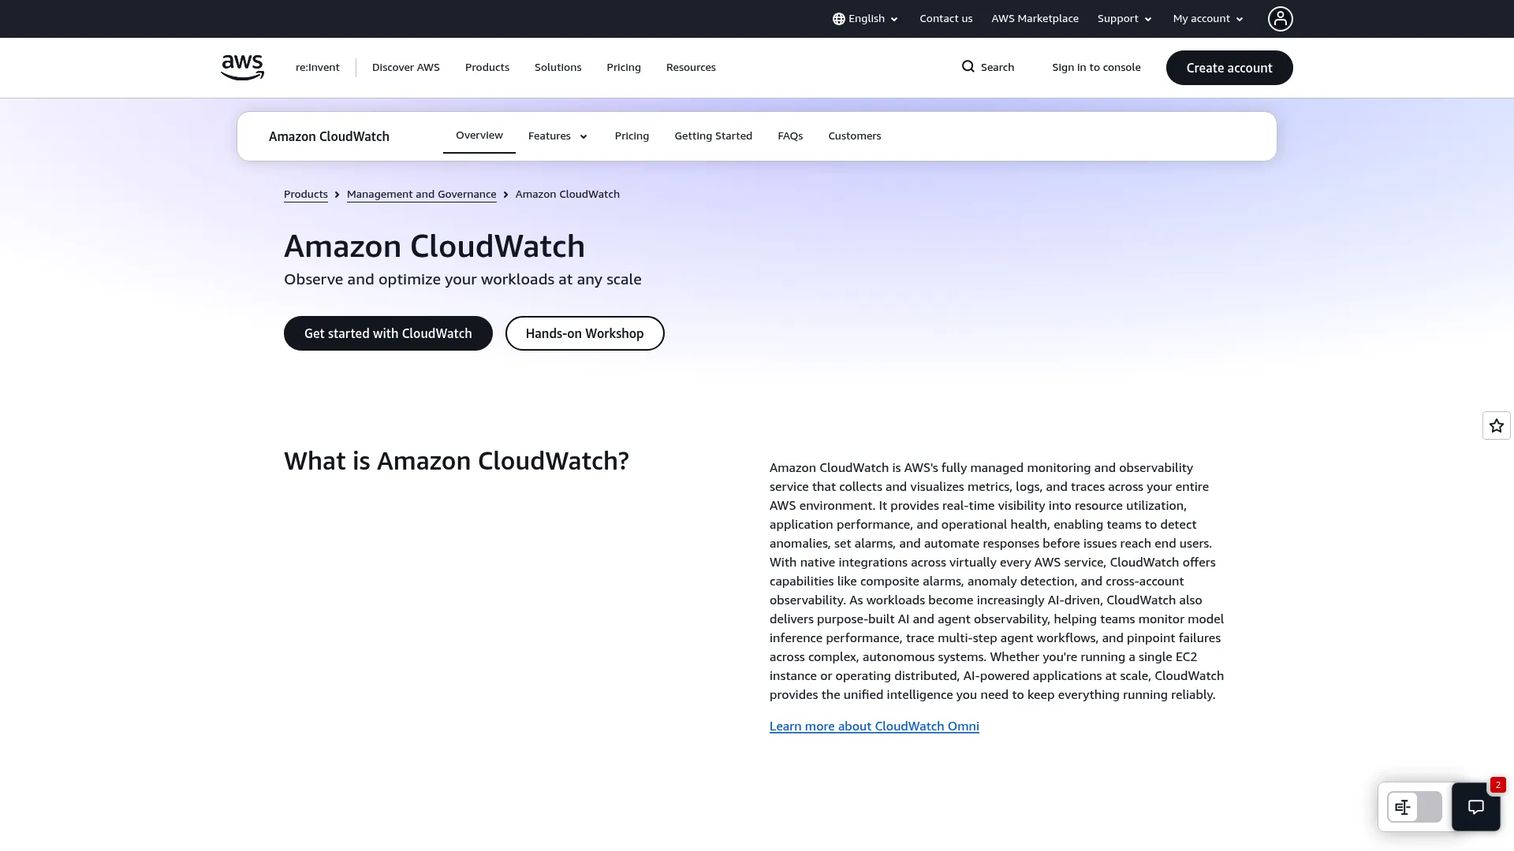
Amazon CloudWatch is AWS's managed monitoring service for metrics, logs, alarms, dashboards, events, Container Insights, and synthetics across AWS services and on-prem resources. Every AWS service emits CloudWatch metrics by default, making it the natural starting point for any AWS-first environment. Pricing is usage-based, with a free tier covering 5 GB of log data per month alongside other standard allowances.
Best for: AWS-first teams that want native monitoring before adding third-party observability, or teams where AWS service health is the primary concern.
Key features
- AWS service metrics collected automatically across the full AWS catalog
- CloudWatch Logs with filtering, querying, and retention management
- Alarms, composite alarms, anomaly detection, and automated actions
- Container Insights for ECS and EKS workloads
- Synthetics canaries for endpoint and API availability testing
Why choose Amazon CloudWatch: The right starting point when the environment is predominantly AWS and the team wants zero-configuration metric collection across managed services. Multi-cloud and on-prem coverage typically requires adding a third-party observability layer alongside it.
Amazon CloudWatch pricing: Usage-based with a free tier. Log data ingestion starts at $0.50 per GB. Specific rates vary by feature, volume, and AWS Region.
G2 rating: 4.3/5
14. Azure Monitor
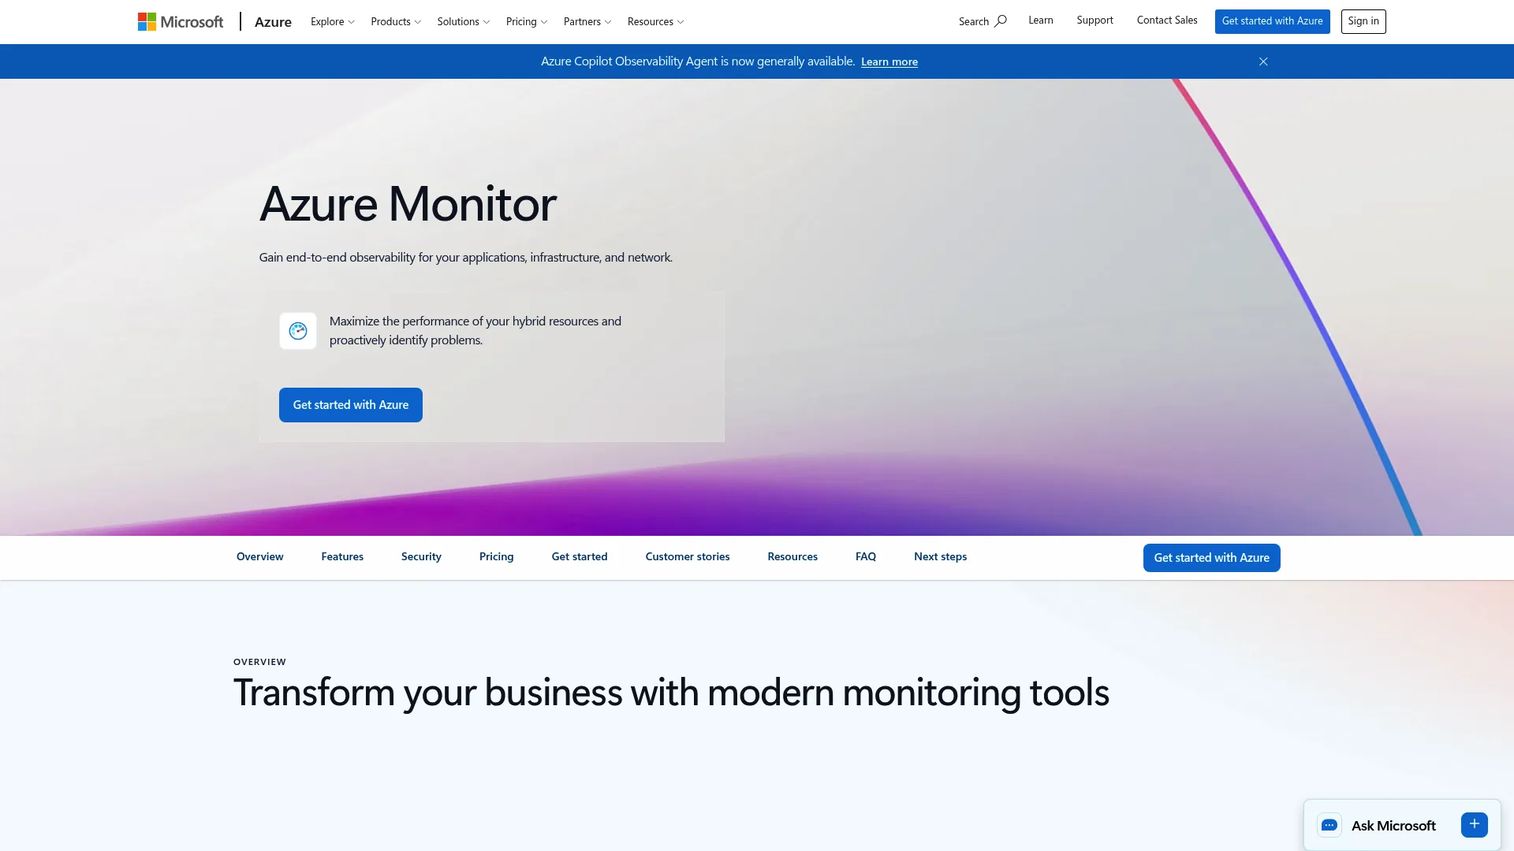
Azure Monitor is Microsoft's native monitoring platform for Azure resources, applications, logs, metrics, alerts, and workbooks. Log Analytics provides a central workspace for querying log data across Azure services, virtual machines, and connected on-prem systems. Application Insights adds APM capabilities for applications deployed on Azure or connected to Azure services. Platform metrics and ping web tests are available at no charge.
Best for: Azure-first teams and Microsoft-centered IT organizations that want native telemetry collection across their Azure estate without deploying additional agents or platforms.
Key features
- Azure metrics collected automatically from all Azure services
- Log Analytics workspace for centralized log querying and retention
- Application Insights for application performance monitoring
- Alerts, action groups, and workbooks for visualization and reporting
- Container insights for AKS workloads
Why choose Azure Monitor: Choose it when the team is already invested in Azure and Microsoft operations tooling. Organizations running multi-cloud or hybrid environments with significant AWS or GCP workloads typically add a third-party platform for consistent cross-environment visibility.
Azure Monitor pricing: Usage-based, with platform metrics and ping web tests free of charge. Log data ingestion, retention beyond free allowances, alerts, and other capabilities carry usage-based charges that vary by region and volume.
G2 rating: 4.3/5
15. Google Cloud Monitoring
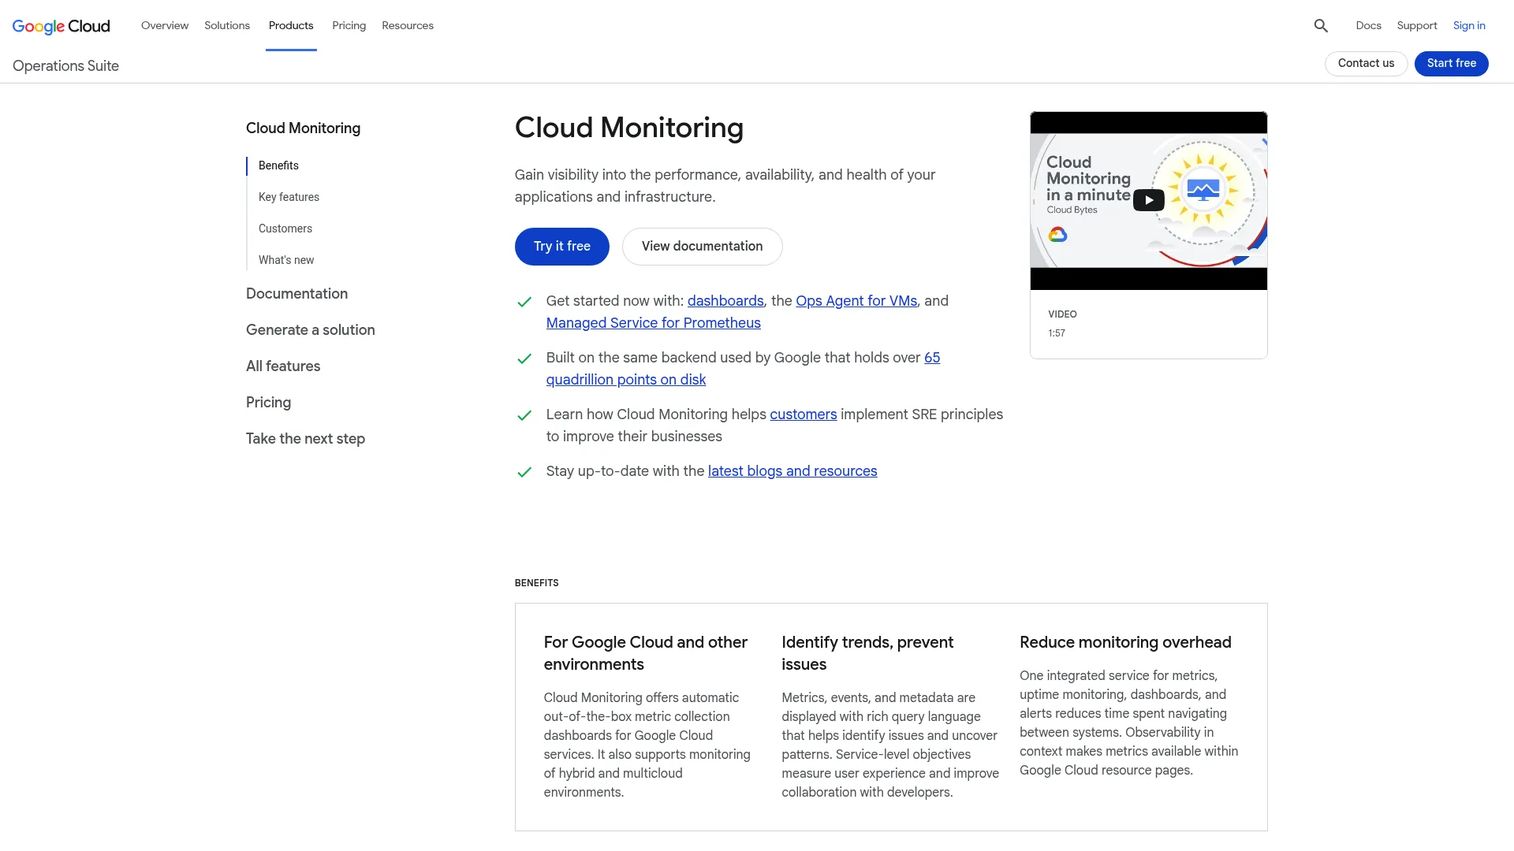
Google Cloud Monitoring is Google Cloud's native monitoring service for metrics, uptime checks, alerting policies, dashboards, and service-level objective monitoring. Managed Service for Prometheus is available within the platform for teams running Prometheus-style metrics without managing their own backend. The Ops Agent collects VM metrics and logs across GCE instances, and a free monthly allotment covers 150 MiB of chargeable metric ingestion and 1 million uptime-check executions per project.
Best for: Google Cloud-first teams that want native visibility into GCP resources and services without deploying additional monitoring infrastructure.
Key features
- GCP metrics collected automatically from all Google Cloud services
- Uptime checks for endpoint and service availability
- Alerting policies with multi-channel notification routing
- Custom dashboards with metrics, logs, and SLO visualization
- Managed Service for Prometheus for Kubernetes metric collection
Why choose Google Cloud Monitoring: The most direct fit for teams running primarily on GCP who want tight integration with Google Cloud IAM, billing, and service health. Organizations with AWS, Azure, and on-prem systems alongside GCP workloads will generally need a broader multi-cloud platform to maintain consistent visibility.
Google Cloud Monitoring pricing: Usage-based with a free monthly allotment. Metric ingestion starts at $0.2580 per MiB above 150 MiB free. Managed Prometheus metrics start at $0.060 per million samples. Uptime checks are $0.30 per 1,000 executions above the free allotment.
G2 rating: 4.2/5
Considerations when choosing cloud infrastructure monitoring tools
Start with the environment map
Before evaluating vendors, document what you actually need to monitor: Cloud providers, Kubernetes clusters, network devices, databases, storage systems, VMs, serverless functions, and on-prem servers. A tool that covers AWS comprehensively but lacks SNMP support may not fit a buyer with legacy networking equipment. Match the platform's coverage to the actual estate, not the ideal one.
Model total cost before the POC
Host pricing is only one line. Also factor in data ingest rates, log retention duration, custom metric counts, container counts, number of editor seats, synthetics, and support tiers. Price the 100-host or 500-host future state, not just the initial 20-host POC. Usage-based tools can surprise buyers at scale if pricing is modeled only against the initial deployment footprint.
Test time to first useful signal
The POC should measure how quickly the team gets accurate alerts, populated dashboards, and topology context from a real environment. Track deployment time, agent rollout, cloud integration setup, and time from installation to first actionable alert. A tool that takes three days to surface useful data in a POC will face adoption friction in production.
Check alert quality and incident workflow fit
Volume and accuracy matter equally. Evaluate noise reduction, alert deduplication, correlation across signals, escalation rules, and integration with your existing incident management tools. A platform that fires 200 alerts per hour during a routine deployment is not helping the team resolve incidents faster. Ask vendors to demonstrate a realistic incident scenario during evaluation.
Decide how much control you need
SaaS platforms reduce operational burden at the cost of data sovereignty and customization depth. Open-source stacks give full control at the cost of engineering time and maintenance ownership. Native cloud tools integrate tightly with one provider but rarely scale well across mixed environments. Self-hosted commercial tools sit between those options. Match the control model to the team's operational capacity and the buyer's data-residency requirements.
Conclusion
The right cloud infrastructure monitoring tool depends on environment shape, team capacity, and where the monitoring gaps actually sit.
For broad SaaS observability, Datadog, Dynatrace, and New Relic are the three platforms most buyers evaluate first, each with different pricing models and technical strengths. If open-source control matters, Prometheus and Grafana Cloud cover Kubernetes-native environments well, with Zabbix and Checkmk handling broader hybrid and on-prem estates. AWS, Azure, and Google Cloud-native tools are strong starting points inside single-provider environments but need supplementing for multi-cloud coverage. For enterprise operations teams with log-heavy or network-heavy requirements, Splunk Observability Cloud, LogicMonitor, SolarWinds Observability, and IBM Instana each address a different part of that problem.
Pick two or three candidates, run them against identical POC success criteria, and measure time to first useful signal, alert quality, cost at scale, and integration fit with your existing stack.
When you're building presales demos or interactive product experiences to support your infrastructure software evaluations, Start your journey with Guideflow today!
FAQs
Cloud infrastructure monitoring tools are software platforms that track the health, performance, availability, and dependencies of cloud, hybrid, and on-prem infrastructure using telemetry including metrics, logs, traces, events, and alerts. They give IT, DevOps, and SRE teams the visibility they need to detect outages, find root cause, and reduce alert noise across modern distributed environments.
Cloud monitoring typically refers to visibility into cloud services, managed resources, and provider-specific metrics within platforms like AWS, Azure, or Google Cloud. Infrastructure monitoring is a broader term covering cloud, on-prem servers, networks, virtual machines, containers, and storage. In modern environments the categories overlap substantially, and most commercial observability platforms now cover both.
Prometheus is the standard open-source choice for Kubernetes-native metrics collection, typically paired with Grafana for dashboards and a long-term storage backend. Grafana Cloud offers a managed version of the same stack. Commercial platforms including Datadog, Dynatrace, and New Relic all provide Kubernetes explorer views with deeper correlation across logs, traces, and infrastructure metrics for teams that want a more managed experience.
Open-source tools carry no license fee, but they are not free to operate. Teams absorb costs in engineering time for installation, configuration, scaling, upgrades, on-call coverage, and long-term storage management. SaaS tools invoice more directly, but they reduce the operational burden significantly. The actual cost comparison depends on team size, environment scale, and how much engineering time monitoring infrastructure consumes.
A useful POC tests at least six dimensions: Deployment time and agent rollout effort, accuracy of alert detection against a known failure scenario, dashboard and topology quality for the specific environment, root cause identification speed, cost projection at realistic production scale, and integration with existing incident management tools. Run each candidate against the same test scenario to produce a fair comparison rather than evaluating tools in isolation.
Native tools are strong starting points inside a single cloud provider. Amazon CloudWatch, Azure Monitor, and Google Cloud Monitoring each provide deep, low-configuration coverage for their respective environments. They become less sufficient when the monitored estate spans multiple cloud providers, on-prem infrastructure, Kubernetes clusters across environments, and SaaS services. Third-party platforms like Datadog, Dynatrace, and LogicMonitor exist largely because most mature infrastructure runs across more than one of those boundaries.
Pricing models vary by vendor and category. SaaS platforms commonly price by monitored host count, data ingest volume, log retention duration, number of users, custom metric count, and container count. Usage-based platforms like New Relic and the native cloud tools charge by data consumed rather than resource count. Open-source tools carry no license cost but impose engineering and infrastructure overhead. Self-hosted commercial tools often use perpetual node-based licenses. Model pricing at both current scale and a realistic 12-month growth projection before comparing total cost across options.