You ran a discovery scan last month. It told you 4,200 machines have Adobe Acrobat Pro installed. Finance used that number to renew 4,200 licenses.
Here's the problem. Installed is not used. A scan tells you what sits on disk, not what anyone actually opens. That gap is where budget leaks. It is also where software audits get uncomfortable.
The global usage metering for software market reached USD 2.94 billion in 2024 and is forecast to grow at a 13.2% CAGR to USD 8.53 billion by 2033, according to Dataintelo (2024). The reason is simple: teams want proof of actual software usage before [they sign a renewal, defend a license count, or retire an app nobody touches.
Software metering answers a different question than inventory does. It measures launches, duration, and frequency, tied to a user and a device.](https://learn.microsoft.com/en-us/previous-versions/windows/it-pro/windows-10/security/threat-protection/auditing/event-4688) That is the difference between "we have it" and "people run it every day."
This guide breaks down 7 tools and approaches for software usage tracking, from Windows event log methods to native Microsoft reporting to dashboard layers. No single tool wins every scenario. The right pick depends on your stack and your reporting goals.
What's inside
This guide is for IT admins, SAM managers, endpoint teams, and product or operations leaders who need to see real usage, not just installation status.
We selected tools based on four criteria that matter most for software usage monitoring:
- Real usage visibility: does it capture launches, duration, and frequency, or only what is installed?
- Microsoft ecosystem fit: does it work with Configuration Manager, Intune, or Windows event logs?
- Reporting depth: per-device reporting, historical trends, and exportable data.
- Maintenance overhead: how much tuning, retention management, and upkeep it demands at scale.
TL;DR
Short on time? Here are the decision shortcuts:
- Best for Windows event log based metering: Lansweeper, which reads process creation data to show actual application launches.
- Best for SAM and productivity reporting: CurrentWare, which pairs software usage tracking with web and app monitoring.
- Best for Microsoft stack teams already using Configuration Manager: Microsoft Configuration Manager and its native software metering reports.
- Best for Microsoft 365 centric organizations: Microsoft Intune paired with add-ons or custom reporting pipelines.
- Best for Intune reporting depth: Eido, a purpose-built Intune reporting layer.
- Best for logging and event driven approaches: AppLocker reporting plus Log Analytics.
- Best for dashboards and executive reporting: Power BI, sitting on top of your metering data.
What is usage metering software
Usage metering software measures how applications are actually used, not just whether they are installed. It captures signals like application launches, session duration, usage frequency, the user ID, and the device ID, then turns that into reporting you can act on.
That distinction matters. Installed software discovery, the kind most inventory scans produce, tells you an executable exists on a machine. Usage metering tells you whether anyone runs it, how often, and for how long. Two very different inputs to a license optimization decision.
Most usage metering approaches collect data through one of a few methods: Windows process creation events, agent-based tracking, or built-in metering rules in an endpoint management platform. Each method offers a different level of fidelity, which we cover in the considerations section below.
Key features to look for in usage metering software:
- Usage frequency and duration: how often an app launches and how long sessions run.
- Per-device reporting: usage broken down by individual machine, not just aggregate counts.
- User attribution: which user account ran the application.
- Historical trends: usage over weeks and months, not a single snapshot.
- Exportable reports: CSV or dashboard exports that feed software asset management and audit workflows.
- Retention controls: the ability to manage and clean up usage history in large environments.
This is the core of any software utilization program. Without it, you are budgeting on assumptions.
When to use usage metering software
Metering earns its place in three recurring situations.
Optimize license counts before renewal
Renewal quotes anchor on your current seat count. That count is usually inherited from an install-based number that nobody has questioned in years. Actual software usage data breaks the cycle. It shows which seats are active, which are dormant, and which apps have zero launches across a quarter. You walk into the renewal with evidence, not a guess, and reclaim seats that were never used.
Support audit readiness and SAM reviews
When a vendor audit lands, "we think we are compliant" is not an answer. Usage data validates deployment claims against real activity. It helps you match entitlements to consumption, spot over-deployment before an auditor does, and back up your position with per-device records. That is the difference between a stressful audit and a documented one.
Prioritize adoption and planning decisions
Usage trends are a planning input, not just a compliance tool. Product, IT, and operations teams use them to decide where to run training, which apps to standardize on, and which tools to retire. If two overlapping apps are deployed but only one sees real usage, the decision makes itself. Trend data turns "which tool should we keep?" into a numbers question.
Comparison table
The table below covers all seven tools and approaches for software metering. Pricing and G2 ratings reflect current public values where available; Microsoft native features and Windows components are licensed through broader agreements rather than standalone prices.
| # | Product | Best for | Key differentiator | Pricing | G2 rating |
|---|---|---|---|---|---|
| 1 | Lansweeper | Event log based metering | Reads process creation data for actual launches | From $199/month | 4.4/5 |
| 2 | CurrentWare | SAM and productivity reporting | Usage tracking plus web and app monitoring | From $6/user/month | Not published |
| 3 | Microsoft Configuration Manager | Windows estates on SCCM | Native software metering reports | Via Software Assurance | Not published |
| 4 | Microsoft Intune | Microsoft 365 centric orgs | Cloud endpoint management with app inventory | From $8/user/month | 4.5/5 |
| 5 | Eido | Intune reporting at scale | Purpose-built Intune reporting and metering | From $7/user/year | Not published |
| 6 | AppLocker reporting | Event driven usage visibility | Application control events plus Log Analytics | Included with Windows | Not published |
| 7 | Power BI | Dashboards and executive reporting | Visualization layer over metering data | From $14/user/month | 4.5/5 |
Best 7 usage metering software tools for 2026
Below is the full breakdown of each tool, including how it collects usage data, who it fits, and what it costs.
1. Lansweeper
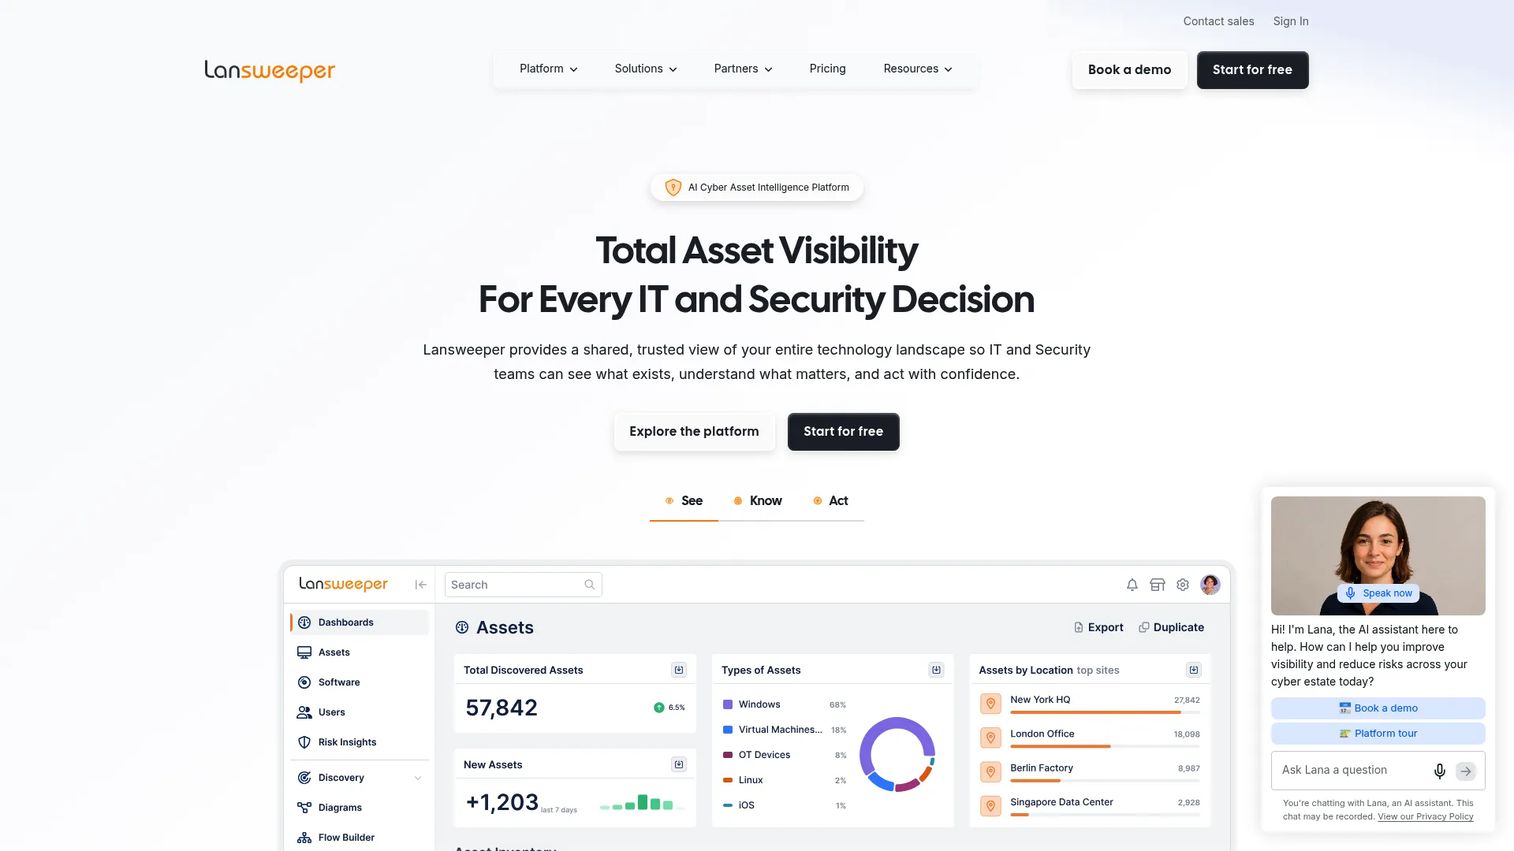
Lansweeper is a cyber asset intelligence platform that discovers, inventories, and enriches IT, OT, and cloud assets. For usage metering specifically, it goes beyond installed software scans by reading Windows process creation data. That means it can show you when an application actually launched, not just that it exists on the machine.
This is where the installed-versus-used gap closes. Lansweeper can consume Windows Security Event 4688, the process creation event, to build a picture of real application launches per device. To collect it, you enable Audit Process Creation through Group Policy or secpol.msc, and Lansweeper reads the resulting event log entries. The output is a usage report you can tie to license decisions.
Best for: IT and security teams that already run Lansweeper for asset discovery and want to layer real usage data on top.
Key features
- Continuous asset discovery across IT, OT, cloud, and IoT
- Process creation based usage metering via Windows event logs
- Asset normalization and risk and lifecycle enrichment
- Integrations for ITSM, CMDB, and security tools
Why choose Lansweeper: If you want one platform for both inventory and usage, and you are comfortable enabling process creation auditing, Lansweeper gives you actual software usage without a separate metering agent. It fits teams that value centralized asset visibility.
Pricing: A 14-day free trial includes full access and continues free up to 100 assets. Starter plans begin at $199/month for 2,000 assets, Pro starts at $379/month, and Enterprise is custom, all billed annually.
2. CurrentWare
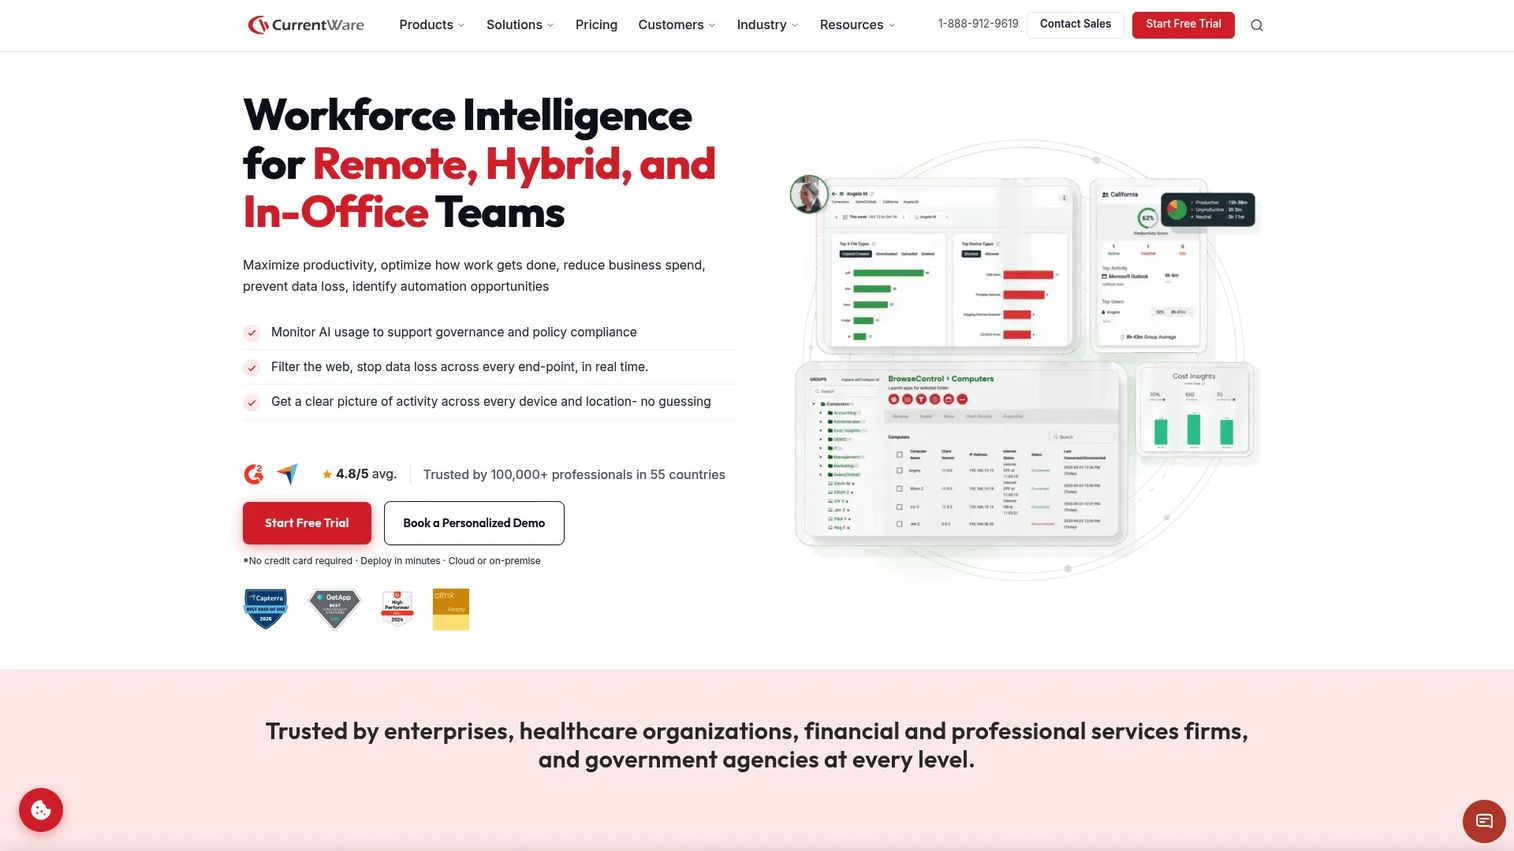
CurrentWare is a workforce analytics and endpoint security suite that covers productivity, web filtering, device control, and power management. Its BrowseReporter module handles software usage monitoring, tracking which applications run and for how long across your endpoints.
For software asset management, this gives you a usage layer tied to a broader monitoring picture. You see not only application launches and duration but also web activity, which helps operations teams understand real software utilization patterns and where cost savings hide.
Best for: Organizations that want a bundled employee monitoring, web filtering, DLP, and power management suite with usage reporting built in.
Key features
- Web and app usage monitoring with duration tracking
- Website blocking and category filtering
- USB and device control with file-transfer prevention
- Reporting and analytics across web and application activity
Why choose CurrentWare: CurrentWare fits IT and operations teams that want software usage tracking alongside productivity and security controls, rather than a standalone meter. The suite approach means one agent covers several jobs.
Pricing: BrowseReporter is $12 per user per month. The individual modules start at $6 per user per month, and the full CurrentWare Suite is $20 per user per month. A minimum one-year subscription applies.
3. Microsoft Configuration Manager
Microsoft Configuration Manager, still widely known as SCCM, is Microsoft's on-premises endpoint management platform for devices, software, updates, and compliance. It includes native software metering, a feature that has anchored Windows estate usage reporting for years.
Configuration Manager software metering works by defining metering rules that track when specified executables run on managed devices. It records usage data centrally, so you can report on which apps launched, how often, and on which machines. For teams already running the current branch, this is metering you already own.
Best for: Enterprises needing on-premises Windows device management with native metering and optional Intune co-management.
Key features
- Native software metering rules for tracked executables
- Current branch and long-term servicing branch options
- Co-management with Microsoft Intune
- Per-device usage reporting across the managed estate
Why choose Microsoft Configuration Manager: If your Windows estate already runs on Configuration Manager, its metering reports are the most direct path to usage data without adding a vendor. It remains a reference point for large Windows environments.
Pricing: Configuration Manager is licensed through active Software Assurance or equivalent subscription rights. Microsoft documents the licensing branches but does not publish a standalone public price.
4. Microsoft Intune
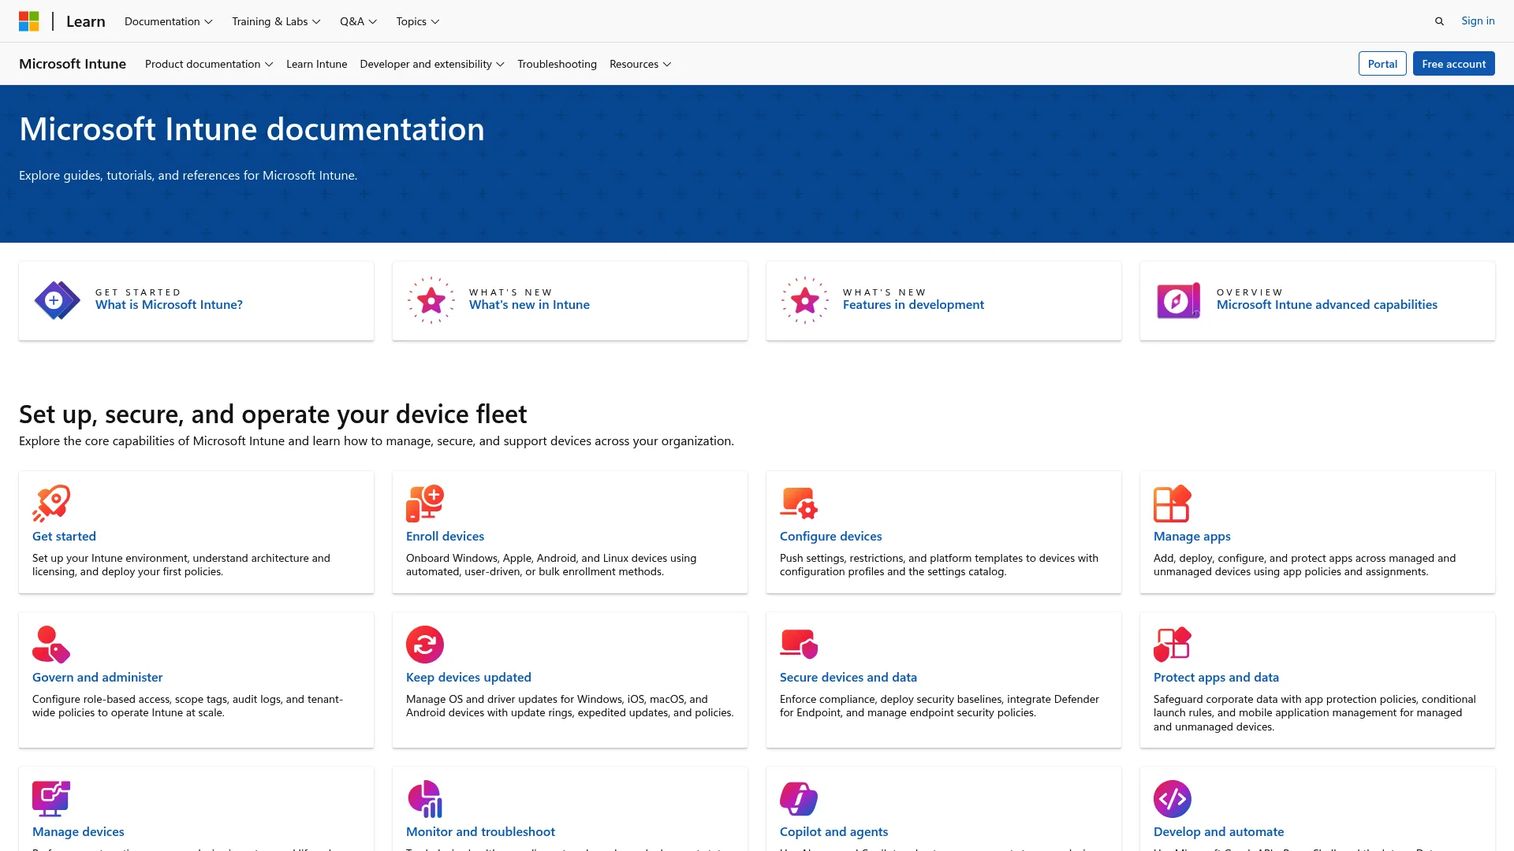
Microsoft Intune is Microsoft's cloud-based unified endpoint management service for devices and apps. It manages Windows, macOS, iOS, iPadOS, and Android from one Microsoft-centered console, and it reports on discovered and installed applications across those devices.
Here is the honest part about Intune limitations. Intune reports installed software and app inventory well, but it does not natively meter actual usage the way Configuration Manager's metering rules do. It tells you an app is present, not how many times a user launched it or for how long. Teams that need true usage frequency and duration on Intune-managed devices usually pair it with an add-on or a custom pipeline through Log Analytics.
Best for: Microsoft 365 centric organizations managing cross-platform devices from a single cloud console.
Key features
- Cross-platform device and app management
- Mobile application management (MAM)
- Endpoint analytics
- Installed application inventory and discovery
Why choose Microsoft Intune: Intune is the right base layer for cloud-first, cross-platform fleets. For usage metering specifically, plan to extend it with the reporting approaches covered below.
Pricing: Plan 1 is $8.00 per user per month, Plan 2 is $4.00 per user per month, and the Intune Suite is $10.00 per user per month, all paid yearly. A 30-day free trial is available.
5. Eido
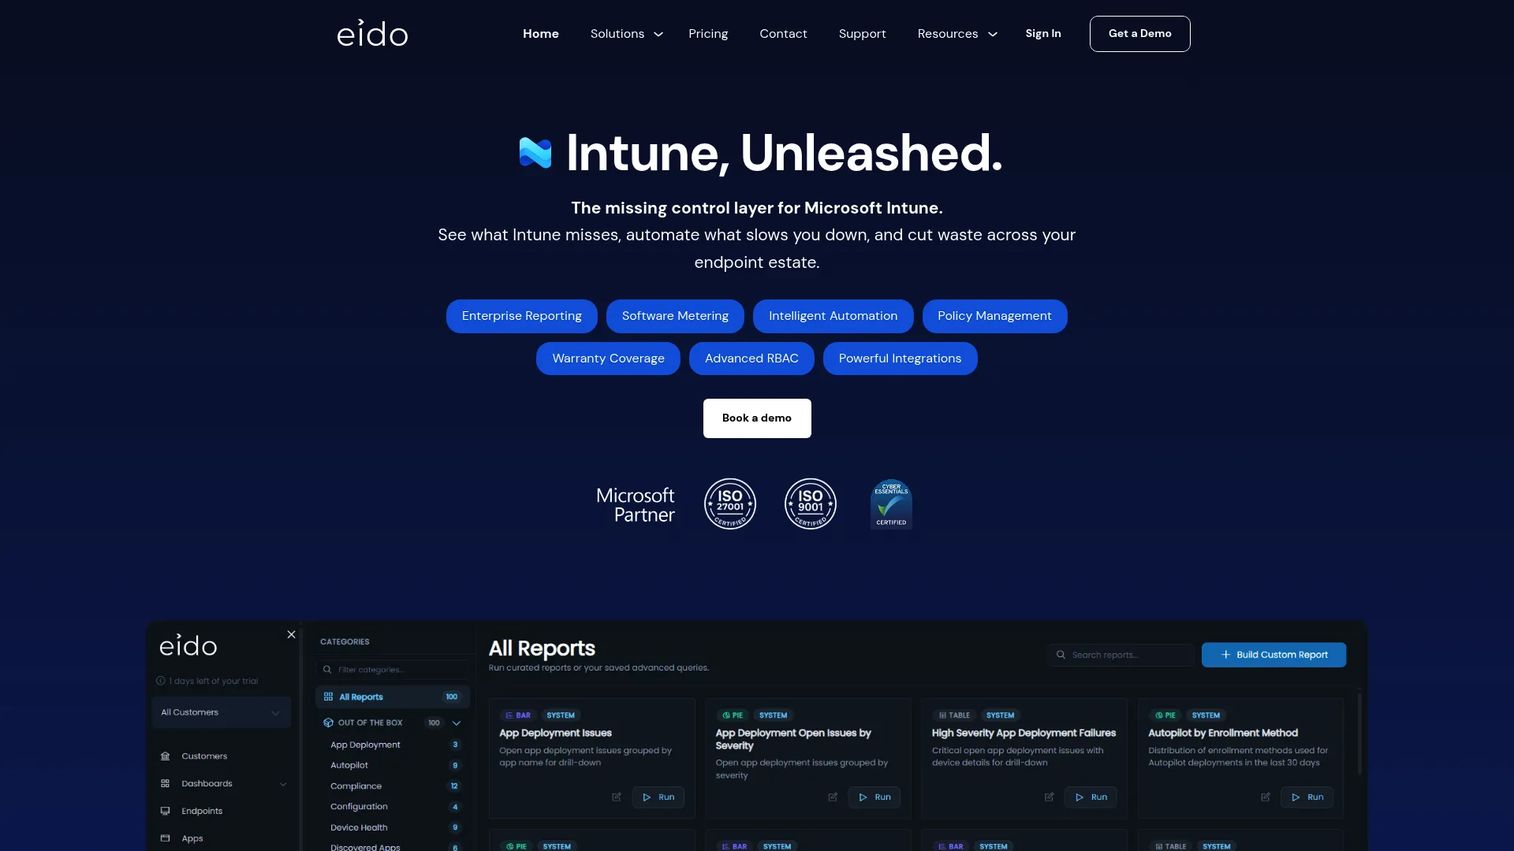
Eido is a cloud-based reporting, monitoring, and device management layer built specifically for Microsoft Intune. It exists to fill the reporting gap Intune leaves, giving IT teams and MSPs deeper visibility than the native console offers, including software metering.
For teams committed to the Microsoft ecosystem, Eido is the way to get usage metering without leaving Intune. It layers on software metering, patch tracking, and over 100 out-of-the-box reports, so you can report on application usage across your Intune-managed estate without building a custom pipeline from scratch.
Best for: IT teams and MSPs managing Microsoft Intune at scale who need richer reporting than the native console provides.
Key features
- Software metering built for Intune-managed devices
- Over 100 out-of-the-box reports
- Custom dashboards, widgets, and scheduled sharing
- Patch tracking alongside usage reporting
Why choose Eido: Eido is the natural add-on when you want to stay inside the Microsoft stack but need metering and reporting depth Intune alone does not deliver. It saves you from building custom reporting.
Pricing: Eido starts at $7 per user, per year, with simple per-user pricing. A 30-day free trial has been referenced by the vendor.
6. AppLocker reporting
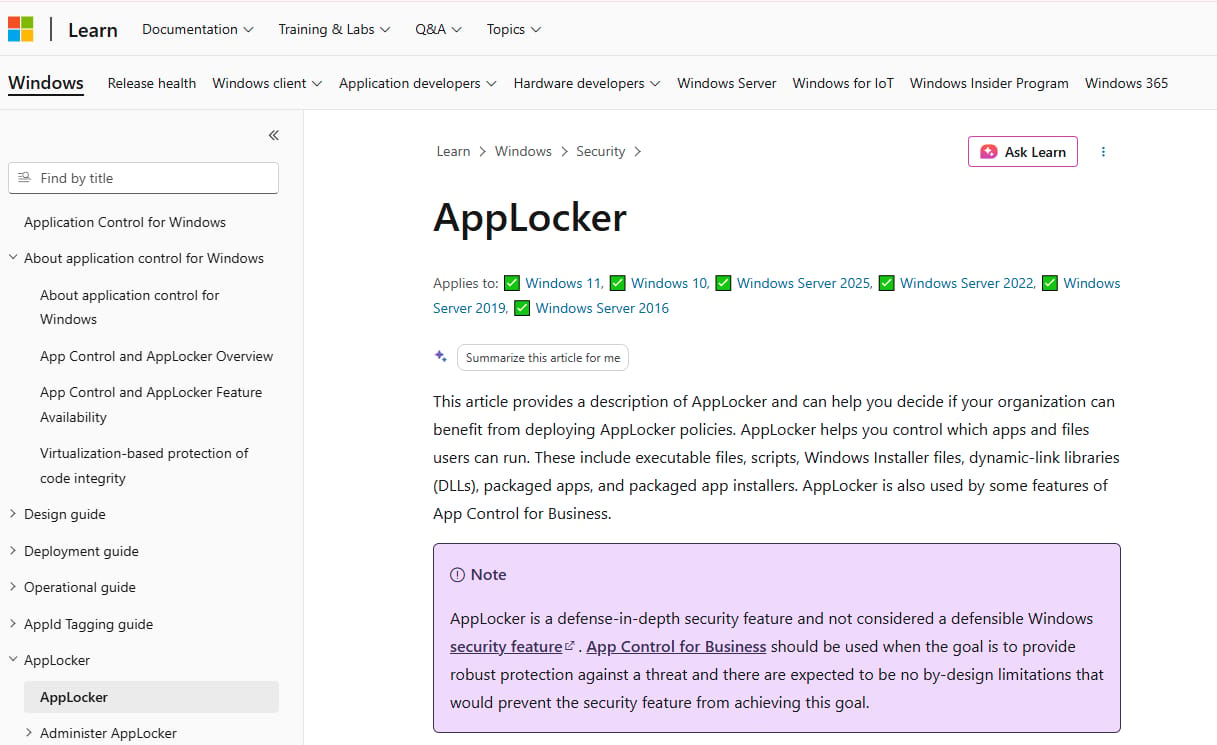
AppLocker is a Windows application control feature that lets administrators allow or block apps, scripts, installers, and DLLs from running. It is a security control first, but its event logging makes it a workaround path for usage visibility.
Here is how it becomes a metering source. Running AppLocker in audit-only mode logs an event every time a controlled application runs, without blocking anything. Ship those events to Log Analytics, and you have a queryable record of which applications ran, on which devices, and when. It is policy-adjacent monitoring that doubles as usage data.
Best for: Windows admins who already run application control and want usage signal from existing event streams.
Key features
- Allow and deny rules by publisher, product, file name, version, path, or hash
- Audit-only mode that logs runs without blocking
- Support for executables, scripts, installers, DLLs, and packaged apps
- Managed via Group Policy, PowerShell, and local security policy
Why choose AppLocker reporting: If you already run AppLocker for security, audit-mode logging into Log Analytics gives you usage visibility from data you are already generating. It works best when application control is already part of your baseline.
Pricing: AppLocker is included with supported Windows editions rather than sold separately. Log Analytics ingestion is billed through your Azure subscription.
7. Power BI
Power BI is Microsoft's business analytics platform for interactive reports, dashboards, and data insights. It is not a meter itself. It is the visualization layer that turns raw usage data into something executives and SAM teams can read.
Point Power BI dashboards at metering data from Microsoft Graph, Log Analytics, Configuration Manager, or plain CSV exports, and you get trend lines, per-device breakdowns, and license optimization views in one place. This is where fragmented usage signals become a single reporting and analytics surface for renewal and audit conversations.
Best for: Teams that need self-service BI and executive-ready dashboards on top of usage data they already collect.
Key features
- Interactive dashboards and reports over usage data
- Data modeling and visualization
- Connectors for Log Analytics, Microsoft Graph, and CSV sources
- Copilot and AI-assisted analysis
Why choose Power BI: Power BI is the reporting layer, not the collector. Pair it with any metering source above when you need dashboards that leadership will actually open. It shines at making usage trends legible.
Pricing: Power BI has a free offering. Power BI Pro is $14 per user per month, and Premium Per User is $24 per user per month.
Considerations
Before you commit to an approach, run through this checklist.
Data source quality
Not all usage signals are equal. Windows event logs and process creation data capture real launches at the OS level. Metering rules in Configuration Manager track defined executables. Agent-based tools add duration and web context. Decide what fidelity your decisions require before choosing a collection method.
Microsoft ecosystem fit
Native Microsoft tools are enough when your estate is Windows-heavy and already on Configuration Manager. When you are cloud-first on Intune, plan for its metering limitations and budget for an add-on like Eido or a Log Analytics pipeline. Match the tool to where your devices actually live.
Reporting and retention
Per-device reporting and historical trends are what make usage data useful for license optimization. In large environments, retention becomes a real concern. Event logs and process creation data pile up fast, so plan cleanup and archiving before your storage costs surprise you.
Scale and maintenance
Every approach carries operational upkeep. Tuning metering intervals, managing history, and keeping reports current all take time. In large estates, that maintenance overhead is a real line item. Weigh it against the cost savings the data will unlock.
SAM and compliance workflow fit
The best usage data is worthless if it does not feed your process. Confirm the tool exports in a format your software asset management, audit prep, and governance workflows can consume. Reporting that lands in Power BI or a CSV your SAM team already uses beats a dashboard nobody opens.
Conclusion
Installed software is not the same as actual usage. That single distinction is the reason usage metering software exists, and it is the reason a discovery scan should never set your renewal count.
Your right pick depends on your stack. Choose Lansweeper when you want event log detail layered on asset discovery. Choose CurrentWare when you want SAM depth alongside productivity reporting. Choose Microsoft Configuration Manager when your Windows estate already runs native metering. On the cloud side, pair Microsoft Intune with Eido or a Log Analytics pipeline to close its metering gap, and lean on AppLocker reporting when application control already generates the events you need. Then put Power BI on top for dashboards leadership will read.
Next step: pick one high-cost application, meter its real usage for a full quarter, and compare launches against your license count. That single exercise usually pays for the tooling. Once you trust the data, expand metering across your estate and feed it into your renewal and audit readiness process.
FAQs
Software inventory tells you which applications are installed on a machine. Software metering tells you whether anyone actually runs them, how often, and for how long. Inventory answers "is it here," metering answers "is it used." For license optimization and audit readiness, metering is the data that matters, because installed count almost always overstates real demand.
Intune reports installed applications and app inventory well, but it does not natively meter actual usage the way Configuration Manager metering rules do. It shows an app is present, not how many times a user launched it. To get true usage frequency and duration on Intune-managed devices, teams typically add a reporting layer like Eido or build a custom pipeline through Log Analytics.
Windows Security Event 4688, the process creation event, records every time a process starts on a device. Enable Audit Process Creation through Group Policy or secpol.msc, and you get an OS-level record of real application launches. Tools like Lansweeper read these events to show actual usage rather than mere installation, which is why event log data is a high-fidelity metering source.
Compare actual launches against your licensed seat count. Seats with zero or minimal usage across a full quarter are candidates to reclaim or drop at renewal. Match usage against entitlements to spot over-deployment, then adjust your renewal quote to real demand. Done consistently, this turns a renewal from an inherited guess into an evidence-based negotiation and drives cost savings.
In large environments, collect usage through your existing management layer, then centralize reporting. Configuration Manager metering or event log collection feeds the data; Power BI dashboards make it readable across teams. Plan retention early, because process creation and event data grow quickly. Per-device reporting plus historical trends give you both audit detail and planning signal without drowning in raw logs.
No. Power BI is a visualization and reporting layer, not a data collector. It cannot meter usage on its own. It reads metering data from sources like Configuration Manager, Log Analytics, Microsoft Graph, or CSV exports, then turns that into dashboards and trend lines. Pair it with an actual metering source, and it becomes the surface where SAM and leadership review the numbers.
Yes. For on-premises and hybrid Windows estates, Configuration Manager software metering remains a reference point. Its metering rules track defined executables and report usage per device, which is exactly what license reviews need. Many organizations co-manage Configuration Manager with Intune, using the former for deep metering on Windows and the latter for cross-platform cloud management.
Launches are the start, not the whole picture. Track session duration to separate apps that open briefly from apps used all day. Track usage frequency to see daily versus quarterly patterns. Add user and device attribution so you know who runs what and where. Together, launches, duration, frequency, and attribution give you the full software utilization picture for both SAM reporting and adoption decisions.