Your engineering team says they're on track. The sprint board says otherwise. And you, as the PM, are about to walk into a stakeholder meeting with no better evidence than a Slack message from yesterday.
This is the real cost of engineering opacity. Status updates fragment across Git, Jira, and sprint rituals. Cycle time data lives in one tool; deployment health lives in another. By the time a delivery risk surfaces, you've already missed the window to adjust scope or reset expectations.
According to JetBrains (2025), 66% of developers are not confident that productivity metrics represent their work. That's not a measurement problem alone. It's a signal that the wrong tools, measuring the wrong things, create more noise than clarity for everyone involved, including product.
Software development analytics tools exist to change that equation. They connect engineering data across repositories, project management systems, CI/CD pipelines, and developer feedback so that PMs and engineering leaders can make better roadmap, prioritization, and capacity decisions before problems become emergencies.
The question is not whether to instrument your engineering work. The question is which software development analytics tool gives your team useful signal without turning engineering measurement into a scoreboard.
What's inside
This guide compares 21 software development analytics and engineering analytics tools for 2026. Tools were selected based on category fit, market visibility, integration breadth, and usefulness for product and engineering leaders.
Selection criteria:
- DORA metrics support and delivery performance visibility
- Engineering workflow visibility across Git, Jira, and CI/CD
- Developer experience and team health measurement
- AI impact measurement and engineering investment planning
- Pricing transparency and enterprise readiness
TL;DR
- Best overall engineering intelligence platforms: Waydev, Jellyfish, and LinearB offer the broadest coverage of delivery performance, AI impact, and DORA metrics
- Best for product and engineering alignment: Jellyfish, Jira, and Tempo connect engineering capacity to roadmap priorities and business outcomes
- Best for DevOps-native teams: GitLab, Azure DevOps, and Harness SEI embed analytics inside existing delivery platforms
- Best for developer experience measurement: DX, Swarmia, and Hatica combine quantitative delivery data with qualitative developer feedback
- Best for code quality analytics: SonarQube provides static analysis and technical debt visibility that DORA metrics alone won't cover
- Best for AI impact measurement: Waydev, LinearB, Faros AI, and Swarmia help teams establish baselines for AI coding tool adoption and ROI
What is software development analytics?
Software development analytics tools collect, connect, and analyze engineering data from code repositories, project management systems, CI/CD pipelines, incident tools, and developer feedback to show how software teams plan, build, ship, and improve.
The category is broader than most teams realize. It's distinct from project management dashboards, which track work items but rarely touch code or deployment data. It's distinct from code quality tools, which measure maintainability and security but not delivery flow or team capacity. And it's different from general business intelligence, which requires teams to build their own engineering data models from scratch.
DORA metrics (deployment frequency, lead time for changes, change failure rate, and mean time to restore) are the most widely cited benchmarks in the category. They give engineering and product teams a shared vocabulary for delivery performance. But DORA alone can't explain why cycle times are increasing, where review bottlenecks concentrate, or whether AI coding tools are actually accelerating delivery.
That's why the stronger platforms in this category add the SPACE framework (Satisfaction, Performance, Activity, Communication, and Efficiency), developer experience surveys, and qualitative data alongside quantitative signals.
For PMs, the practical value is in roadmap predictability and release confidence. If you can see that a team's pull request review time has doubled over two sprints, you have a data-backed reason to flag a delivery risk before the sprint closes.
Key capabilities to look for:
- Git and repository analytics
- Pull request and review flow metrics
- DORA metrics (deployment frequency, lead time, change failure rate, mean time to restore)
- Sprint and work-item analytics
- CI/CD and deployment data
- Incident and reliability signals
- Developer experience surveys
- Capacity and investment planning
- AI coding assistant impact tracking
- Executive dashboards and governance
When to use software development analytics tools
Forecast roadmap risk before stakeholders feel it
PMs use engineering analytics to see delivery risk earlier than the weekly standup allows. Metrics like cycle time, pull request review bottlenecks, unplanned work creep, and dependency drag often signal a miss two to three weeks before it appears on a burndown chart. The goal is not more dashboards. It's earlier, better-evidenced decisions about scope, resourcing, and stakeholder communication.
Improve engineering health without measuring the wrong things
There's a meaningful difference between team-level delivery trends and individual developer surveillance. The right analytics surface system-level bottlenecks: Review queues that slow entire teams, CI pipelines that fail too often, or sprint commitments that consistently exceed capacity. Team-aggregated metrics, longitudinal trends, and developer feedback protect this boundary. Commit counts and lines of code per person do not.
Connect engineering investment to product outcomes
Analytics help product, engineering, and finance have a shared conversation about capacity, tradeoffs, and business value. When you can show which roadmap initiatives consumed 60% of engineering effort last quarter, or where AI coding tools changed delivery speed on a specific codebase, you move from intuition to evidence. Platforms like Jellyfish and Tempo are specifically designed for this kind of investment visibility.
Software development analytics tools comparison
The 21 tools below span engineering intelligence platforms, DevOps-native analytics, code quality tools, developer experience platforms, and capacity planning software. Use the table to shortlist by use case, then read the entries for integration depth and PM-specific fit.
| # | Product | Best for | Key differentiator | Pricing | G2 rating |
|---|---|---|---|---|---|
| 1 | Waydev | Engineering intelligence and AI impact | AI adoption, ROI, and DORA in one layer | Free to $49/contributor/mo | 4.7/5 |
| 2 | Jellyfish | Engineering investment and business alignment | DevFinOps, investment allocation, AI ROI | Custom pricing | 4.5/5 |
| 3 | LinearB | Delivery workflow and PR automation | PR automation and AI impact measurement | $29/user/mo (annual) | 4.6/5 |
| 4 | GitHub | Native repository and workflow analytics | Built-in developer platform with CI/CD | Free to $21/user/mo | 4.7/5 |
| 5 | Swarmia | Engineering effectiveness with developer experience | Modular add-ons for AI and capitalization | Free to $55/developer/mo | 4.4/5 |
| 6 | GitLab | DevSecOps-native analytics | Value stream analytics inside the platform | Free to $29/user/mo | 4.5/5 |
| 7 | Jira | Work-item and sprint analytics for PM/Eng | Shared operating layer for product and engineering | Free; paid plans by user count | 4.3/5 |
| 8 | Azure DevOps | Microsoft-stack delivery analytics | Boards, Pipelines, and Power BI integration | Free (5 users); $6/user/mo | 4.2/5 |
| 9 | Pluralsight Flow | Engineering workflow and team health | Investment Profile for work allocation analysis | $38/contributor/mo (annual) | N/A |
| 10 | DX | Developer experience and productivity | Research-backed surveys and Data Studio SQL | Custom pricing | 4.5/5 |
| 11 | Cortex | Internal developer portal and scorecards | Service catalog with production-readiness scoring | Custom pricing | 4.4/5 |
| 12 | Typo | Delivery and AI impact for engineering managers | AI code reviews and DORA with code health | $20/dev/mo (annual) | 4.6/5 |
| 13 | SonarQube | Code quality and security analysis | Static analysis with quality gates and CI/CD integration | Free to $34/mo (Cloud Team) | N/A |
| 14 | Allstacks | Agentic product management and delivery intelligence | AI reviewers with evidence-backed outputs | Free to $600/year/contributor | 4.5/5 |
| 15 | Hatica | Distributed team productivity and well-being | Async stand-ups and collaboration analytics | Free to $29/member/mo | 4.7/5 |
| 16 | Harness SEI | DevOps-connected engineering insights | SDLC analytics tied to delivery pipelines | Custom pricing | 4.6/5 |
| 17 | Code Climate Velocity | Engineering workflow and delivery analytics | Delivery dashboards with industry benchmarks | Custom pricing | 4.3/5 |
| 18 | Plandek | Enterprise software delivery and DORA | 500+ metrics, AI assistant, and built-in surveys | $25 to $55/contributor/mo | 4.5/5 |
| 19 | Faros AI | AI coding spend and outcome attribution | Token engineering and model-route optimization | Custom pricing | N/A |
| 20 | Haystack | Focused delivery analytics with Slack alerts | Cycle time and PR insights with low overhead | $20/member/mo (annual) | N/A |
| 21 | Tempo | Capacity, time tracking, and portfolio planning | Jira-native workforce intelligence and capitalization | From $10/user/mo | 4.4/5 |
Best 21 software development analytics tools for 2026
1. Waydev
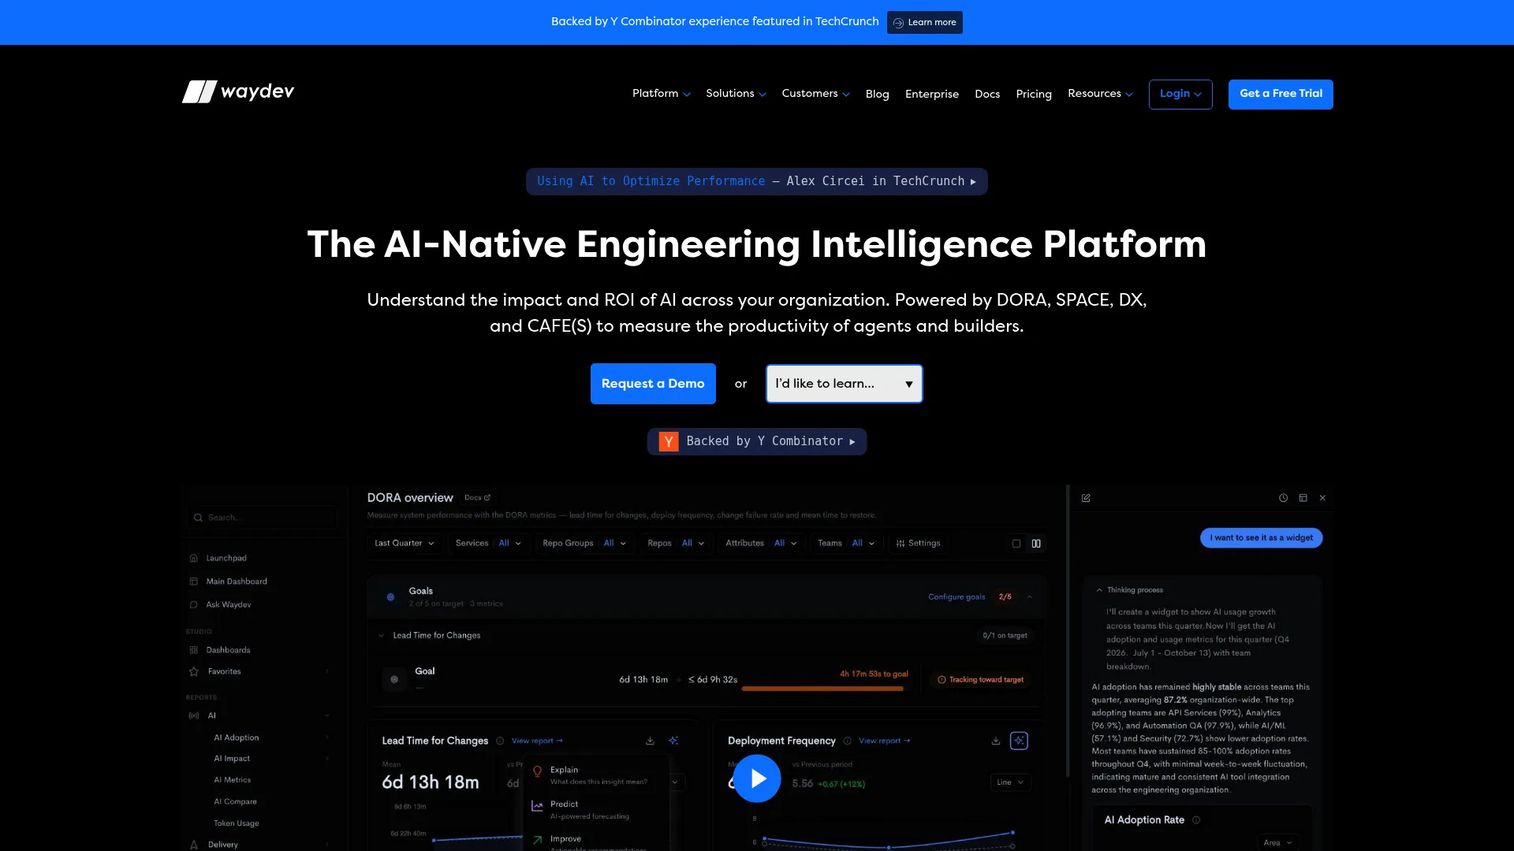
Waydev is an AI-native engineering intelligence platform that measures developer productivity, DORA metrics, AI adoption, and delivery performance across the entire engineering organization. It connects Git repositories, ticketing systems, CI/CD pipelines, and AI coding tools into a single analytics layer. The Waydev Agent lets engineering leaders query metrics in natural language, reducing the gap between data and decision. For PMs, the longitudinal baselines Waydev establishes are particularly useful for spotting delivery drift before it becomes a release risk.
Best for: Engineering and product leaders who need broad software engineering intelligence across delivery performance, AI adoption, and developer experience.
Key features
- DORA metrics, cycle time, and sprint commitment tracking
- AI adoption, impact, ROI, and spend measurement
- Developer experience and SPACE framework insights
- Waydev Agent for natural-language analytics queries
- Custom dashboards, reports, and integrations with Git, ticketing, and CI/CD tools
Why choose Waydev: Waydev excels when leadership needs to connect engineering activity, delivery performance, and AI coding tool ROI in one analytics layer without stitching together separate platforms.
Waydev pricing: A free Start Up plan covers up to 25 contributors with no credit card required. Pro runs $29 per active contributor per month (billed annually); Premium runs $49 per active contributor per month. Enterprise uses custom volume pricing.
G2 rating: 4.7/5
2. Jellyfish
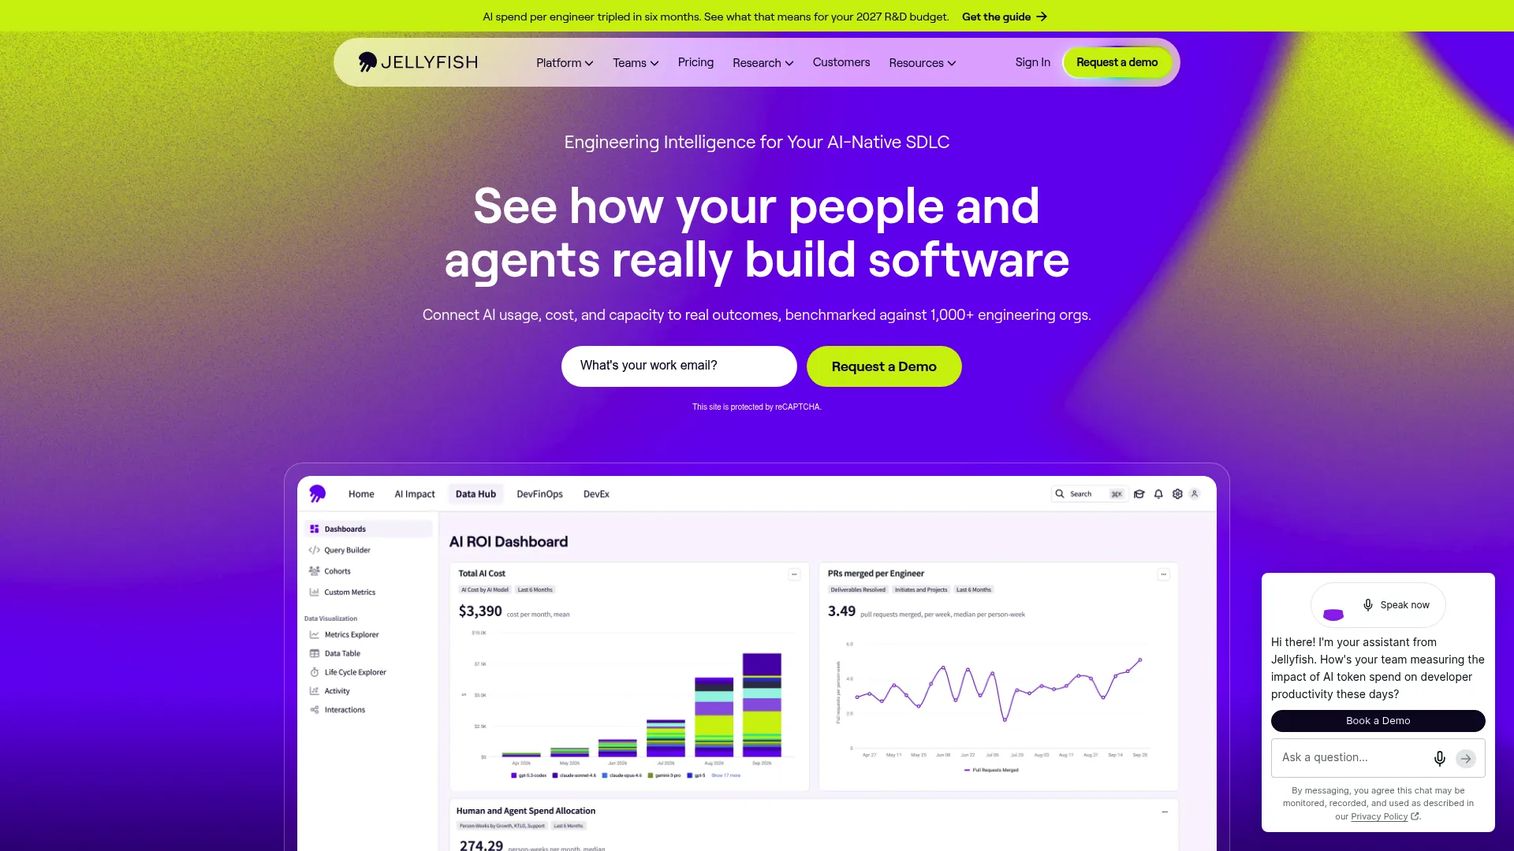
Jellyfish is a software engineering intelligence platform that connects engineering work, AI usage, cost, and delivery data directly to business outcomes. Its DevFinOps module helps product, engineering, and finance teams answer the question that most analytics tools avoid: Where exactly is engineering capacity going, and what is it producing? For PMs managing roadmaps against quarterly priorities, Jellyfish's investment allocation and delivery risk views translate engineering signals into language that boards and finance partners understand.
Best for: Engineering and R&D leaders who need unified visibility into delivery, AI impact, developer experience, and engineering investment mapped to business priorities.
Key features
- Engineering metrics including throughput, cycle time, and DORA metrics
- AI workflow intelligence: Adoption, agent sessions, and delegated engineering tasks
- AI ROI and spend analysis across vendors, teams, and models
- Developer experience surveys and insights
- Investment allocation, benchmarking, and software capitalization reporting
Why choose Jellyfish: Choose Jellyfish when the core question is not "how fast are we shipping?" but "where is engineering capacity going, and does it match roadmap priorities?" It's particularly strong for teams that need to report engineering investment to finance or executive stakeholders.
Jellyfish pricing: Jellyfish offers three modules: AI Impact, Developer Productivity, and DevFinOps. All are quote-based with pricing set by seat count and selected modules.
G2 rating: 4.5/5
3. LinearB
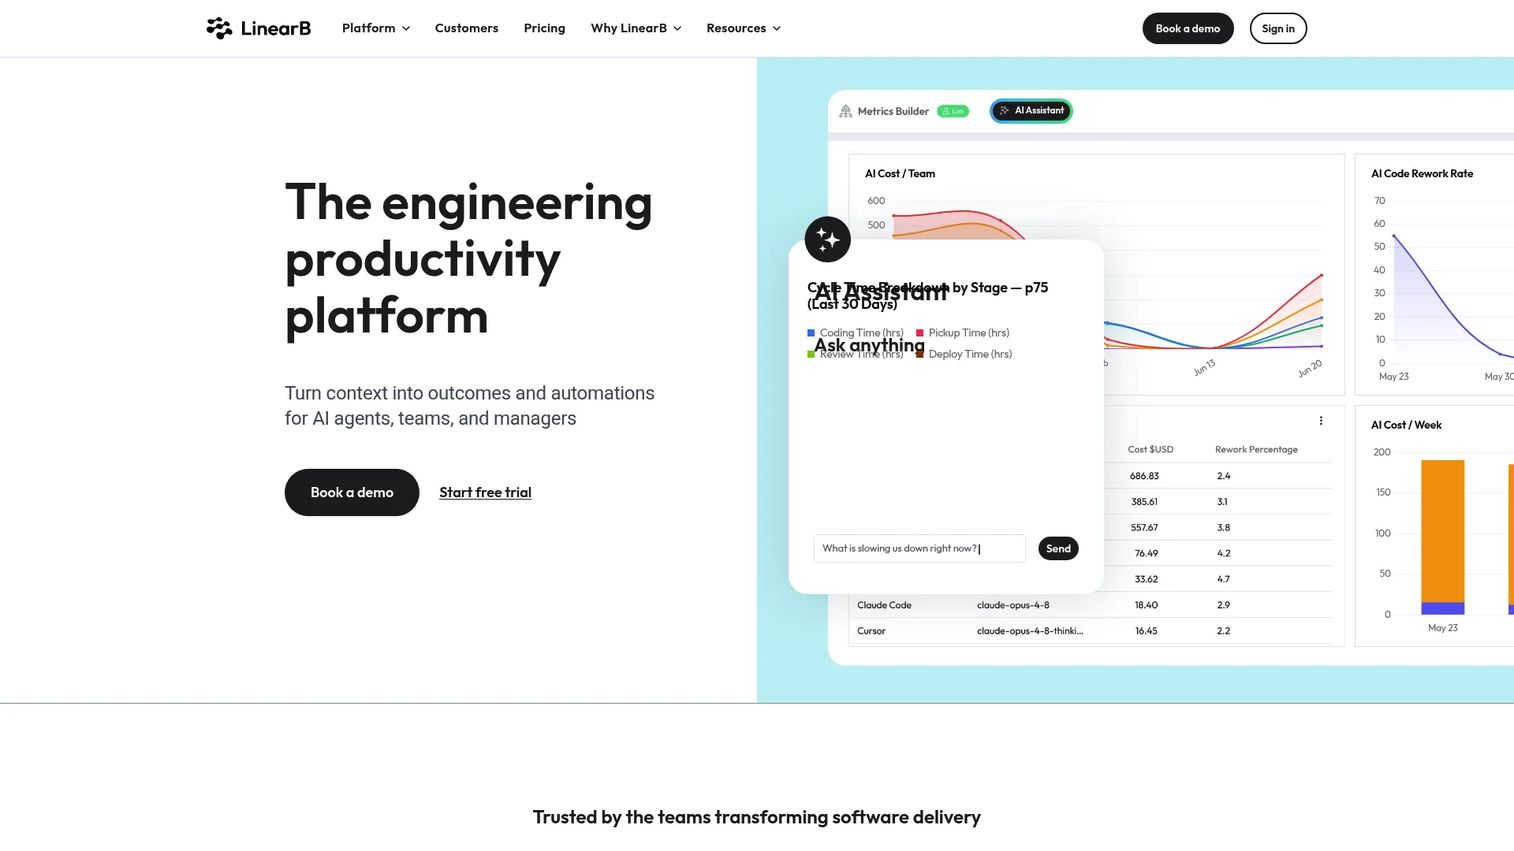
LinearB is an engineering productivity platform that combines delivery workflow analytics, AI impact measurement, and pull request automation in one tool. Its WorkerB automations reduce manual PR management, and its AI impact dashboards help engineering teams establish baselines for Copilot and other AI coding assistants before claiming ROI. For PMs evaluating capacity planning software, LinearB's project tracking and resource allocation features add a planning layer on top of delivery analytics.
Best for: Engineering organizations seeking visibility into AI and software delivery performance alongside automated workflow improvements.
Key features
- AI impact and developer productivity insights
- Programmable DevOps workflows and PR automation
- DORA and delivery metrics
- Developer experience surveys
- Project tracking, forecasting, and resource allocation
Why choose LinearB: LinearB fits teams where delivery flow problems are the primary pain: Review delays, stale PRs, and inconsistent deployment cadence. Its PR automation turns measurement into active workflow improvement rather than passive reporting.
LinearB pricing: Essentials starts at $29 per user per month (billed annually) for teams with 50 or more developers. Enterprise runs $59 per user per month and adds forecasting, resource allocation, capitalization, and on-premises agents. A 45-day free trial is available.
G2 rating: 4.6/5
4. GitHub
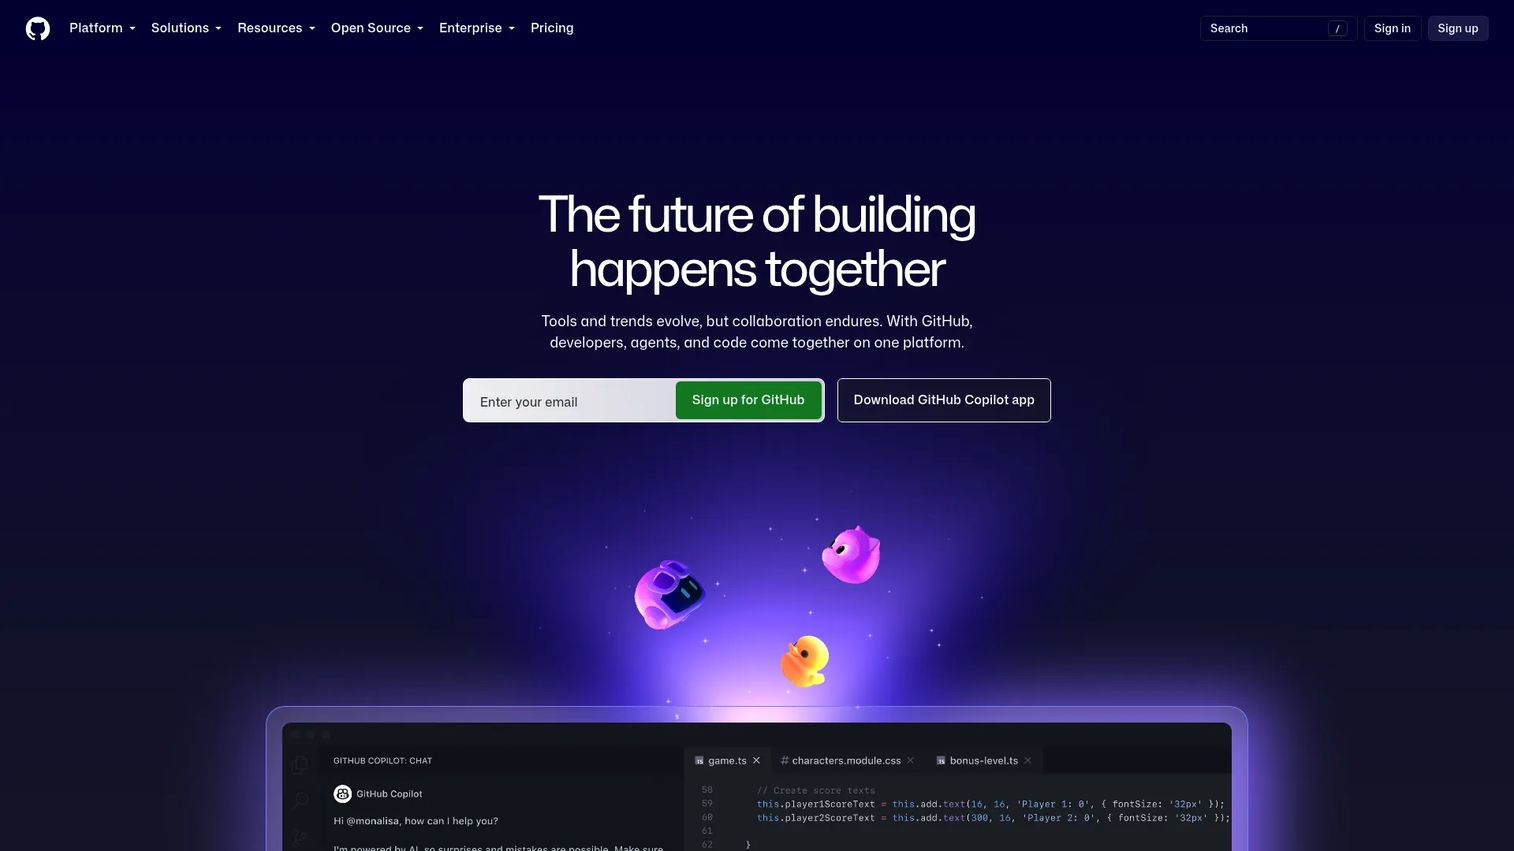
GitHub is the developer platform where most engineering teams already live. Its native analytics cover repository activity, pull request flow, GitHub Actions performance, security scanning results, and Copilot usage metrics. For teams evaluating whether they need a separate engineering intelligence platform, GitHub's built-in signals are a useful starting point. The distinction matters: GitHub analytics describe activity inside a single platform, while dedicated engineering intelligence tools correlate that data with Jira, incidents, and deployment outcomes across the full software delivery lifecycle.
Best for: Software teams that want native repository and workflow analytics inside their existing development platform before adding a separate intelligence layer.
Key features
- Pull request analytics and code review flow
- GitHub Actions CI/CD metrics
- Application security: Secret scanning, Dependabot, dependency review
- Copilot usage and impact metrics
- Repository insights and code collaboration data
Why choose GitHub: GitHub analytics work best as a starting layer when the team already lives in GitHub and wants signal before committing to a dedicated analytics platform. Copilot metrics alone make it worth evaluating for teams running AI impact measurement in 2026.
GitHub pricing: Free for public and personal repositories. Team runs $4 per user per month for the first 12 months. Enterprise runs $21 per user per month for the first 12 months.
G2 rating: 4.7/5
5. Swarmia
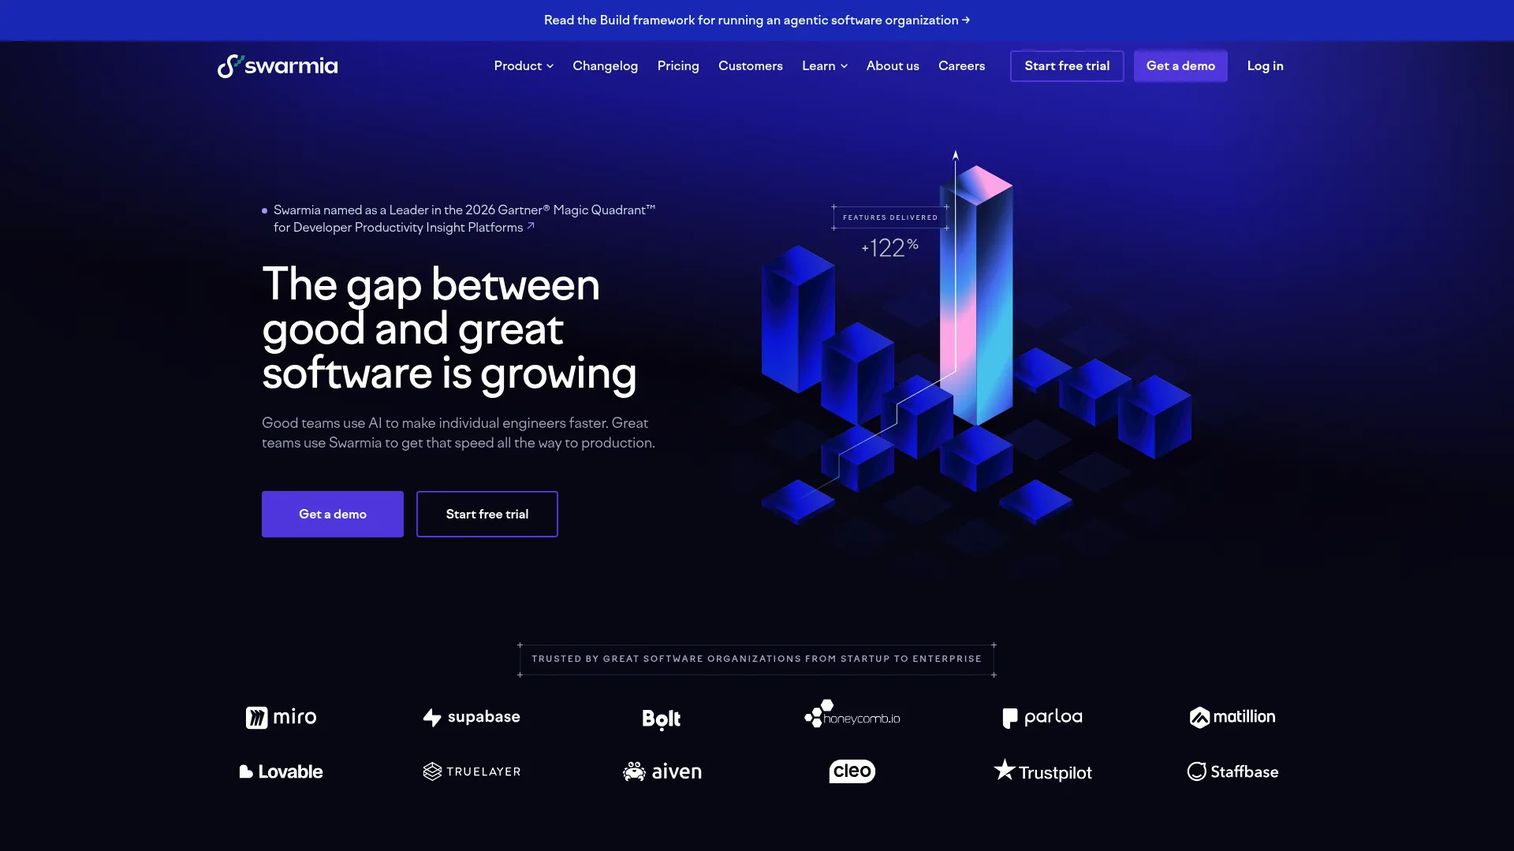
Swarmia is an engineering intelligence platform built around team effectiveness, DORA metrics, working agreements, and developer experience. Its modular pricing lets organizations start with delivery analytics and add AI adoption tracking, developer surveys, or software capitalization as they scale. Swarmia takes a notably responsible position on measurement: Its working agreements feature helps teams set expectations collaboratively rather than imposing top-down activity targets. That framing earns developer trust, which is often the harder problem to solve.
Best for: Engineering organizations seeking delivery analytics combined with developer experience measurement, particularly those scaling teams or navigating AI tooling adoption.
Key features
- DORA metrics, code insights, and CI visibility
- AI adoption, activity, impact, and cost metrics
- Developer experience surveys and Slack reminders
- Investment balance, focus summaries, and software capitalization
- Integrations with GitHub, GitLab, Jira, Linear, Slack, and AI coding tools
Why choose Swarmia: Swarmia fits teams that want measurement to drive behavior change at the team level, not produce a scoreboard. Its modular add-on model also means you pay for the capabilities you use rather than bundled features you won't.
Swarmia pricing: Free for companies with fewer than 10 developers. Modular add-ons start at $5 per developer per month (AI adoption and cost). Standard runs $45 and Enterprise $55 per developer per month, both billed annually.
G2 rating: 4.4/5
6. GitLab
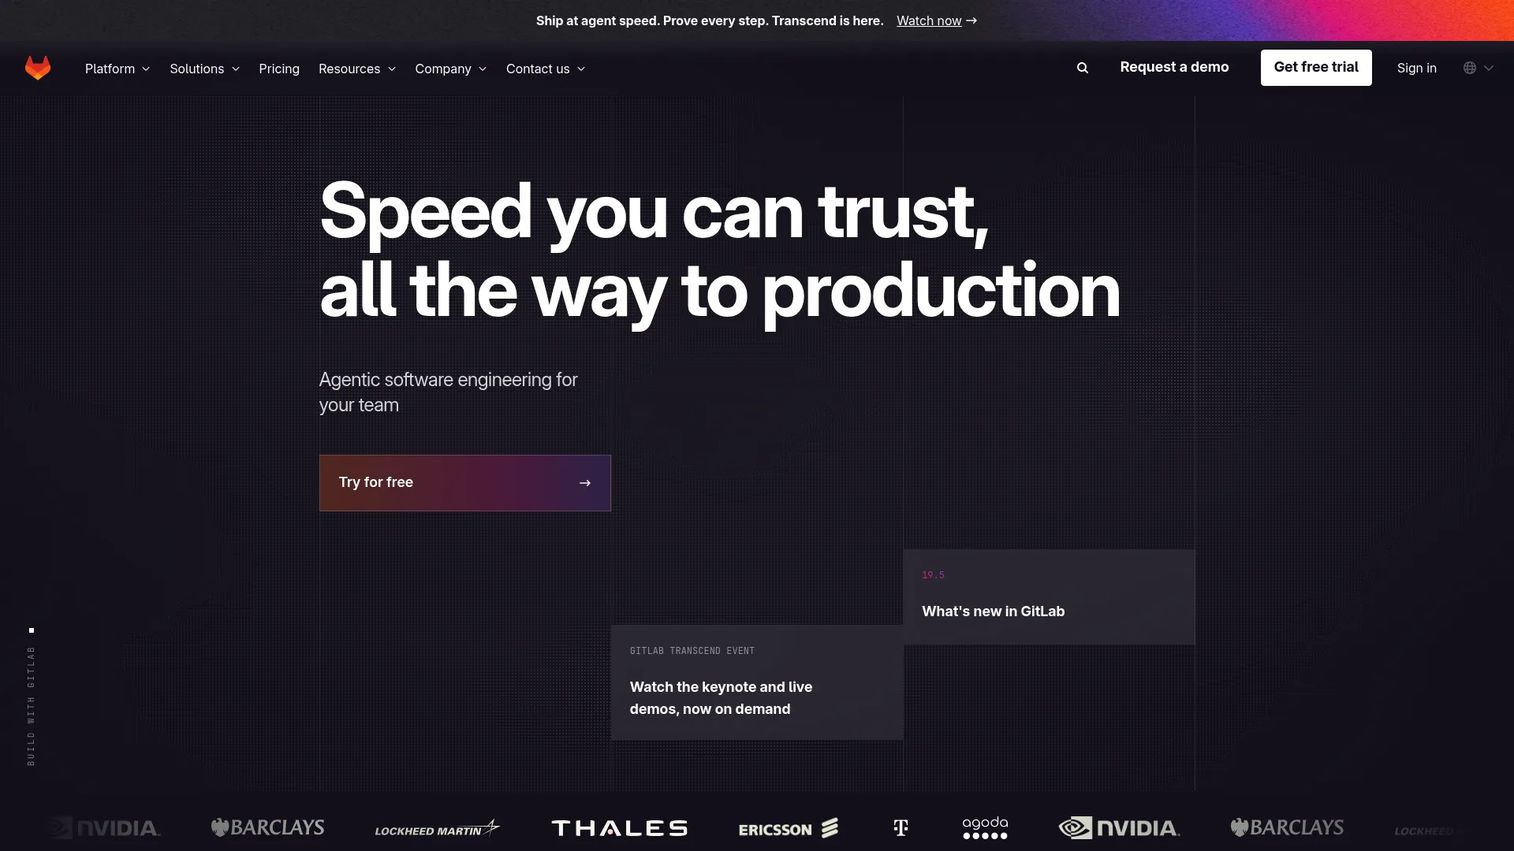
GitLab is an intelligent DevSecOps platform with built-in value stream analytics, DORA metrics, CI/CD reporting, security dashboards, and issue analytics. For teams that run source control, pipelines, and planning inside GitLab, the analytics sit where the work happens rather than requiring a separate integration. Value stream management at the Ultimate tier gives engineering and product leaders a view of flow efficiency across the entire software delivery process, from idea to deployment.
Best for: Organizations already running source control, CI/CD, and security workflows inside GitLab who want platform-native delivery analytics.
Key features
- Value stream analytics and flow efficiency metrics
- DORA metrics across deployment frequency, lead time, and change failure rate
- CI/CD pipeline analytics and security dashboards
- Issue and merge request analytics
- AI-assisted development through the GitLab Duo Agent Platform
Why choose GitLab: Choose GitLab when your team already uses it as the primary development platform. Adding a separate analytics tool means another integration to maintain. GitLab's native analytics remove that overhead for teams already committed to the platform.
GitLab pricing: Free tier includes source code management, CI/CD, and basic SAST. Premium runs $29 per user per month (billed annually). Ultimate uses custom pricing with advanced security, compliance, and value stream management.
G2 rating: 4.5/5
7. Jira
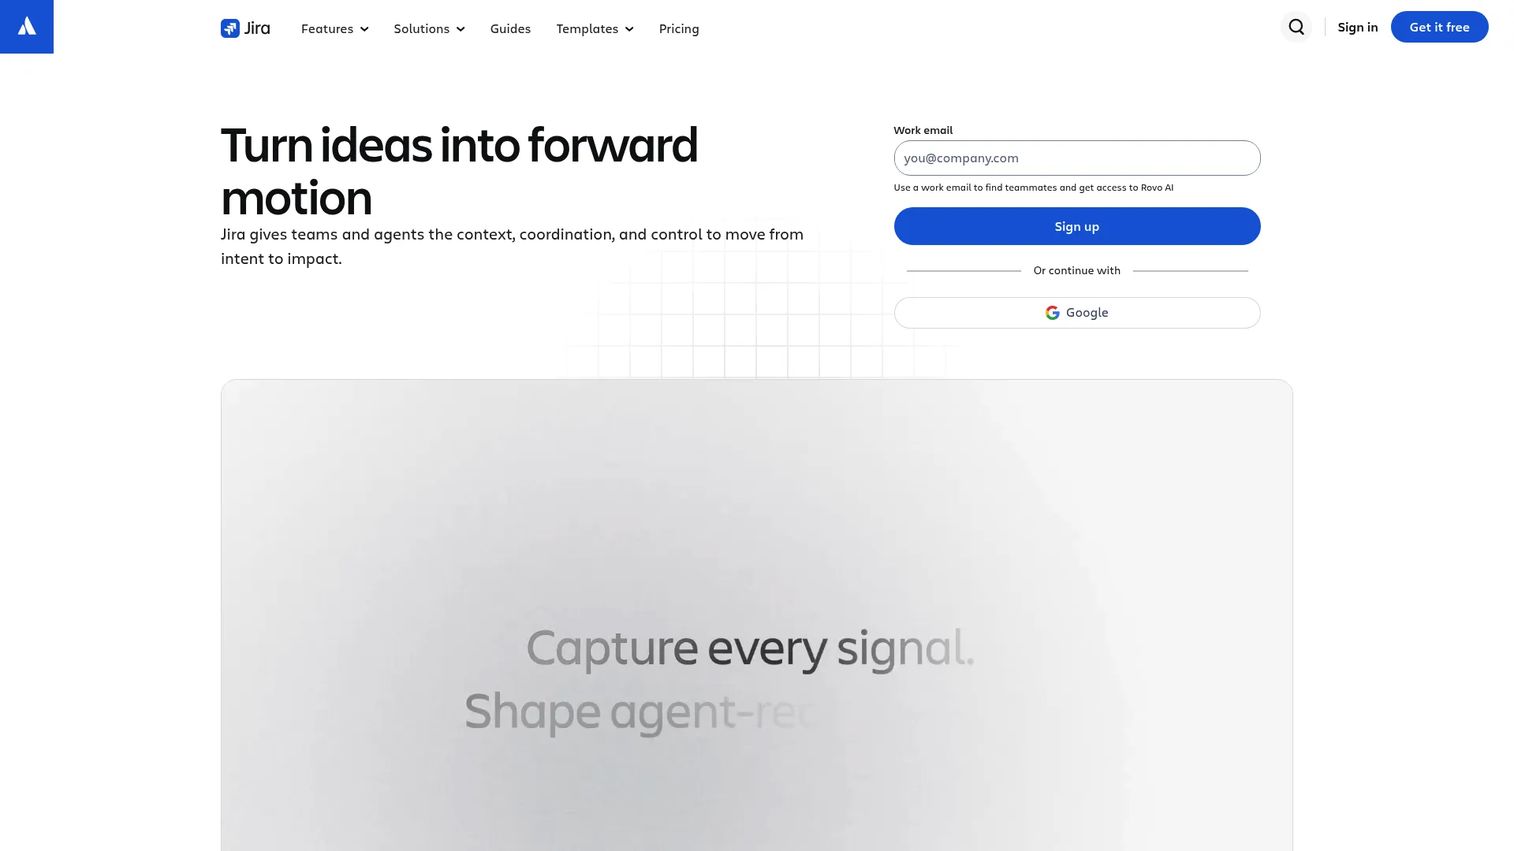
Jira is the work management and issue-tracking system that most product and engineering teams already update daily. Its sprint reports, velocity charts, burndown charts, control charts, and roadmap views make it the most widely used source of delivery data for PMs. The important caveat is that Jira is not a full engineering intelligence platform: It captures what teams log, not what repositories, pipelines, or incidents tell you independently. Combined with a dedicated analytics layer, though, Jira data is essential context for delivery health. For teams evaluating best product management tools, Jira's customizable workflows and integrations make it a natural anchor in the stack.
Best for: Agile product and engineering teams that need work-item analytics tied to planning, sprint health, and roadmap execution.
Key features
- Sprint reports, velocity charts, and burndown analytics
- Control charts and cycle time visibility
- Roadmap planning and dependency management
- Customizable workflows and no-code automation
- Atlassian Marketplace integrations with engineering analytics tools
Why choose Jira: Jira is strongest as the planning and execution layer that your engineering analytics tools pull from, rather than as a standalone analytics platform. PMs already live here, so it's often the lowest-friction data source for delivery tracking.
Jira pricing: Free for up to 10 users. Standard and Premium pricing varies by user count and billing cycle. Enterprise requires contacting Atlassian sales.
G2 rating: 4.3/5
8. Azure DevOps
Azure DevOps is Microsoft's suite of developer services covering agile planning (Boards), source control (Repos), CI/CD (Pipelines), testing (Test Plans), and package management (Artifacts). For Microsoft-centric engineering organizations, it provides delivery analytics across work items, builds, releases, and test results in a single, governed environment. Its native Power BI integration is a meaningful differentiator for engineering leaders who need to surface delivery data inside executive reporting without building a separate data pipeline.
Best for: Microsoft-centric development teams that need integrated analytics across planning, code, pipelines, and testing within a single platform.
Key features
- Boards analytics: Sprint velocity, cumulative flow, and work-item trends
- Pipeline analytics: Build success rates, duration trends, and deployment frequency
- Test analytics across manual and automated test runs
- Repository insights and branch analytics
- Power BI integration for custom engineering dashboards
Why choose Azure DevOps: It fits engineering organizations already committed to the Microsoft stack. The Power BI integration specifically helps teams that need to blend engineering delivery data with finance and operations reporting without a third-party analytics tool.
Azure DevOps pricing: First five users are free on the Basic plan. Beyond that, Basic costs $6 per user per month. Basic with Test Plans costs $52 per user per month. Azure Pipelines includes one free Microsoft-hosted parallel job with 1,800 minutes monthly.
G2 rating: 4.2/5
9. Pluralsight Flow
Pluralsight Flow is an engineering intelligence platform that analyzes code repository and agile tool data to improve software delivery and team health. Its Investment Profile feature helps engineering leaders see how developer time distributes across product features, technical debt, and unplanned work, which is the kind of capacity visibility that makes conversations between PMs and engineering managers more productive. Flow connects to GitHub, GitLab, Bitbucket, Jira, and Azure DevOps, covering most enterprise engineering stacks. Teams looking at advanced planning and scheduling software will find Flow's work allocation analysis a useful complement to planning tools.
Best for: Engineering organizations seeking data-driven visibility into delivery workflows, developer experience, team health, and software investment allocation.
Key features
- DORA metrics and workflow diagnostics
- Pull request workflow and review analytics
- Team health insights and retrospectives
- Investment Profile for engineering work allocation analysis
- Integrations with GitHub, Bitbucket, GitLab, Jira, Rally, and Azure DevOps
Why choose Pluralsight Flow: Flow's strengths are longitudinal workflow analytics and Investment Profile. It fits teams that want to understand how engineering capacity is actually distributed, not just how fast PRs are merging.
Pluralsight Flow pricing: Core runs $38 per contributor per month (billed annually) with foundational metrics, integrations, and notifications. Plus runs $50 per contributor per month and adds team health insights, retrospectives, Investment Profile, and API access.
10. DX
DX is an engineering intelligence platform that combines software delivery data with developer feedback to measure and improve engineering productivity. Its Snapshots surveys are grounded in research-backed measurement rather than vendor-invented metrics, which makes the qualitative data more defensible in leadership conversations. The Data Studio module gives analytics teams direct SQL access to engineering data for custom reporting. For product leaders who want to understand why engineering velocity is changing, not just whether it changed, DX's combination of quantitative delivery data and qualitative developer sentiment fills a gap that most analytics platforms ignore.
Best for: Engineering organizations that prioritize developer experience measurement alongside delivery performance, particularly those with research-oriented engineering operations teams.
Key features
- Developer experience surveys and benchmarking through Snapshots
- Engineering analytics, dashboards, and custom SQL analysis through Data Studio
- Scorecards and Software Catalog for standards tracking
- AI-powered summaries, SQL generation, and code insights
- Research-backed measurement frameworks
Why choose DX: DX fits when leadership needs to understand the qualitative reasons behind quantitative trends. It's particularly strong for organizations treating developer experience as a strategic input to retention and productivity, not just a survey exercise.
DX pricing: Custom pricing; contact DX for a quote. No public tiers were confirmed on the vendor site.
G2 rating: 4.5/5
11. Cortex
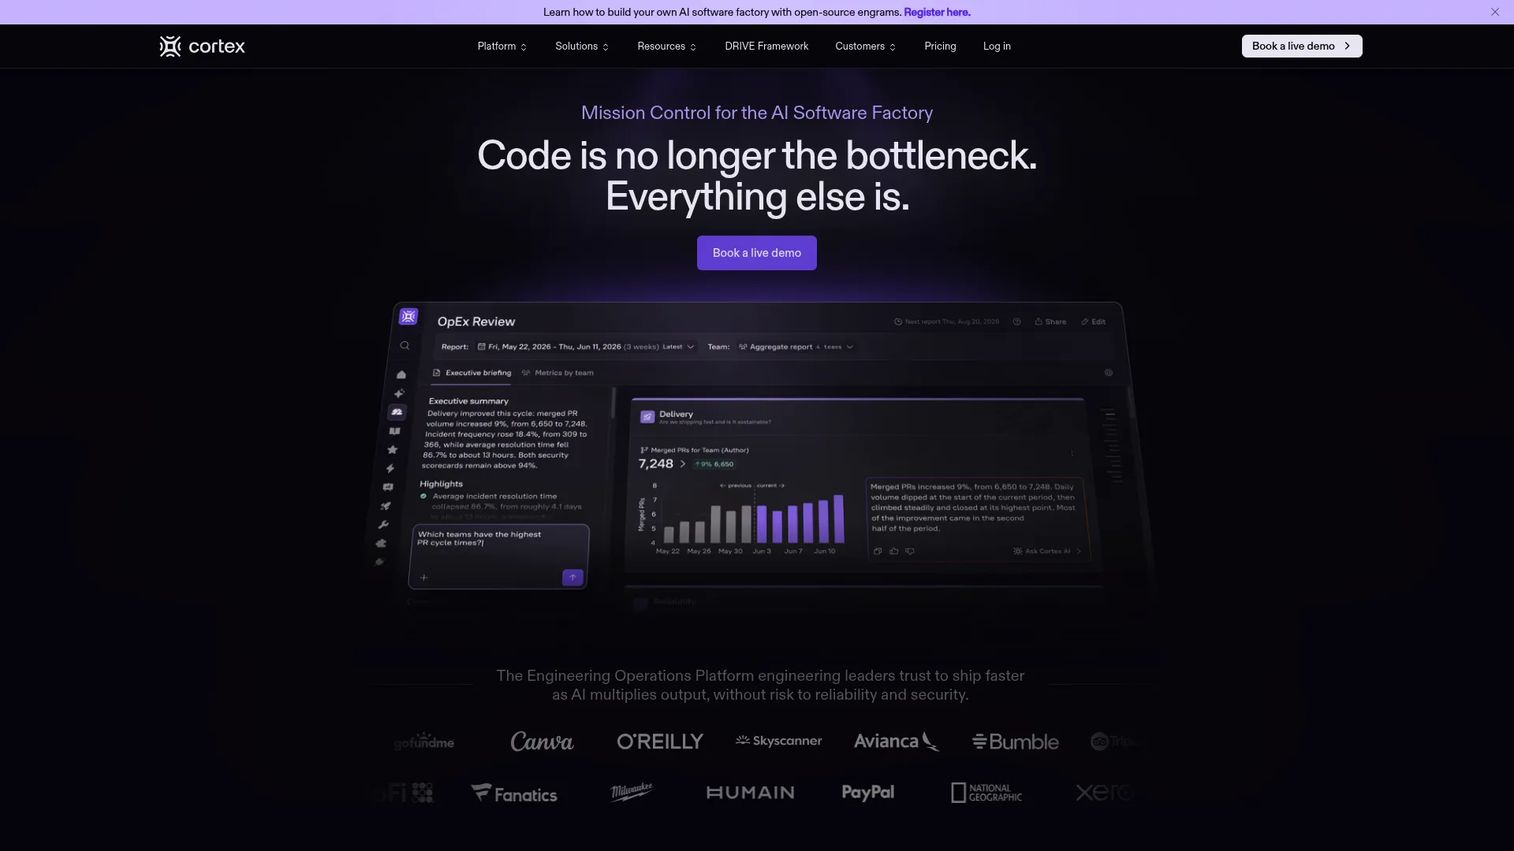
Cortex is an engineering operations platform and internal developer portal. Rather than measuring delivery flow or DORA metrics, Cortex focuses on service ownership, production readiness, and engineering standards. Its Scorecards continuously assess whether services meet security, compliance, and operational criteria. For platform engineering teams and engineering operations leaders, this visibility into service health and team ownership is a distinct analytics problem from cycle time or deployment frequency. Cortex also enables developer self-service workflows, which reduces the engineering coordination overhead that PMs often absorb.
Best for: Platform engineering and engineering operations teams that need service ownership clarity, standards enforcement, and developer self-service across large-scale service portfolios.
Key features
- Service and resource catalogs with ownership and dependencies
- Scorecards for production readiness, security, and compliance assessment
- Self-service workflows, scaffolding, and engineering task automation
- Internal developer portal with centralized software context
- Integrations across common DevOps and cloud toolchains
Why choose Cortex: Cortex solves a different problem than most engineering analytics tools. Choose it when the pain is service sprawl, unclear ownership, or inconsistent engineering standards rather than delivery flow or DORA metrics.
Cortex pricing: Custom per-seat pricing based on organization size. Contact Cortex for a quote.
G2 rating: 4.4/5
12. Typo
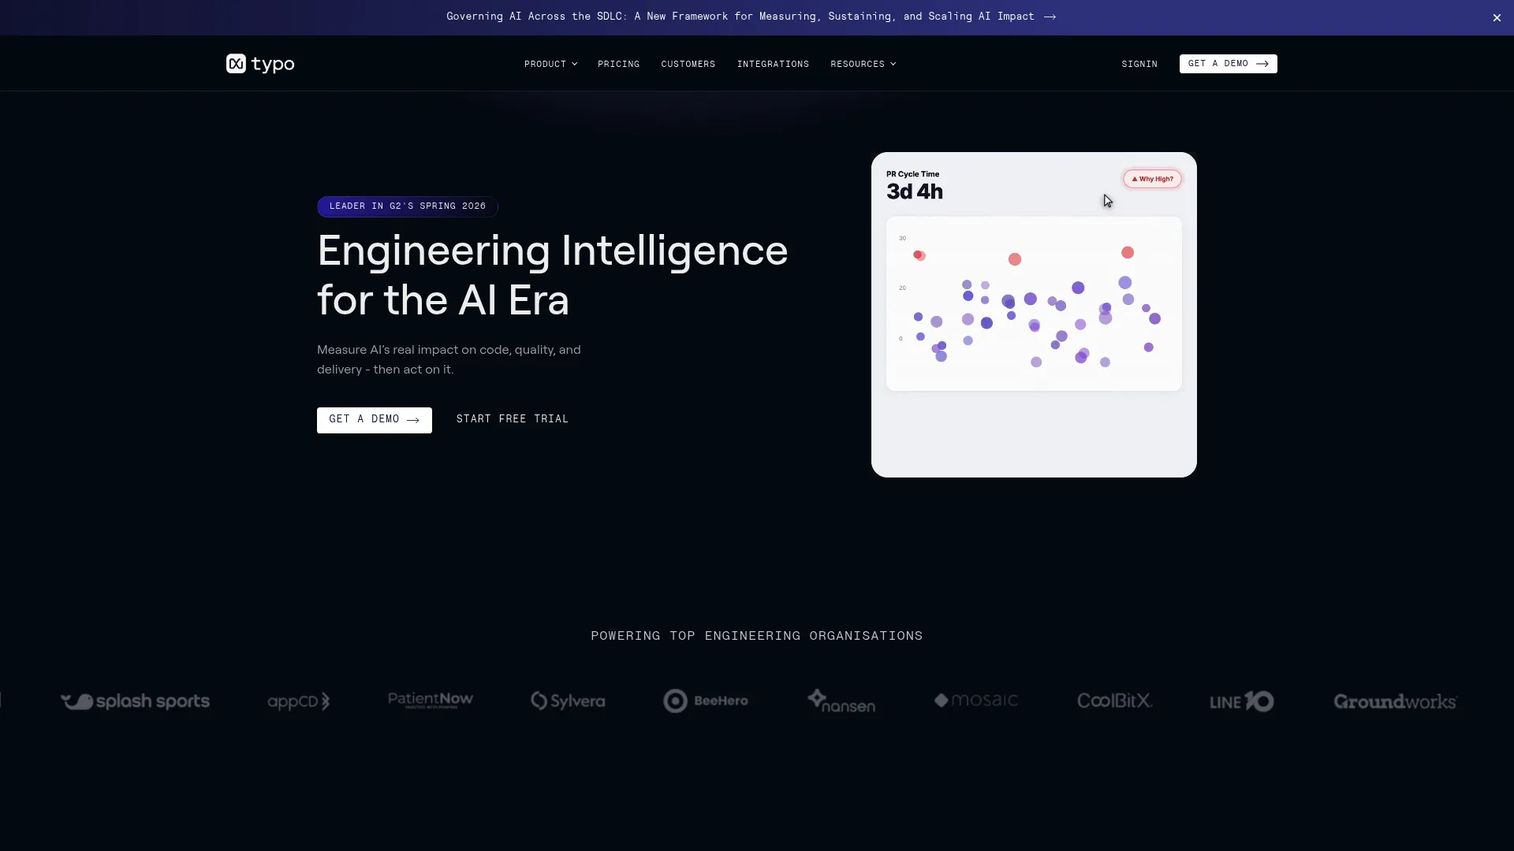
Typo is an engineering intelligence platform for measuring AI impact, software delivery, code quality, and developer experience. Its AI code review and code-fix features distinguish it from pure analytics tools: Typo actively intervenes in the PR workflow rather than only reporting on it. For engineering managers who want both delivery analytics and AI-assisted code quality improvement from one tool, Typo covers both without requiring separate integrations.
Best for: Engineering leaders and teams seeking real-time visibility into delivery performance, AI coding impact, and code health in a focused platform.
Key features
- AI impact measurement and developer productivity insights
- AI code reviews and automated code-fix suggestions
- DORA metrics, sprint insights, and pull request analytics
- Developer experience surveys and benchmarking
- Ask AI engineering assistant for metrics queries
Why choose Typo: Typo works well for engineering managers who want measurement and active code quality improvement from a single tool. Its AI code review capability is a meaningful differentiator against analytics-only platforms.
Typo pricing: Starter runs $20 per developer per month (billed annually). Pro runs $28 per developer per month. Enterprise uses custom pricing. A 14-day free trial is available without a credit card.
G2 rating: 4.6/5
13. SonarQube
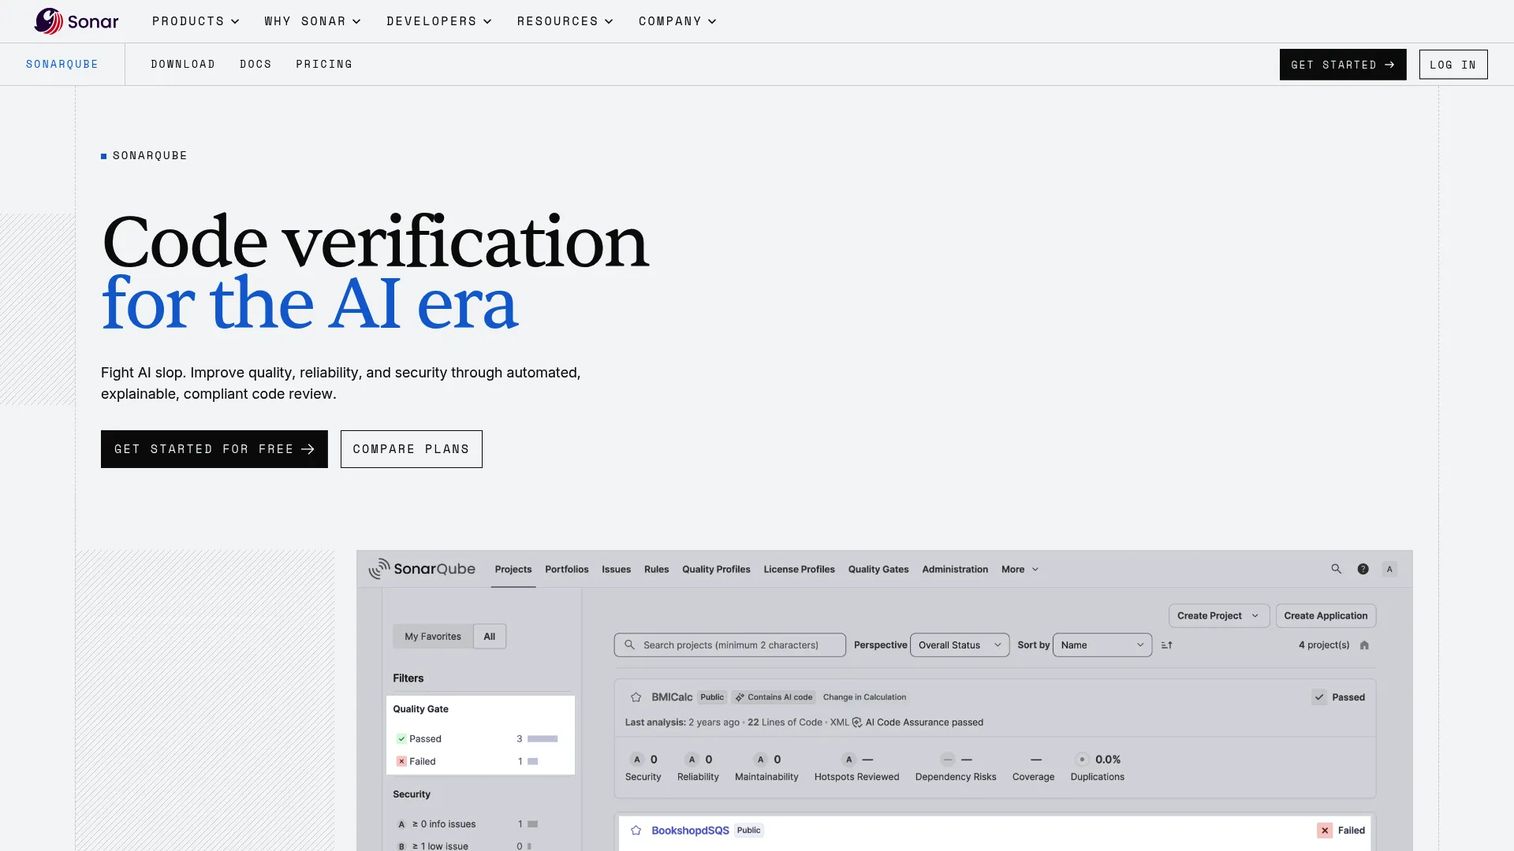
SonarQube is a code verification platform for automated code quality, security, and AI-generated code analysis. It sits in a different part of the engineering analytics landscape than DORA or delivery flow tools. SonarQube's quality gates block deployments when maintainability, reliability, or security thresholds are not met, making it a risk management tool as much as a measurement tool. For PMs, SonarQube's technical debt visibility is directly relevant to release confidence: If quality gates are consistently failing on a release branch, that's a delivery risk signal that sprint velocity alone won't surface. Teams researching ai software testing tools will find SonarQube a strong complement for code-level quality assurance.
Best for: Development teams and enterprises needing automated code quality, security, and AI-generated code verification integrated into CI/CD pipelines.
Key features
- Static code analysis covering maintainability, reliability, and security
- SAST, taint analysis, secrets detection, and IaC scanning
- Quality gates that enforce standards before code merges or deploys
- CI/CD and IDE integrations with remediation guidance
- Technical debt tracking and coverage insights
Why choose SonarQube: SonarQube answers a different question than engineering intelligence platforms. Use it when quality risk, security vulnerabilities, or technical debt accumulation are the primary threat to release confidence, not delivery flow.
SonarQube pricing: A free Community Build tier supports private projects up to 50,000 lines of code. SonarQube Cloud Team starts at $34 per month for up to 100,000 lines of code. Enterprise uses custom pricing.
14. Allstacks
Allstacks has evolved into an agentic platform for product management and software development. Its AI agents research and define product requirements, and its adversarial AI reviewers pressure-test plans against existing tickets, commits, and customer calls. On the analytics side, Allstacks provides delivery risk detection, engineering performance measurement, and automated software cost capitalization. For PMs who want evidence-backed outputs tracing claims to actual engineering work, rather than status summaries, Allstacks connects the product definition and delivery tracking problems in one platform.
Best for: Product and engineering teams that need shared context for product definition, delivery intelligence, and software cost capitalization in a single platform.
Key features
- AI agents for product research and feature definition
- Adversarial AI reviewers for pressure-testing requirements
- Evidence-backed outputs tracing claims to tickets, commits, and documents
- Delivery risk detection and engineering performance measurement
- Automated, audit-ready software cost capitalization reports
Why choose Allstacks: Allstacks fits product and engineering teams that want AI-assisted product definition and delivery intelligence together. Its adversarial reviewer model is a distinctive approach to reducing requirements risk before engineering begins.
Allstacks pricing: Product Studio Starter is free to start with usage and credit limits. Growth runs $400 per year per contributor; Enterprise runs $600 per year per contributor. A Standalone plan for Software Engineering Intelligence or Capitalization runs $200 per year per contributor.
G2 rating: 4.5/5
15. Hatica
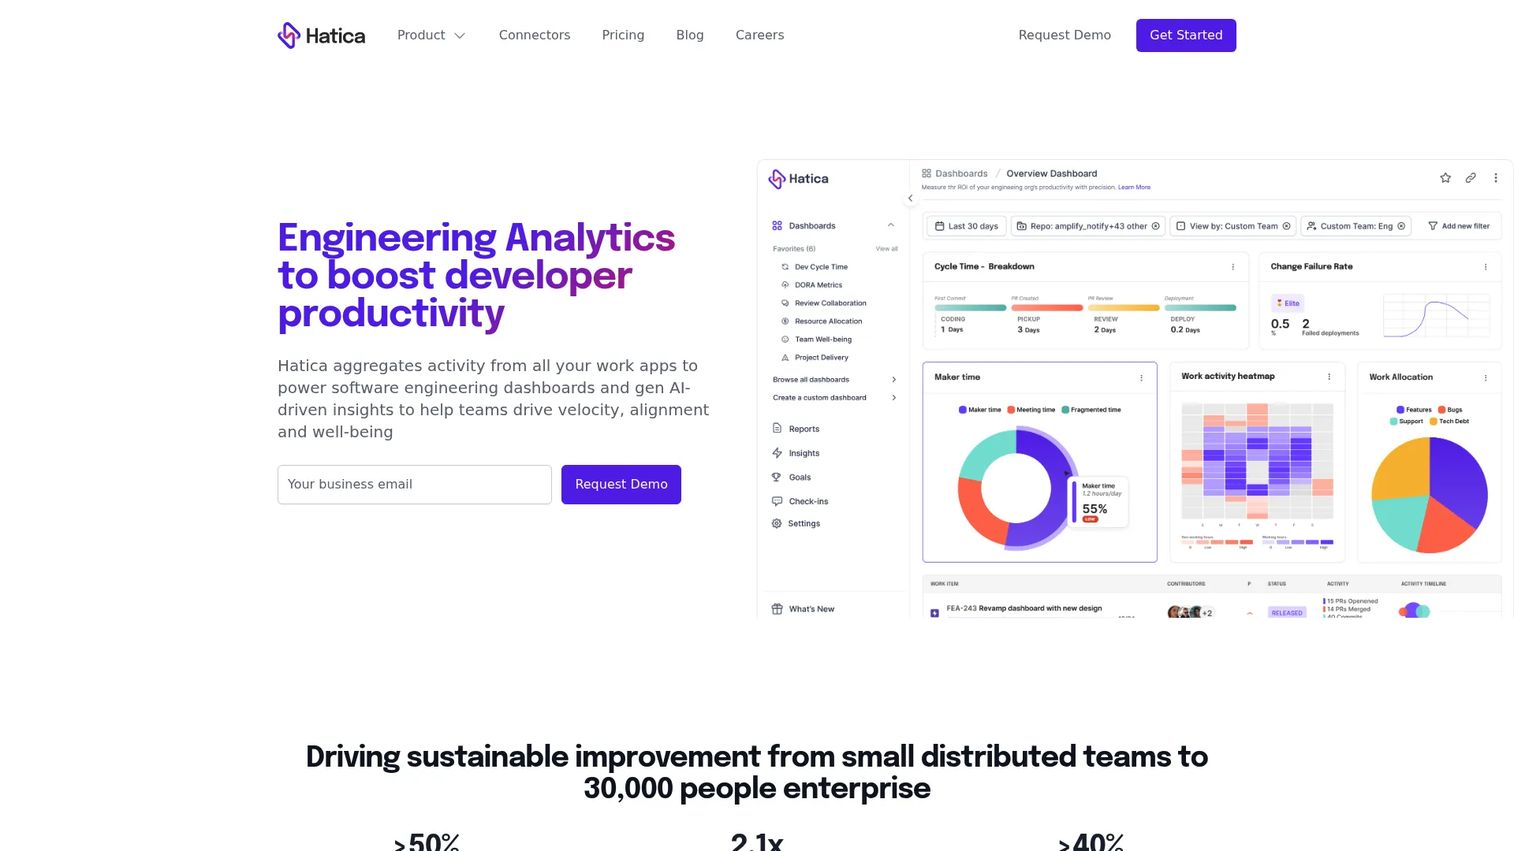
Hatica is an engineering analytics platform that combines Git, project management, and collaboration data to provide insights into developer productivity, workflow performance, and team well-being. Its automated async stand-ups and scheduled reports help distributed teams maintain engineering visibility without synchronous overhead. For engineering leaders managing remote or hybrid teams across multiple time zones, Hatica's collaboration analytics and well-being metrics add a layer that pure delivery analytics miss.
Best for: Distributed engineering teams that need productivity, collaboration, and developer experience analytics alongside DORA and workflow metrics.
Key features
- DORA metrics, velocity, throughput, and sprint analytics
- Automated async stand-ups, check-ins, and scheduled reports
- Developer well-being and collaboration analytics
- Custom dashboards and query builder
- Integrations with Git, Jira, Slack, CI/CD, and incident management tools
Why choose Hatica: Hatica is particularly strong for distributed teams where engineering visibility is harder to maintain without synchronous rituals. Its stand-up automation reduces meeting overhead while keeping delivery data current.
Hatica pricing: Free plan covers unlimited team members, activity dashboards, DevEx surveys, and one month of history. Pro runs $19 per member per month. Business runs $29 per member per month. Enterprise uses custom pricing.
G2 rating: 4.7/5
16. Harness SEI
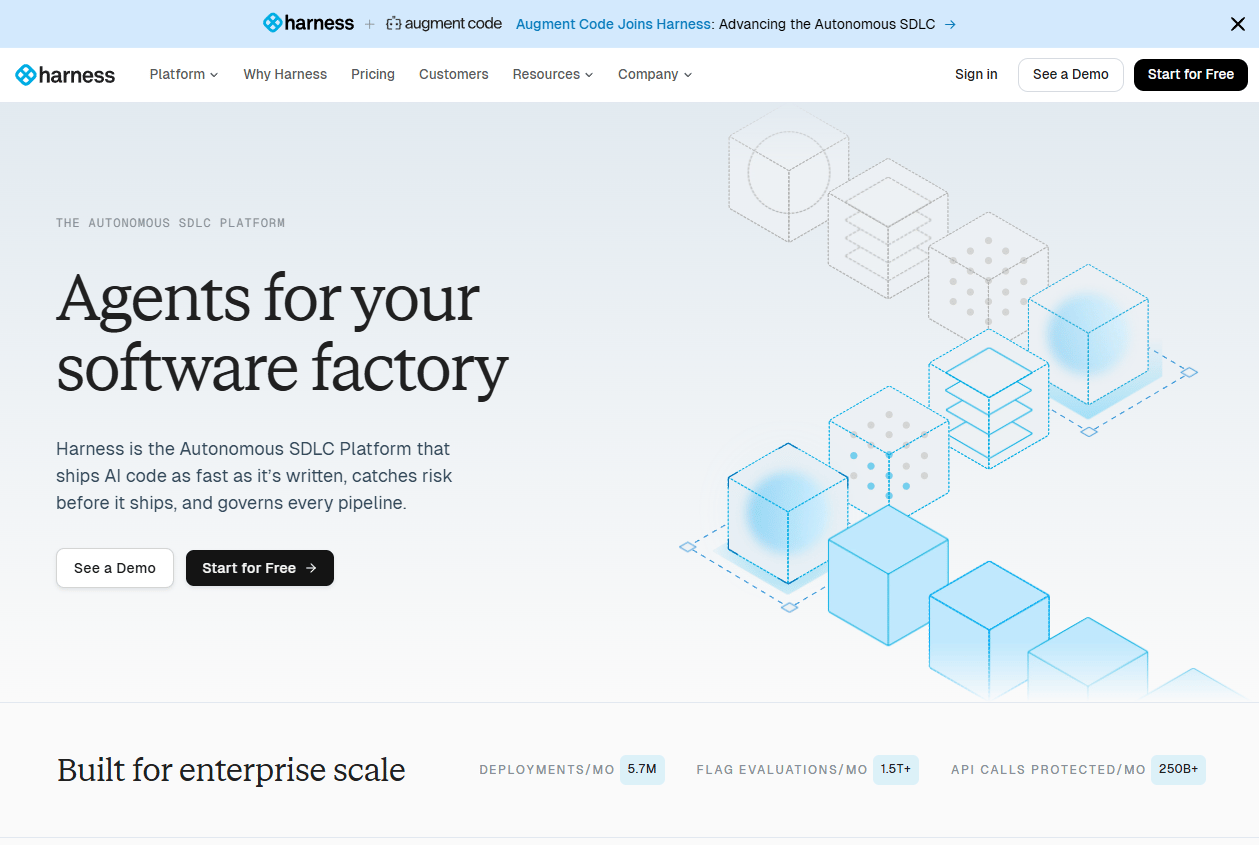
Harness SEI provides Software Engineering Insights within the broader Harness DevOps platform. It connects engineering metrics, CI/CD data, DORA metrics, and SDLC visibility in one place, which is the core differentiator for teams already using Harness for delivery automation. With over 40 integrations across GitHub, GitLab, Bitbucket, Jira, PagerDuty, and Azure, SEI consolidates engineering data without requiring a separate analytics vendor. For engineering organizations running delivery automation and wanting to measure its impact from the same platform, this reduces integration complexity meaningfully.
Best for: DevOps-heavy engineering organizations that want software engineering insights connected directly to their delivery pipelines and CI/CD workflows.
Key features
- DORA dashboards: Deployment frequency, lead time, change failure rate, and mean time to restore
- Developer productivity insights covering volume, output, and collaboration
- 40+ integrations with GitHub, GitLab, Bitbucket, Jira, and Azure
- Pre-built and custom reports and dashboards
- Drilldowns into teams, PRs, work items, and code changes
Why choose Harness SEI: SEI fits teams already running Harness for CI/CD and wanting analytics in the same platform. It reduces vendor sprawl for organizations that prefer fewer, deeper integrations over best-of-breed point solutions.
Harness SEI pricing: SEI is an Enterprise module within Harness. Contact Harness sales for pricing. No standalone public price is displayed.
G2 rating: 4.6/5
17. Code Climate Velocity
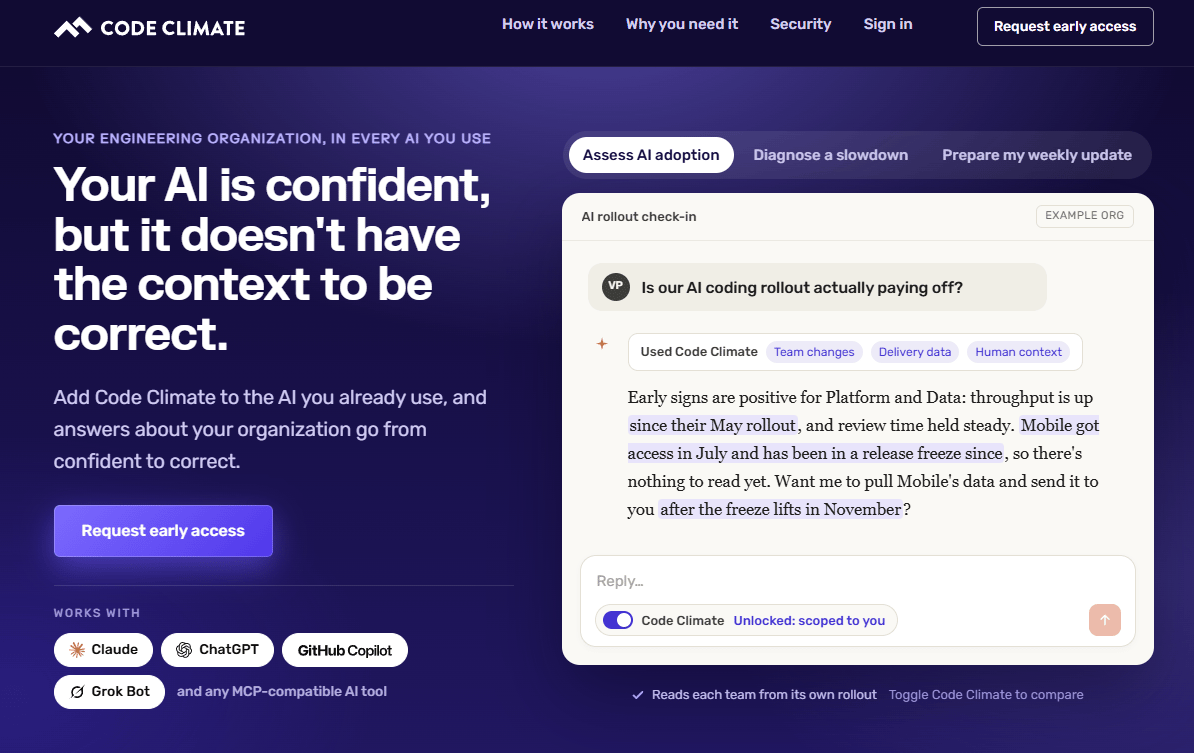
Code Climate Velocity is an engineering intelligence platform that provides data-driven visibility into engineering capacity, delivery performance, code quality, and team workflow. Its dashboards cover delivery analytics, customizable reports, and industry benchmarks that engineering leaders can use to contextualize their team's performance against market norms. Code Climate also supports on-premises source control through a Velocity Agent, which is relevant for enterprises with compliance constraints around cloud-hosted code data.
Best for: Enterprise engineering organizations seeking delivery analytics, workflow visibility, and industry benchmarking with on-premises source control support.
Key features
- Engineering dashboards and delivery metrics
- Analytics and customizable reports
- Industry benchmarks for contextualizing team performance
- Team and organization-level insights
- On-premises SCM support through Velocity Agent
Why choose Code Climate Velocity: Code Climate Velocity fits enterprise teams that need delivery analytics with on-premises data control options and industry benchmarking context. Its combination of cloud and on-premises deployment paths suits organizations with strict data residency requirements.
Code Climate Velocity pricing: Pricing was not confirmed from the vendor's first-party pricing page at generation time. Contact Code Climate directly for current packaging and pricing.
G2 rating: 4.3/5
18. Plandek
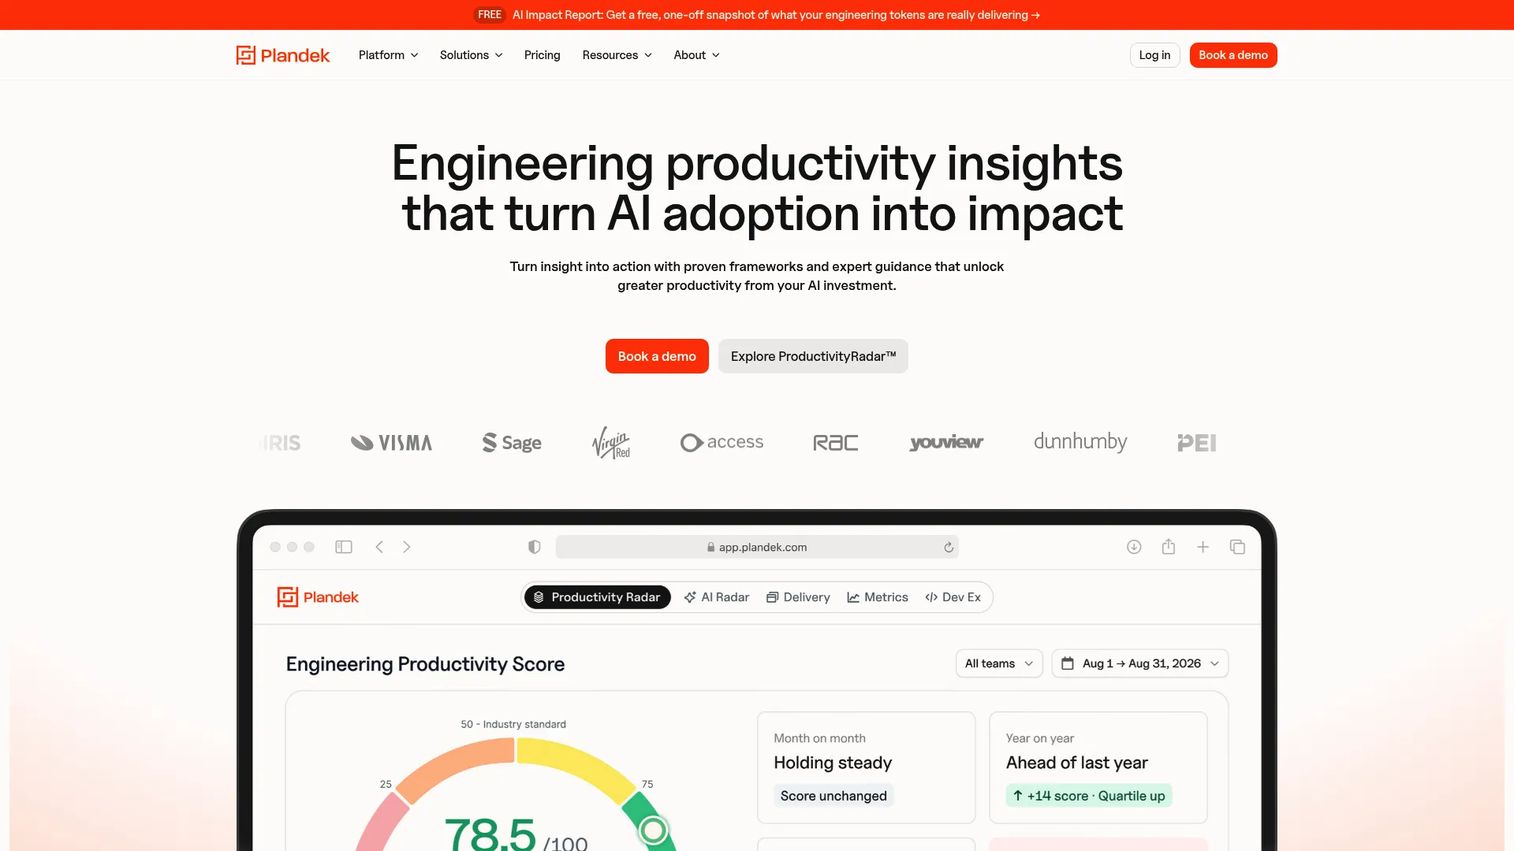
Plandek is a software engineering productivity intelligence platform with over 500 customizable engineering, agile, DORA, SPACE, and Flow metrics. Its Dekka AI assistant identifies risks, blockers, and recommended actions rather than just surfacing raw data. Built-in surveys cover engineering sentiment, AI adoption, and productivity constraints, giving Plandek a qualitative layer that most delivery-focused platforms lack. For enterprise software organizations and transformation teams, Plandek's governance features and delivery forecasting support structured improvement programs rather than ad hoc measurement.
Best for: Enterprise engineering organizations and technology leaders who need structured software delivery analytics, governance, and continuous improvement across teams and portfolios.
Key features
- AI-powered Dekka assistant for risk identification and recommended actions
- 500+ customizable metrics including DORA, SPACE, and Flow
- Real-time delivery dashboards, forecasting, and epic insights
- Built-in surveys for engineering sentiment and AI adoption
- Integrations with Jira, Azure DevOps, GitHub, and GitHub Copilot
Why choose Plandek: Plandek fits organizations running formal engineering improvement programs that need both breadth of metrics and forecasting capability. Its survey integration and AI assistant distinguish it from platforms that deliver data without recommended actions.
Plandek pricing: Standard runs $25 to $55 per contributor per month, depending on contract duration and license count. Premium uses custom pricing. Additional features like SSO start at £2,400 per year.
G2 rating: 4.5/5
19. Faros AI
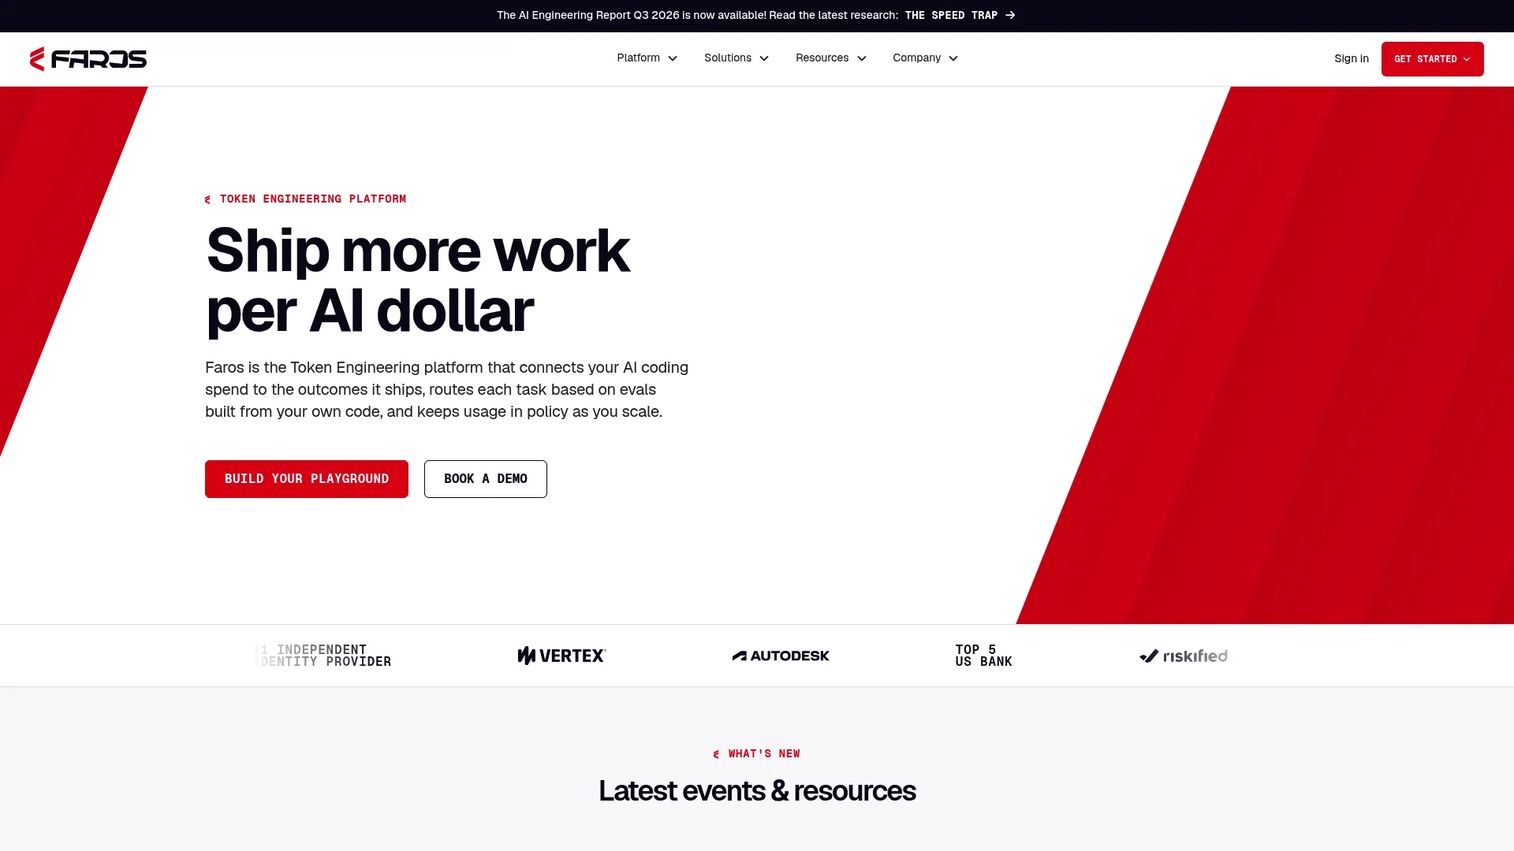
Faros AI has evolved into a token engineering platform that connects AI coding spend to shipped outcomes, optimizes model routing, and enforces organizational policies around AI tool usage. Its engineering world model links agent sessions, commits, pull requests, and CI outcomes to give engineering leaders a traceable view of what AI investment is actually producing. For organizations that have deployed multiple AI coding assistants and need to understand relative ROI by model, team, or codebase, Faros provides a level of attribution that generic analytics dashboards cannot. Teams exploring best ai code generation tools will find Faros particularly relevant for measuring the downstream impact of those tools.
Best for: Data-mature engineering organizations that need to measure, optimize, and govern AI coding spend and outcomes across multiple models and teams.
Key features
- AI coding spend and outcome attribution
- Model-route optimization using the organization's own code history
- Policy enforcement for approved models, budgets, and compliance
- Engineering world model connecting agent sessions, commits, PRs, and CI outcomes
- Diagnostics for token waste and efficiency benchmarking
Why choose Faros AI: Faros is the right choice when AI coding tool measurement is the primary analytics problem. It's built specifically for organizations managing material AI coding spend across multiple vendors and needing attribution beyond usage counts.
Faros AI pricing: Consumption-based pricing; contact Faros for a quote. No public numeric pricing is displayed on the vendor site.
20. Haystack
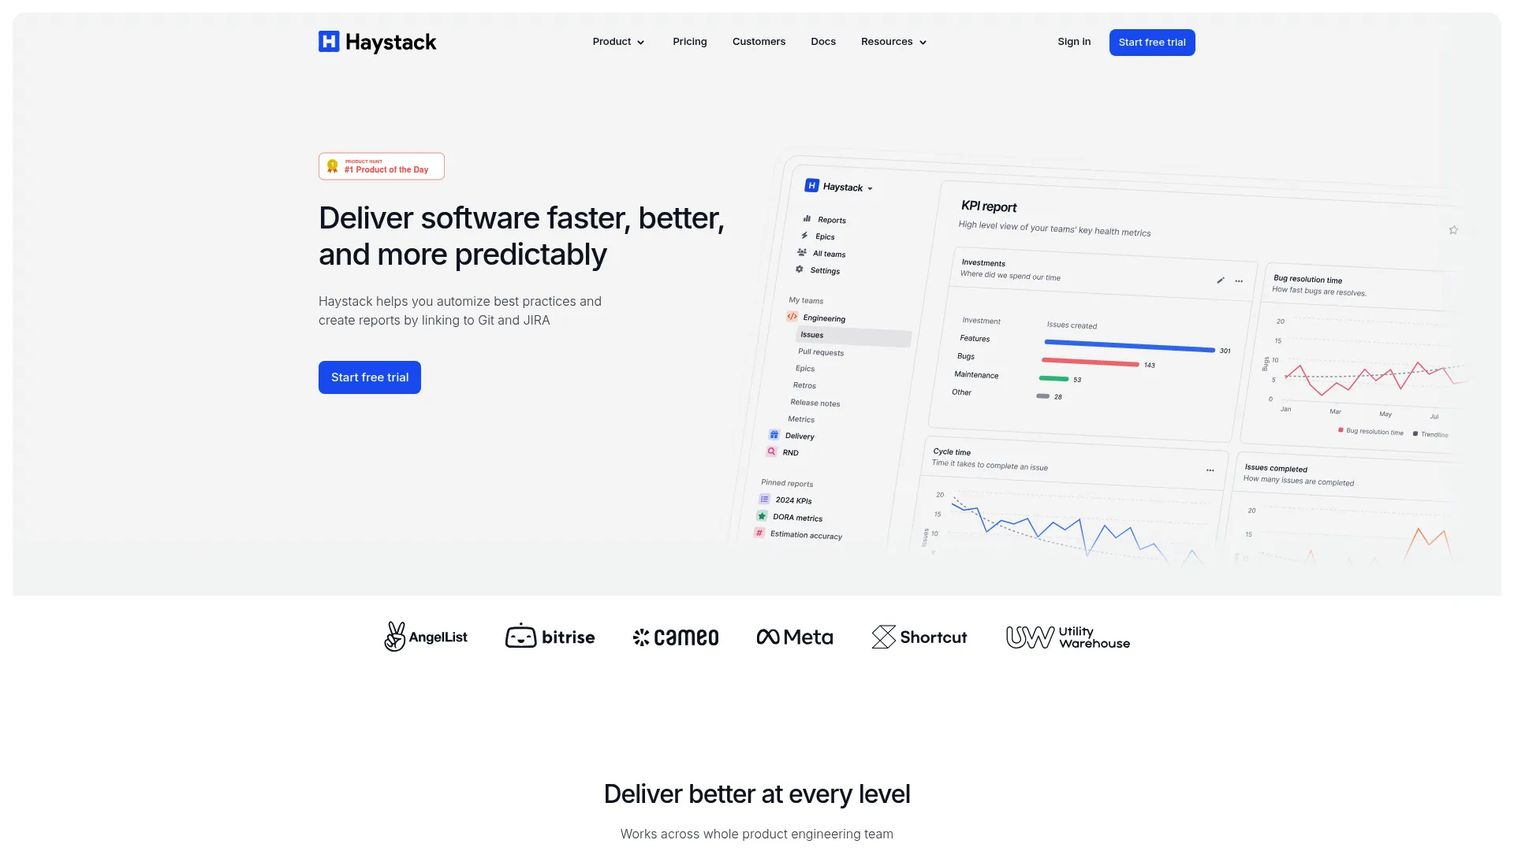
Haystack helps engineering teams improve software delivery through visibility into issue tracking, version control, delivery metrics, and team performance. Its AI-powered release notes with Slack sharing reduce the manual effort of keeping stakeholders informed about what shipped and when. For smaller engineering organizations that need practical delivery analytics without an enterprise implementation project, Haystack's Growth plan and 14-day trial offer a lower-friction starting point than most engineering intelligence platforms.
Best for: Engineering teams that want focused delivery analytics, cycle time visibility, and Slack-integrated alerts without enterprise implementation overhead.
Key features
- Engineering delivery metrics across issues, PRs, sprints, and deployments
- AI-powered release notes with Slack sharing
- Cycle time analytics and pull request insights
- Flexible reports and customizable metric dashboards
- Slack alerts for delivery bottlenecks
Why choose Haystack: Haystack works well for teams that want practical flow metrics and notification workflows without a heavy rollout. Its release notes automation is a useful addition for PMs who spend time manually summarizing what engineering shipped each cycle.
Haystack pricing: Growth runs $20 per member per month with an annual commitment, including 12 months of historical data and Slack support. Enterprise uses custom pricing with additional training and dedicated support. A 14-day free trial is available.
21. Tempo
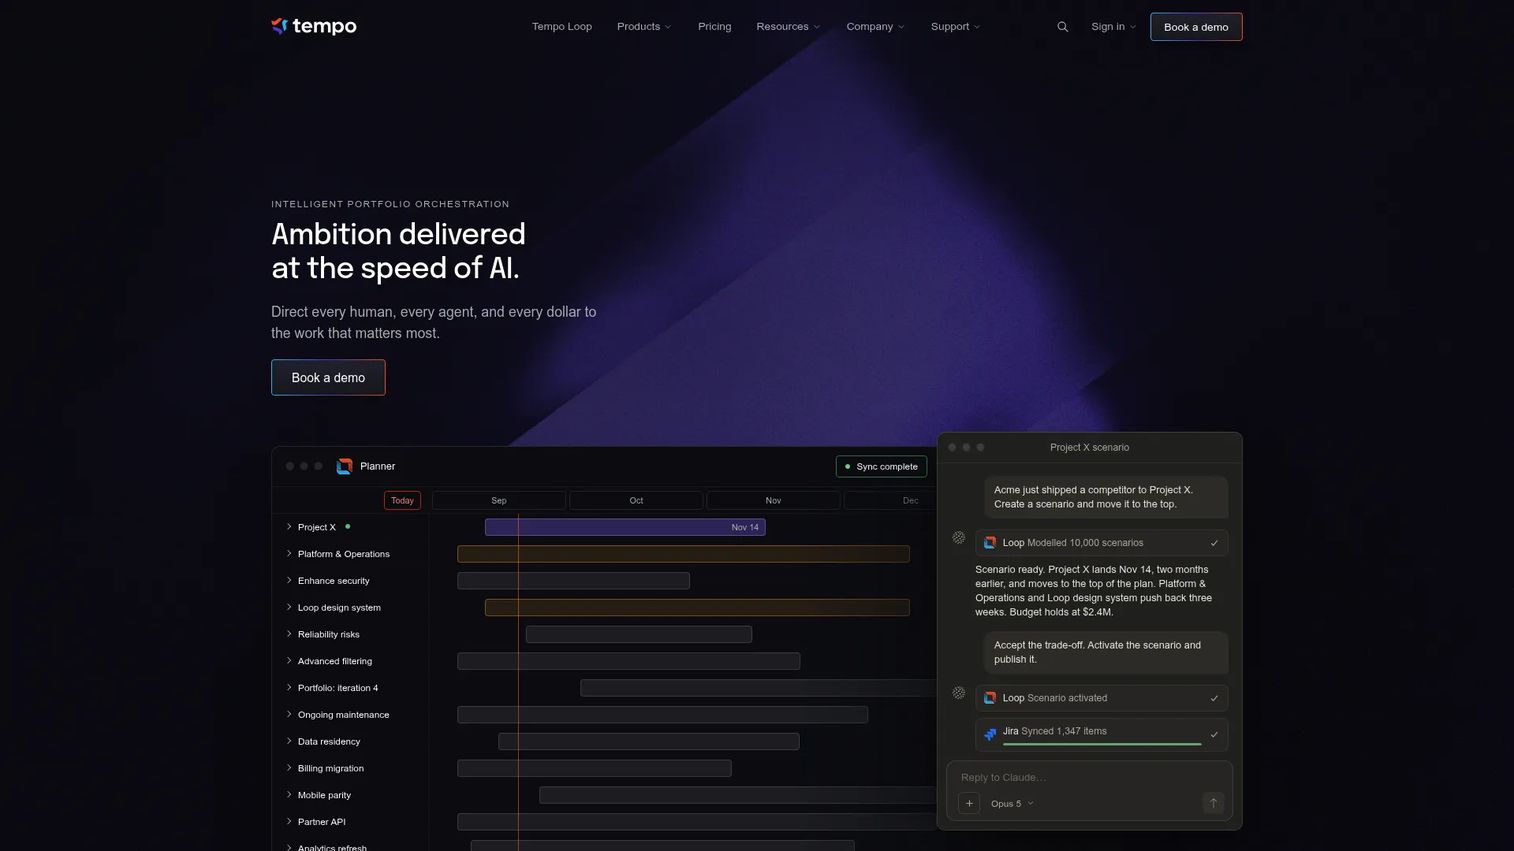
Tempo provides portfolio, project, capacity, financial, and time management software for teams using Jira and other work systems. Where most engineering analytics tools focus on delivery flow, Tempo focuses on engineering investment: How capacity is planned, tracked, and allocated across initiatives, and how that maps to R&D capitalization and portfolio reporting. For product and finance partners who need to answer "how much did we spend on feature X last quarter?", Tempo's Jira-native time tracking and portfolio hierarchy make that calculation tractable without a custom data build. Teams comparing capacity planning software will find Tempo the strongest Jira-native option for workforce intelligence.
Best for: Product, engineering, and finance teams that need capacity planning, time tracking, and engineering investment visibility inside Jira-centric workflows.
Key features
- Time tracking with calendar and IDE integrations
- Portfolio hierarchy and project portfolio management
- Capacity planning and workload management
- Jira-native workforce intelligence
- R&D capitalization and financial reporting
Why choose Tempo: Tempo fits organizations where the analytics question is capacity and cost allocation rather than delivery flow or DORA metrics. It's the right tool when product and finance need a shared view of engineering investment, not when engineering managers need cycle time dashboards.
Tempo pricing: Timesheets Cloud runs $10 per user per month for 1 to 10 users, $5.99 per user per month for 11 to 100 users, and lower volume rates for larger teams. A free trial is available.
G2 rating: 4.4/5
Considerations when choosing software development analytics tools
Start with the decision you need to improve
Before evaluating any platform, define the operating decision that analytics should support. Forecast roadmap risk? Improve cycle time? Measure AI coding tool ROI? Reduce review bottlenecks? Each answer points to a different category of tool, and a platform that excels at one may not address another at all.
Choose metrics that developers can trust
Dashboards that rank individuals by commits, lines of code, or raw activity damage trust faster than they improve performance. Team-level metrics, longitudinal trends, developer experience context, and system bottleneck data are more defensible and more useful. If developers don't trust the measurement, they'll game it or ignore it, and neither outcome helps the PM.
Check integrations before evaluating dashboards
A tool is only as useful as the data it can access. Confirm that the platform connects to your actual source systems: GitHub or GitLab for repository data, Jira or Azure DevOps for work items, your CI/CD toolchain for deployment data, and your incident system for reliability signals. Missing a key source means gaps in every metric the platform produces.
Separate delivery analytics from code quality analytics
DORA metrics, cycle time, and sprint analytics answer questions about delivery flow and team capacity. Static analysis, security scanning, coverage, and technical debt answer questions about code correctness and long-term maintainability. Both matter for release confidence, but they require different tools, and conflating them leads to incomplete measurement.
Validate pricing, governance, and rollout effort
Seat model, data retention, deployment options, SSO, audit logs, and implementation support all affect total cost and organizational fit. A platform with strong analytics but a six-month implementation cycle may be the wrong choice for a team that needs signal within weeks. Ask for implementation timelines from similar-sized customers before committing.
Conclusion
Software development analytics is a fragmented category because the underlying problems are fragmented. Delivery flow, developer experience, code quality, capacity planning, and AI impact are related but distinct problems, and no single platform solves all of them equally well.
For broad engineering intelligence: Waydev, Jellyfish, and LinearB cover the most ground across delivery performance, AI impact, and investment visibility.
For platform-native analytics: GitHub, GitLab, Jira, and Azure DevOps are the right starting point when your team already lives in those platforms and you want signal without adding another vendor.
For developer experience measurement: DX, Swarmia, and Hatica combine quantitative delivery data with qualitative developer feedback in ways that delivery-only platforms miss.
For code quality risk: SonarQube provides the technical debt and security visibility that DORA metrics alone won't surface.
For capacity, planning, and business alignment: Tempo, Jellyfish, Allstacks, and Plandek help product and finance partners connect engineering effort to portfolio outcomes.
Shortlist three tools based on your primary decision, your source systems, and the level of trust your engineering team will need to act on the data.
FAQs
Software development analytics tools collect and analyze engineering data from code repositories, project management systems, CI/CD pipelines, incident tools, and developer feedback. The goal is better delivery visibility, planning, quality assurance, and engineering investment decisions. They differ from project management tools by including data that teams don't manually log, such as Git activity, deployment outcomes, and code quality signals.
The terms overlap significantly in practice. "Software engineering analytics" is more commonly used by engineering leaders and in academic or research contexts, while "software development analytics" appears more often in vendor categories and buyer searches. Both describe the same general category of tools that measure delivery performance, developer productivity, and engineering health.
Waydev, LinearB, Swarmia, GitLab, Azure DevOps, Plandek, Harness SEI, and Hatica all support DORA metrics tracking. The difference lies in how deeply they contextualize DORA data: Some report the four metrics; others surface the contributing factors like review time, queue depth, and deployment pipeline failures. Verify DORA support for your specific source systems before committing.
Jellyfish, Jira, Tempo, Allstacks, and LinearB are the strongest choices for PMs because they connect delivery progress, engineering capacity, roadmap risk, and business priorities in ways that other analytics tools don't. Jira is the most widely used because PMs already operate inside it. Jellyfish and Tempo add the investment and capacity layer that Jira alone doesn't provide.
Use team-level aggregated trends rather than individual rankings. Pair quantitative delivery metrics with qualitative developer experience data through surveys. Focus on system bottlenecks: Review queue length, CI failure rates, and unplanned work ratios rather than per-person activity counts. Developers who understand what's being measured and why are far more likely to engage with and act on the data.
No. DORA measures delivery performance along four dimensions, which is valuable but incomplete. It tells you whether code is reaching production reliably and quickly, but not whether the team has the capacity to sustain that pace, whether code quality is degrading, or whether engineers are experiencing friction that will compound into attrition or burnout. Pair DORA with developer experience data, quality metrics, and capacity planning for a complete picture.
The most critical integrations are your version control system (GitHub, GitLab, or Bitbucket), your work management tool (Jira or Azure DevOps), and your CI/CD pipeline. Incident management systems like PagerDuty add reliability signals. Slack or Microsoft Teams integrations enable alerts and async reporting. BI tools like Power BI or Looker matter for organizations that need to blend engineering data with business reporting. Missing any of these connections creates gaps in every metric the platform surfaces.
Lightweight tools with self-serve onboarding, such as Waydev's free tier or Haystack's 14-day trial, can surface initial data within days. Enterprise platforms with custom integrations, permission models, and data governance requirements often take four to twelve weeks from contract to production. The main variables are the number of source systems to connect, the organization's data cleanup requirements, and how much change management the engineering team needs before trusting the output.