You shipped the feature. Adoption charts stayed flat. Support tickets say one thing, your analytics dashboard says another, and the roadmap doc in Notion contradicts both. So you open six tabs to reconstruct what actually happened, and by the time you have an answer, the next launch is already behind.
That gap between activity and evidence is the real problem product growth tools solve. Not more dashboards. Not another vanity metric. A connected way to see what users do, understand why they do it, test a fix, and prioritize what to build next, all without stitching together five disconnected systems by hand.
The stakes are rising because the category is exploding. The product-led growth platform market is projected to grow from $6.64 billion in 2026 to $14.32 billion by 2030, a 21.2% CAGR, according to ResearchAndMarkets (2024). Product-led growth adoption among B2B companies jumped 45% between 2020 and 2023, per Gitnux (2026). More teams are running product-led motions, and more of them need tooling that connects behavior to decisions.
For a product marketer, this matters more than it looks. Your positioning is only as strong as the proof behind it. Your launches only count if adoption follows. Your enablement only works if it maps to what users actually do inside the product. Product growth tools are how you get the qualitative and quantitative insights to defend messaging, measure launches, and hand Sales proof points that hold up. If you build interactive product experiences to drive that adoption, tools like Guideflow live alongside this stack rather than inside it, but the analytics, feedback, and prioritization layers below are where growth decisions get made.
What's inside
This is a ranked list of 8 product growth tools for 2026, chosen for teams that need product analytics, experimentation tools, onboarding, feedback collection, and roadmap clarity in one stack. It is written for product marketers, product managers, and growth operators building a SaaS growth stack that connects insight to action.
We selected tools on four criteria that matter most for product and PMM work:
- Workflow fit: does it map to a real growth motion, not just a dashboard?
- Integration depth: does it connect to your CRM, CMS, analytics, and product management tools?
- Scalability: does it hold up as data volume and team size grow?
- Actionability: does the reporting help you decide what to change next?
TL;DR
- Best for roadmap prioritization and feedback: Productboard, when deciding what to build next matters most.
- Best for product analytics plus experimentation: Amplitude, for behavioral depth and feature testing in one place.
- Best for clean self-serve analysis: Mixpanel, for fast event-based insight loops.
- Best for autocapture without event planning: Heap, for lean teams that want data without heavy setup.
- Best for qualitative diagnosis: Hotjar and FullStory, for understanding friction behind the numbers.
- Best for onboarding and adoption: Pendo and Userpilot, when growth is tied to in-app education.
Most teams need two or three of these, not all eight. Start with the bottleneck that hurts most right now.
What are product growth tools?
Product growth tools are software that helps teams understand user behavior, improve activation and retention, run experiments, collect feedback, and prioritize roadmap work so the product itself drives adoption and revenue.
They are the operating system for a product-led growth motion. Instead of guessing what to build or ship features into a void, growth teams use these tools to close a loop: observe behavior, form a hypothesis, test a change, measure the result, and prioritize the next move.
The category breaks into five core groups:
- Product analytics: Tracks what users do inside the product. Funnels, retention curves, cohorts, and segmentation. Answers "what happened and where do users drop off?"
- User behavior analytics: Adds the visual and qualitative layer. Heatmaps, session replay, and click tracking. Answers "how are users actually moving through the interface?"
- Experimentation tools: A/B tests, feature flags, and controlled rollouts. Answers "did this change actually move the metric?"
- Onboarding tools: In-app guides, tooltips, checklists, and lifecycle nudges. Drives activation and feature adoption without a live call.
- Feedback collection and roadmap tools: Surveys, feedback repositories, and prioritization frameworks. Turns raw customer feedback into a defensible roadmap.
The best product growth tools rarely live in one category. Analytics platforms add experimentation. Onboarding tools add analytics. Roadmap tools add feedback collection. That overlap is why stack design matters more than any single feature comparison.
When to use product growth tools
You do not need a full stack on day one. You need the tool that matches the bottleneck in front of you. Three situations tend to trigger the search.
When activation is stalling and you need behavioral visibility
Signups look healthy, but users never reach first value. You suspect a drop-off in onboarding, but you cannot see where. This is when product analytics and user behavior analytics earn their place. Funnel analysis shows the step where people quit. Session replay shows why. Together they turn "activation is low" into "72% of new users abandon at the workspace setup screen."
When experiments are running but insights are fragmented
Your team is testing changes, but results live in three tools and two spreadsheets. Nobody agrees on whether the last test won. Experimentation tools that sit inside your analytics platform fix this. When the test result and the behavioral data share one source of truth, you stop debating the numbers and start acting on them.
When roadmap decisions are driven by opinions instead of evidence
The loudest stakeholder wins the prioritization meeting. Feature requests pile up in Slack, docs, and sales calls with no system to weigh them. This is where feedback collection and roadmap prioritization tools close the loop. They consolidate customer feedback, tie it to segments and revenue, and give you a defensible answer to "why are we building this and not that?"
Comparison table
Here is a side-by-side view of the eight tools, sorted by relevance to product growth work. Pricing and G2 ratings reflect values verified at publish time and can change, so confirm the current figures on each vendor's site before you buy.
| # | Product | Intent | Key use case | Pricing | G2 rating |
|---|---|---|---|---|---|
| 1 | Productboard | Roadmap and feedback | Prioritize what to build next from consolidated feedback | Free; Plus from $19/maker/mo | - |
| 2 | Amplitude | Analytics + experimentation | Behavioral analytics with feature testing | Free; Plus from $49/mo | 4.5/5 |
| 3 | Mixpanel | Product analytics | Self-serve event analysis and retention | Free; Growth from $0 usage-based | 4.5/5 |
| 4 | Heap | Autocapture analytics | Full behavioral capture without manual tagging | Free up to 10k sessions/mo | - |
| 5 | Hotjar | Behavior + feedback | Heatmaps, replays, and lightweight surveys | Free tier available | 4.6/5 |
| 6 | FullStory | Session replay + analytics | Diagnose drop-offs with behavioral context | Free tier available | 4.5/5 |
| 7 | Pendo | Analytics + in-app guidance | Onboarding, adoption, and feedback in one | Free up to 500 MAU | 4.4/5 |
| 8 | Userpilot | Onboarding + adoption | No-code in-app onboarding and lifecycle nudges | Starter from $299/mo | 4.6/5 |
Best product growth tools for 2026
Each tool below includes an overview, who it fits best, key strengths, why you would choose it, and pricing. Read them against your own bottleneck, not as a straight ranking.
1. Productboard
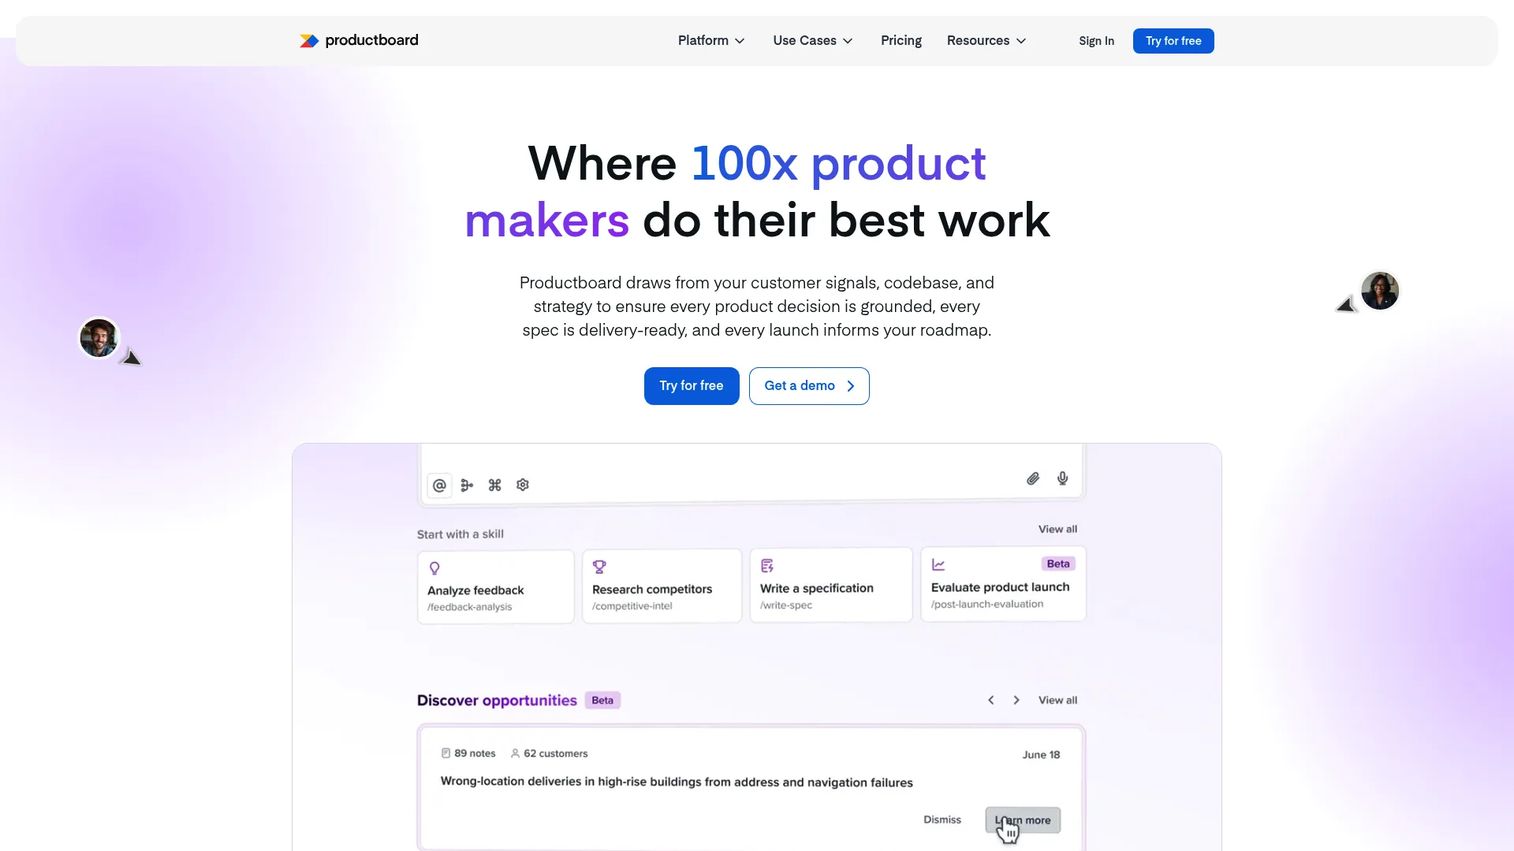
Productboard is an AI-powered product management platform built to collect feedback, prioritize features, and share roadmaps. It sits at the top of the product growth stack because it answers the question every other tool feeds into: what should we build next? For product marketers, it is the closest thing to a single source of truth on why the roadmap looks the way it does, which makes launch planning and positioning far less of a scramble.
Where analytics tools show you behavior, Productboard turns customer feedback and insight into a defensible prioritization decision. It consolidates requests from sales calls, support tickets, and user interviews into one repository, then ranks them against strategy so the loudest voice does not automatically win the meeting.
Best for: Product and PMM teams that need a central place to capture feedback and decide what to build next.
Key strengths
- Feedback repository: Consolidates customer feedback from every channel into one searchable insights hub.
- Prioritization matrix: Scores features against strategy and impact so roadmap decisions hold up under scrutiny.
- Roadmapping and alignment: Shares roadmaps across stakeholders with the collaboration, approvals, and versioning that keep teams aligned.
Why choose Productboard: If your prioritization runs on opinions and your roadmap drifts every quarter, Productboard gives you governance and evidence. It is the tool that connects raw feedback collection to a clear, shareable plan, which is exactly the alignment problem most PMMs live with.
Productboard pricing: Productboard offers a Free plan at $0, a Plus plan from $19 per maker per month, and a Business plan from $59 per maker per month, all billed annually. Enterprise is custom-priced with a five-maker minimum. Pricing scales by makers, so cost tracks with how many people actively build in the tool.
2. Amplitude
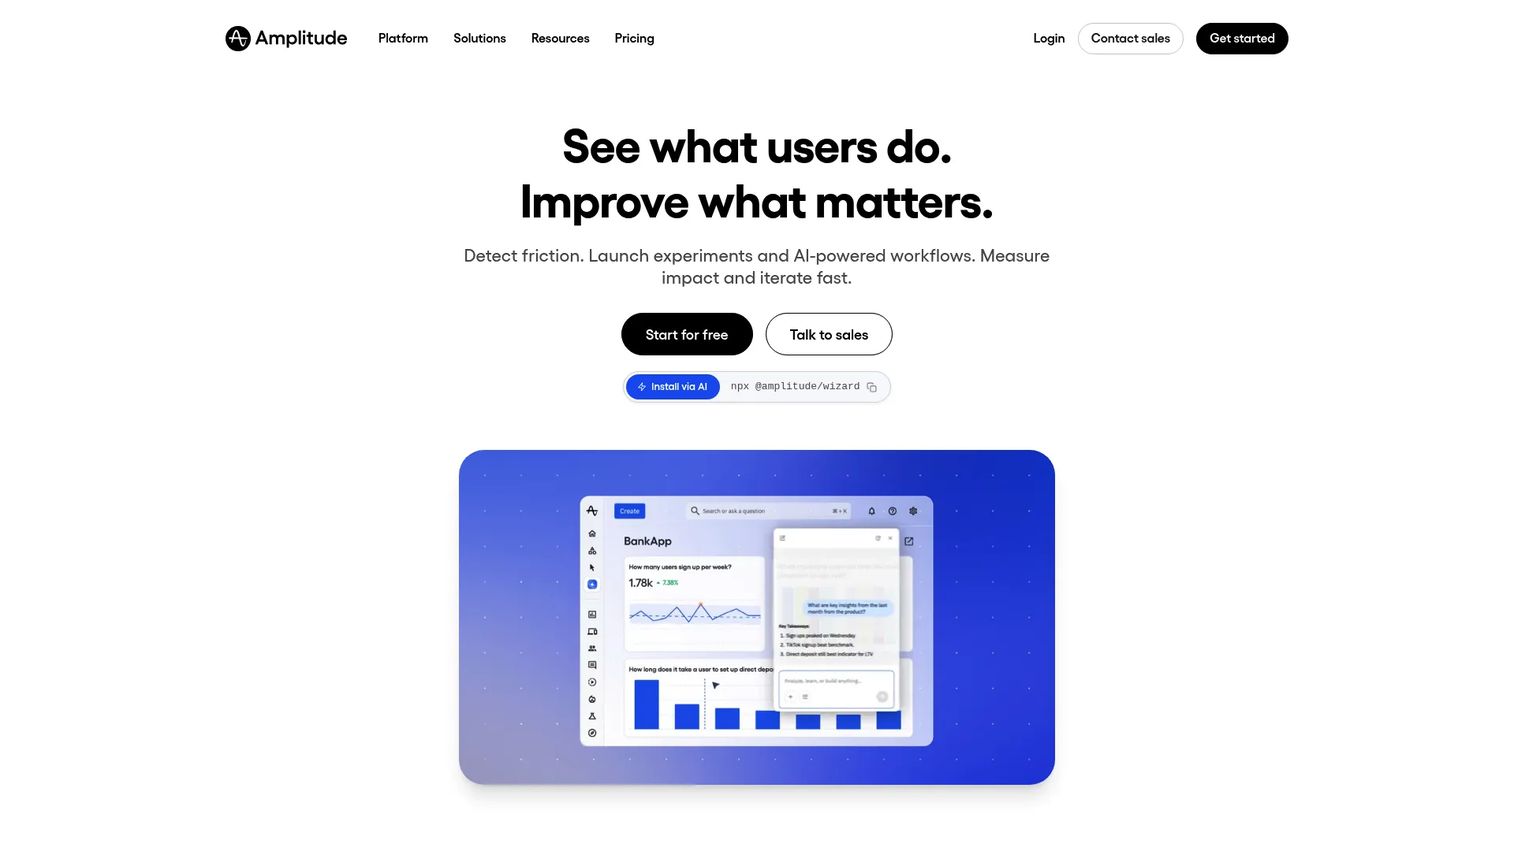
Amplitude is an AI analytics platform for product, web, and experimentation teams. It is the tool most teams reach for when they need to see what users do, where conversion breaks, and whether a change moved the metric, all in one platform. For product-led growth motions, that combination of product analytics and experimentation under one roof is the differentiator.
Amplitude excels at behavioral analysis: funnels, segmentation, retention, and pathing that show exactly where users engage and where they drop. Because feature experimentation and flags live in the same platform, you can test a fix against the behavioral data instead of exporting to a separate tool.
Best for: Teams that need product analytics plus experimentation in one platform.
Key strengths
- Product analytics: Deep funnel analysis, cohorts, and segmentation to pinpoint where activation and conversion break.
- Feature experimentation: Built-in A/B testing and feature flags tied directly to behavioral data.
- Session replay: Watch real sessions to add qualitative context behind the numbers.
Why choose Amplitude: If you are running experiments but insights are scattered, Amplitude keeps the test and the behavioral data in one source of truth. It rates 4.5/5 on G2 and suits teams that want to move from "activation is low" to a tested fix without tool-hopping.
Amplitude pricing: Amplitude has a free-forever plan with no credit card required, capped at 2 million events per month. The Plus plan starts at $49 per month, billed monthly or annually, with annual billing saving 20%. Growth and Enterprise plans are custom-priced. The free tier is generous enough for early-stage teams to run real funnel analysis before committing.
3. Mixpanel
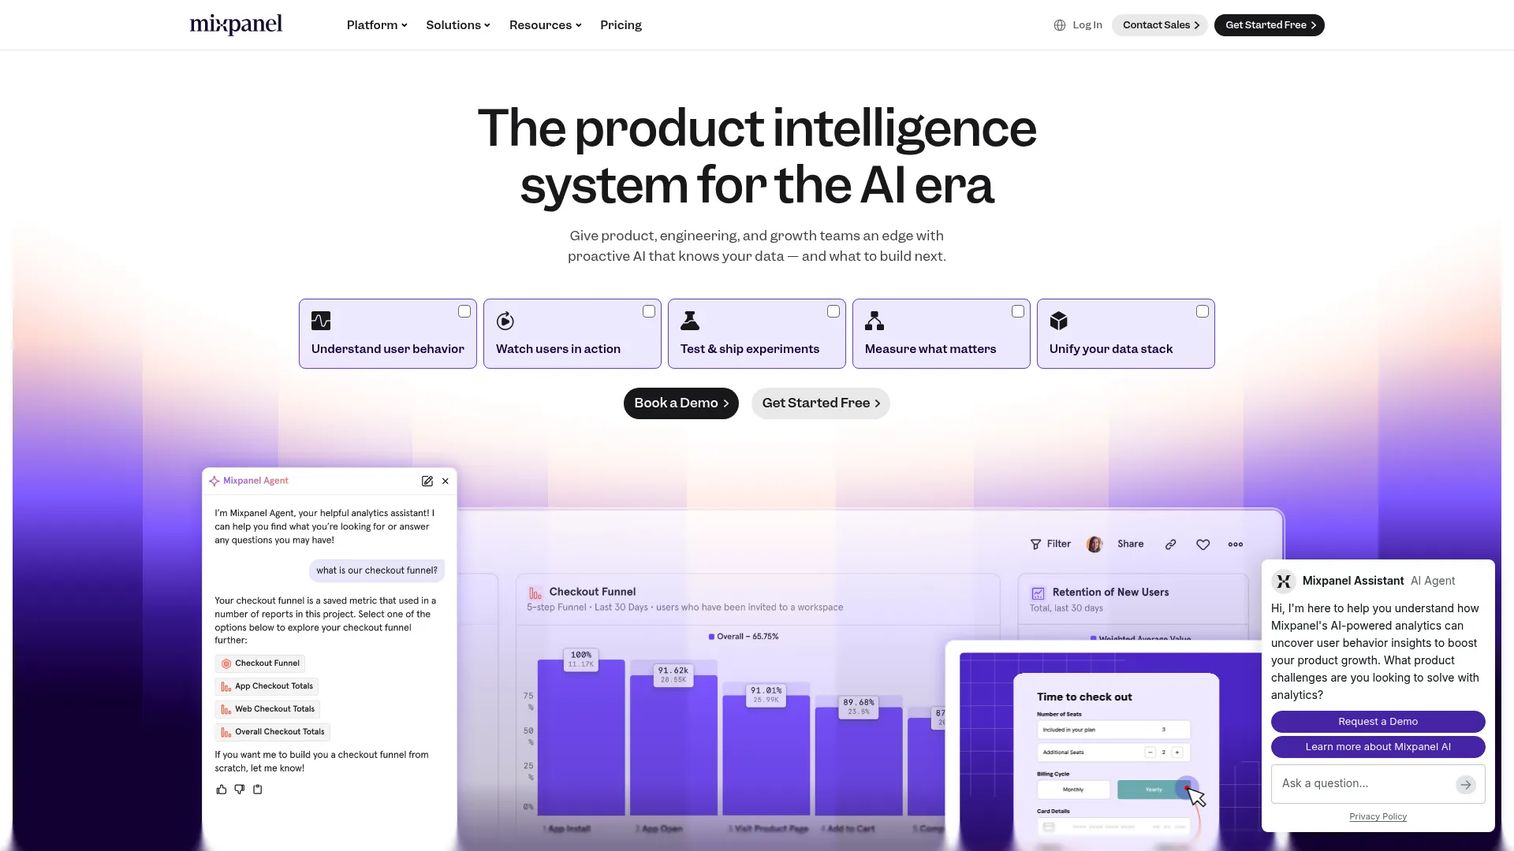
Mixpanel is a product analytics and experimentation platform built for understanding user behavior and improving digital products. It is known for clean, self-serve analysis: the kind of tool where a PMM or PM can build a funnel or retention report without filing a ticket to the data team. That speed of insight is why lean growth teams gravitate to it.
Mixpanel centers on event-based analytics. You track the actions that matter, then slice them into funnels, retention curves, cohorts, and flows. The interface rewards curiosity, which shortens the loop between a question and an answer.
Best for: Teams that want self-serve product analytics plus experimentation without heavy data engineering.
Key strengths
- Event-based analytics: Track and analyze the specific actions that signal activation and engagement.
- Funnels, retention, and cohorts: Fast funnel analysis and retention reporting to spot drop-off and measure stickiness.
- Session replay and heatmaps: Layer visual context onto quantitative data.
Why choose Mixpanel: If your team wants to answer product questions themselves rather than wait on analysts, Mixpanel's self-serve model fits. It rates 4.5/5 on G2 and works well for teams that value fast insight loops over exhaustive configuration.
Mixpanel pricing: Mixpanel offers a free-forever plan capped at 1 million monthly events. The Growth plan starts at $0 with 1 million monthly events included, then $0.28 per 1,000 events after that, so cost scales with usage. Enterprise is contact-sales. The usage-based model keeps entry cost low and predictable for smaller teams.
4. Heap
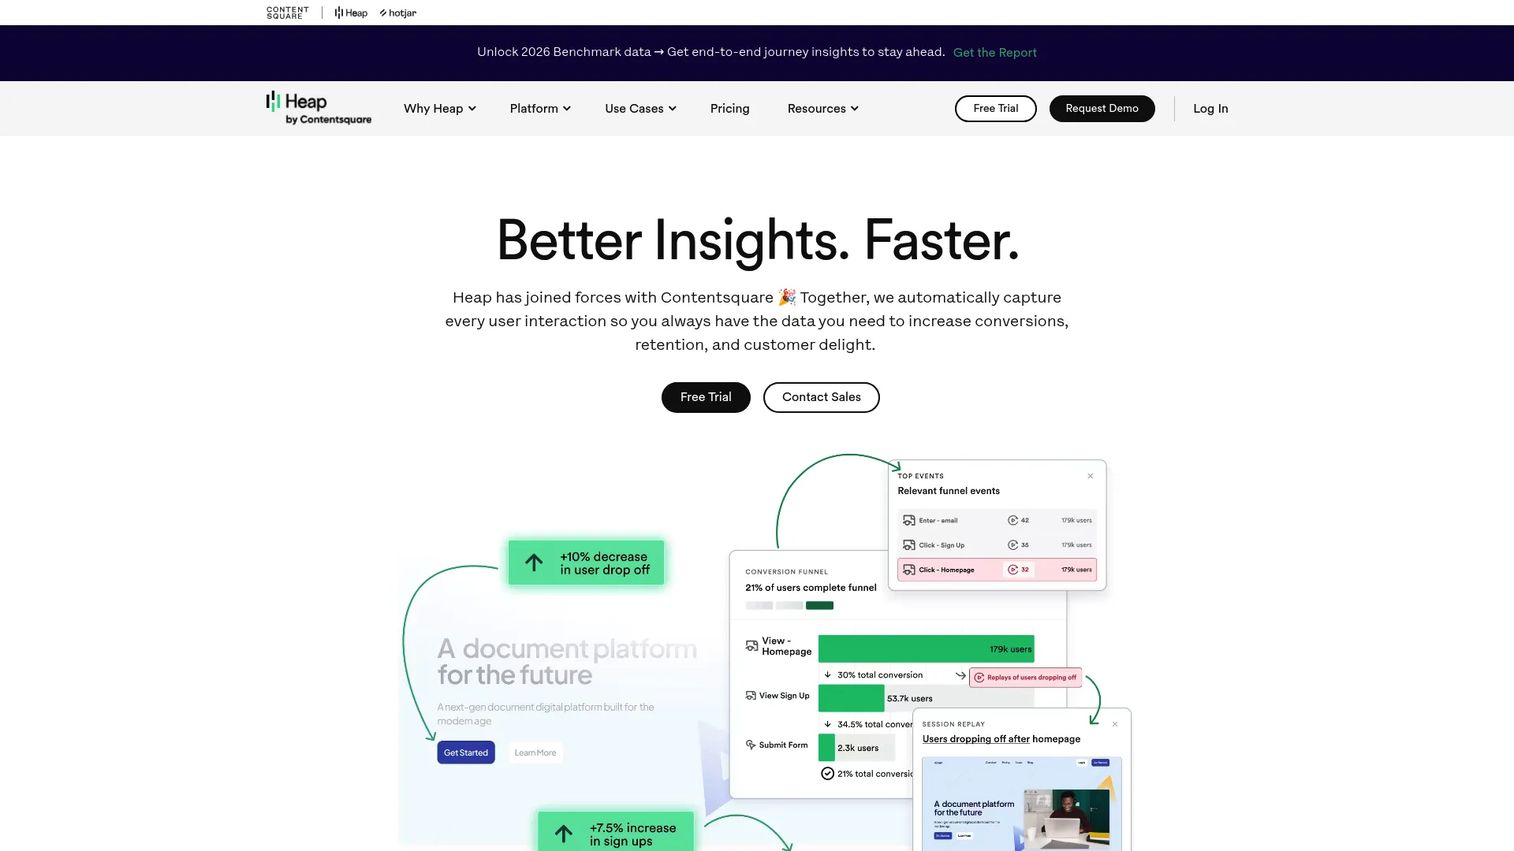
Heap is a digital insights and product analytics platform that automatically captures user behavior and analyzes journeys. Its defining feature is autocapture: instead of manually tagging every event before you can analyze it, Heap records clicks, pageviews, form fills, and sessions automatically. For teams that do not want to plan an event taxonomy upfront, that removes a real barrier to getting started.
That autocapture model shines for exploratory analysis. You can ask a question about a flow you never explicitly tracked and still get an answer, because the data was captured retroactively. For lean teams without dedicated analytics engineers, that convenience compounds.
Best for: Teams that want autocaptured product analytics and session replay without manual event tagging.
Key strengths
- Automatic capture: Records clicks, pageviews, form fills, sessions, and journeys with no manual event setup.
- Session replay: Watch real user sessions to understand behavior in context.
- Data enrichment and integrations: Enrich captured data and connect it to the rest of your stack.
Why choose Heap: If setting up event tracking has stalled your analytics before, Heap's autocapture removes that blocker. It suits lean teams that want to explore user behavior analytics without a heavy implementation project, and answer questions they did not know to ask when they started.
Heap pricing: Heap offers a free tier for up to 10,000 monthly sessions. Its Growth, Pro, and Premier plans use custom session-based pricing and require an estimate from Heap. Because pricing tracks sessions rather than events or seats, cost scales with traffic, so confirm your volume before committing.
5. Hotjar
Hotjar is behavior analytics and feedback software for understanding user experience on websites. Where event analytics tell you what happened, Hotjar shows you how it happened and, through surveys, why. That qualitative layer is what makes it useful for diagnosing friction that numbers alone cannot explain.
Heatmaps reveal where users click, scroll, and stall. Session recordings let you watch real journeys and spot the confusion behind a drop-off. Feedback widgets and surveys capture user sentiment in the moment. For a PMM validating messaging or a PM diagnosing an activation gap, that mix of visual and stated feedback is hard to replicate with dashboards.
Best for: Teams that need visual behavior insights plus lightweight user feedback.
Key strengths
- Heatmaps: See exactly where users click, move, and scroll to spot friction and dead zones.
- Session recordings: Watch real sessions to understand the behavior behind the metrics.
- Surveys and feedback: Collect on-page feedback and sentiment to pair qualitative and quantitative insights.
Why choose Hotjar: If your quantitative tools tell you activation dropped but not why, Hotjar fills the gap. It rates 4.6/5 on G2 and works best alongside a product analytics platform, adding the qualitative context that turns a number into a fix.
Hotjar pricing: Hotjar offers a Free plan plus Growth, Pro, and Enterprise tiers. The free tier is a practical way to run heatmaps and recordings on a single site before scaling up, so check the current pricing page for volume limits and paid-tier figures.
6. FullStory
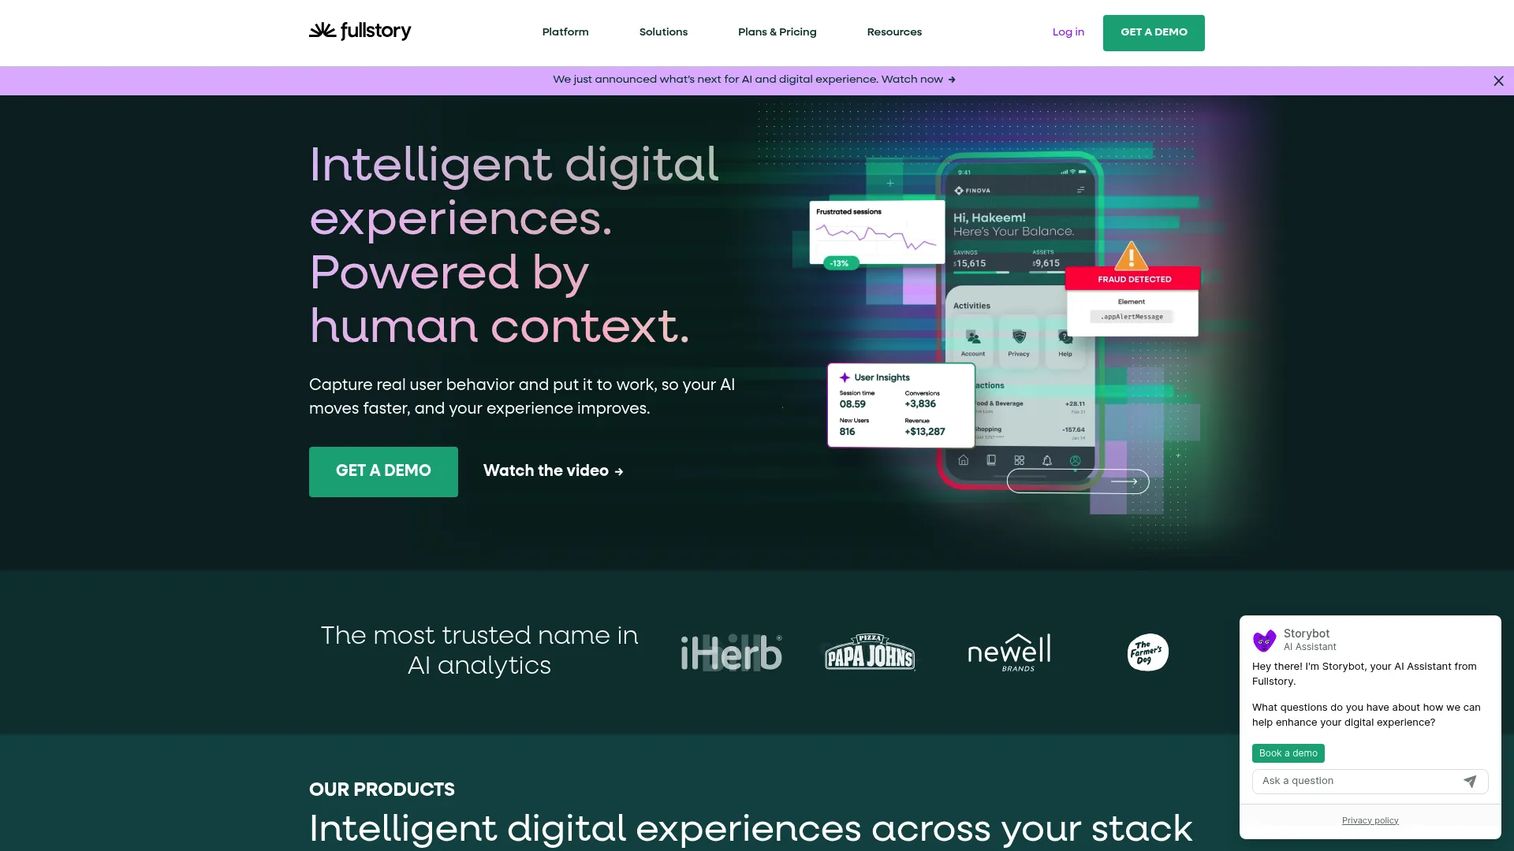
FullStory is a behavioral data and analytics platform for customer journey, employee experience, and data activation use cases. It combines session replay with product analytics, so you can move from a quantitative signal to the exact session that explains it. When a funnel shows a drop-off or support flags a recurring issue, FullStory gives you the context behind it.
Its strength is investigation. Behavioral analytics surface the pattern, session replay shows the individual story, and AI-driven insights help surface what to look at first. For growth and product teams chasing the "why" behind a metric, that combination shortens the path from symptom to root cause.
Best for: Teams that need session replay plus behavioral analytics to understand and improve digital experiences.
Key strengths
- Session replay and behavioral analytics: Watch real sessions with the behavioral data that explains them.
- Product analytics: Funnels, heatmaps, and segmentation to quantify where issues occur.
- AI-driven insights: Surface anomalies and automations that flag what to investigate next.
Why choose FullStory: If your team keeps finding drop-offs or support signals without context, FullStory connects the number to the session. It rates 4.5/5 on G2 and stands out when diagnosing complex friction that spans product and support.
FullStory pricing: FullStory offers a free plan, FullstoryFree, with paid Business, Advanced, and Enterprise tiers that list "request pricing" rather than public figures. Start with the free plan to test replay and analytics on your product, then talk to sales for volume-based paid pricing.
7. Pendo
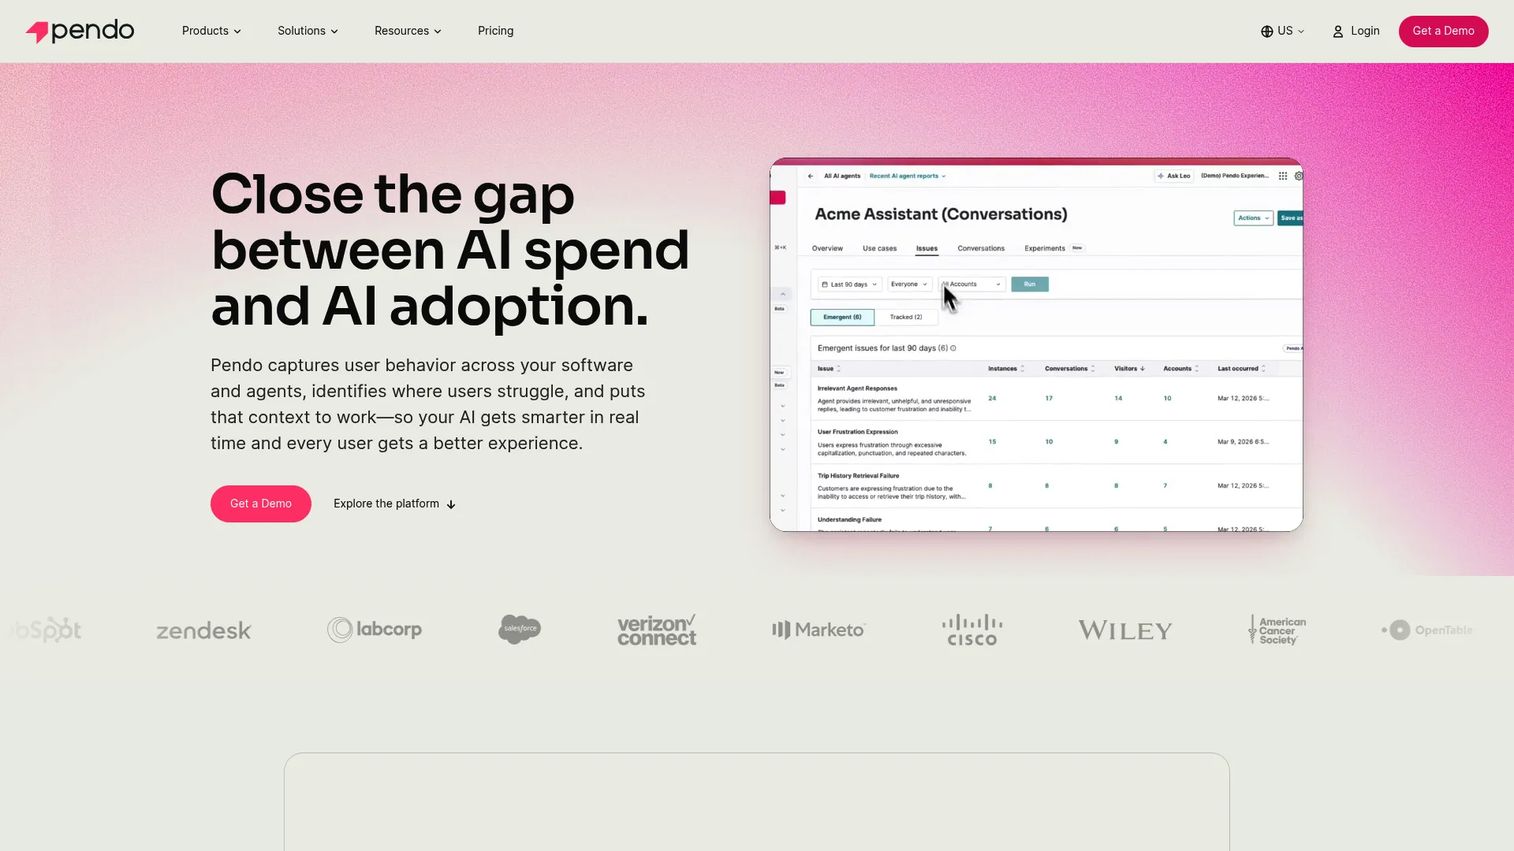
Pendo is a software experience management platform that combines product analytics, in-app guidance, and user feedback. It is strong when product growth is tied to user education and adoption, because it does not just measure behavior, it lets you act on it in-app. See where users stall, then deploy a guide or tooltip to fix it without shipping code.
That analytics-plus-guidance loop is what sets Pendo apart. Product analytics show the adoption gap, in-app guides close it, session replay explains the friction, and NPS surveys capture sentiment. For teams driving feature adoption and activation, having all of that in one platform reduces the number of tools competing for the same in-app real estate.
Best for: Product teams that want analytics, in-app messaging, and feedback in one platform.
Key strengths
- Product analytics: Track feature adoption, usage, and retention across segments.
- In-app guides: Build onboarding flows, tooltips, and walkthroughs without engineering.
- Session replay and NPS surveys: Combine replay with sentiment surveys to pair behavior with feedback collection.
Why choose Pendo: If your growth motion depends on educating users inside the product, Pendo pairs the analytics that find the gap with the onboarding tools that close it. It rates 4.4/5 on G2 and suits product teams consolidating adoption tooling into one platform.
Pendo pricing: Pendo offers a free plan for up to 500 monthly active users. Its Base, Core, and Ultimate plans are custom-priced and require a quote. The free tier is a genuine way to test analytics and guides on a small user base before scaling.
8. Userpilot
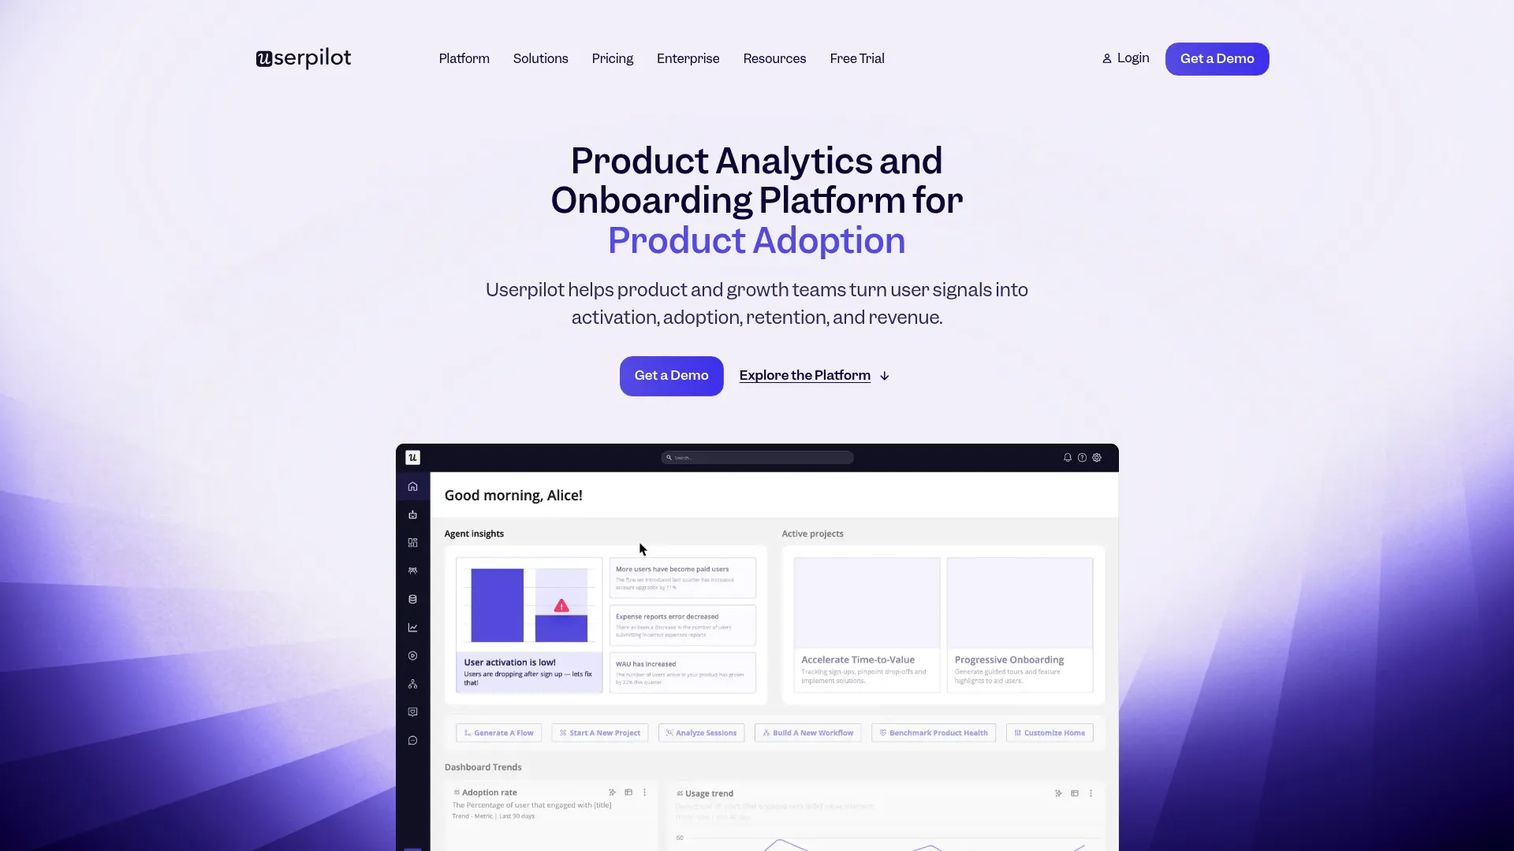
Userpilot is a no-code product growth platform for onboarding, product adoption, analytics, and user feedback. It is especially useful for activation and feature adoption programs, because it lets product and PMM teams build in-app experiences, segment users, and trigger lifecycle nudges without engineering support. That speed to publish maps directly to how product marketers want to work.
Userpilot centers on the onboarding and adoption layer. Build flows, checklists, and tooltips, then target them to the right segment at the right lifecycle stage. Paired with its product analytics and session replay, you can see whether an onboarding change actually lifted activation, then iterate.
Best for: Product and customer success teams that want no-code onboarding and product adoption tooling.
Key strengths
- In-app engagement: Build onboarding flows, checklists, and nudges with no code.
- Segmentation and workflows: Target experiences by persona, plan, or lifecycle stage.
- Product analytics and feedback: Measure activation and adoption, and collect user feedback in-app.
Why choose Userpilot: If activation and feature adoption are your bottleneck and engineering bandwidth is tight, Userpilot's no-code onboarding tools let you ship and test experiences fast. It rates 4.6/5 on G2 and fits teams that iterate on onboarding often.
Userpilot pricing: Userpilot's Starter plan begins at $299 per month for up to 2,000 monthly active users. The Growth plan starts from $849 per month, and Enterprise is custom-priced. A 14-day free trial is available. Pricing scales by monthly active users, so map your MAU to the tier before committing.
Considerations
Before you add anything to the stack, run each candidate through this checklist. The goal is a connected system, not a pile of tools that each answer half a question.
How well the tool fits your growth motion
A product-led motion needs different tooling than a sales-led one. If self-serve activation drives revenue, prioritize onboarding tools and behavioral analytics. If large deals drive it, roadmap prioritization and feedback collection matter more. Buy for the motion you actually run, not the one you aspire to.
Whether it connects qualitative and quantitative data
Analytics tells you what happened. Feedback and session replay tell you why. The strongest stacks pair both, so you are never stuck with a drop-off number and no explanation. Check whether a tool covers one side well or bridges both.
Whether it supports governance and collaboration
For PMM and product work, versioning, approvals, and shared ownership are not luxuries. When roadmaps and messaging drift across teams, a tool with real collaboration and governance keeps everyone working from one source of truth. Ask who owns each data source and how changes are tracked.
Whether it integrates with your existing systems
A product growth tool that does not talk to your CRM, CMS, analytics, and product management tools creates another silo. Confirm the integrations you need exist and run deep enough to sync the data you care about, not just a shallow connection.
Whether the reporting actually helps you act
Dashboards that look impressive but never change a decision are overhead. The test is simple: can you point to a change you made because of what a tool showed you? If not, it is not earning its place.
Conclusion
There is no single best product growth tool, only the right tool for the bottleneck in front of you. If prioritization and feedback are the mess, start with Productboard. If you cannot see where users drop, reach for Amplitude, Mixpanel, or Heap. If you have the numbers but not the reasons, add Hotjar or FullStory. If activation and adoption are the gap, Pendo or Userpilot close it in-app.
The best product growth stack is the one that connects insight to action: observe behavior, understand the why, test a change, prioritize the next move, and drive adoption. Any tool that breaks that loop, or lives in a silo, works against you no matter how good its dashboards look.
Start with the tool that solves your biggest bottleneck first. Prove it earns its place with a decision you made because of it, then expand the stack from there. One tool per job, shared data sources, and a clear owner for each beats a sprawling collection of half-used platforms every time.
FAQs
Product growth tools are software that helps teams understand user behavior, improve activation, test changes, collect feedback, and prioritize roadmap work. They span product analytics, experimentation, onboarding, feedback collection, and roadmap prioritization. Together they let the product itself drive adoption and revenue, which is the core of a product-led growth motion.
The best tool depends on your main bottleneck. For visibility into behavior, reach for product analytics like Amplitude or Mixpanel. For deciding what to build next, Productboard leads on roadmap prioritization and feedback. For activation, onboarding tools like Userpilot or Pendo fit best. Match the tool to the problem, not the other way around.
Usually, yes. Analytics tells you what happened and where users dropped off. Feedback and session replay tell you why. Many teams find that a drop-off number alone does not point to a fix, so pairing quantitative and qualitative insights gives you a complete picture and a clearer next step.
Focus on proof points, adoption signals, launch measurement, and how easily insights travel to Sales and Product. A PMM needs tools that show whether a launch drove adoption, back up positioning with evidence, and export cleanly into enablement. Governance, versioning, and integrations matter because messaging and roadmaps should stay consistent across every touchpoint.
They surface friction and pinpoint where users drop off, then let you intervene. Analytics identifies the stalled step, session replay explains it, and onboarding tools deploy a targeted guide or nudge to fix it. Over time, that loop of observe, understand, and act lifts activation and keeps more users reaching value.
Yes. Insight without prioritization does not change the product. Roadmap and feedback tools like Productboard close the loop by turning behavioral data and customer feedback into a defensible decision about what to build next. Without that layer, analytics just tells you where you are stuck without helping you move.
Product growth tools focus on behavior, experimentation, and adoption, the levers that move activation and retention. Product management tools emphasize planning, prioritization, and delivery. The two overlap heavily, since roadmap tools like Productboard sit in both camps, but growth tooling leans toward measuring and influencing what users do inside the product.
Consolidate around one tool per job, standardize on shared data sources, and give every tool a clear owner and a measurement goal. Before adding anything, ask what it replaces and what decision it will change. A lean, connected stack beats a sprawling one where half the tools go unused and none of the data lines up.