You open a diagram someone shared three months ago. The boxes are still there. The reality they described is gone. The API renamed, the approval step moved, two services merged. The diagram lies now, and everyone knows it, so nobody trusts it.
That is the real problem with most diagramming software. Drawing the picture is easy. Keeping it accurate, shared, and useful across a team that ships every week is the hard part. Product managers feel this most, because you sit between engineering, design, sales, and support, and you are the one who gets asked "where's the flow for this?" when the answer is buried in a slide deck no one can edit.
The market has grown up around this pain. Diagramming software reached roughly $1.12 billion in 2025 and is forecast to hit $1.88 billion by 2030 at a 10.5% CAGR, according to The Business Research Company (2026). Cloud deployment already held 61.4% of the market in 2025, per Dataintelo (2026), which tells you where the category is heading: collaborative, browser-first, and always current.
So the question is not "which tool draws the prettiest boxes." It is which tool fits how your team actually works, stays maintainable as the product changes, and does not add another silo. That is the lens for this shortlist.
What's inside
This guide compares eight diagramming tools for 2026, chosen for product managers and cross-functional SaaS teams who need diagrams that hold up in real work. We evaluated each on collaboration and real-time co-editing, template depth, technical accuracy for architecture diagrams, integrations with docs and project tools, security and privacy posture, and overall workflow fit. The shortlist spans flowchart software, process diagram software, whiteboard-style visual collaboration tools, architecture diagram software, and diagram-as-code options. You will find pricing, G2 ratings where available, and honest guidance on when each tool is the right pick.
TL;DR
Short on time? Here is the quick read on the best diagramming tools for 2026.
- Best overall for broad team use: draw.io, free, security-first, and integration-friendly.
- Best for AI-assisted, ecosystem-rich diagramming: Lucidchart.
- Best for architecture teams: IcePanel, built around the C4 model.
- Best for freehand, lightweight collaboration: Excalidraw.
- Best for diagram-as-code and developer workflows: MermaidChart.
- Best for whiteboard-style team collaboration: Miro.
- Best for fast, browser-based sketching: tldraw.
- Best for Atlassian-native teams: Gliffy.
What is diagramming software?
Diagramming software is a category of tools used to create flowcharts, process maps, system diagrams, architecture diagrams, and other visual structures that help teams align on how something works. Instead of describing a workflow in paragraphs, you show it: nodes, arrows, swimlanes, and boundaries that make relationships obvious at a glance.
The best diagram tools share a common set of capabilities. Here is what to expect from a modern option in 2026:
- Templates and starter assets: prebuilt flowcharts, org charts, UML diagrams, C4 models, and BPMN layouts so you are not starting from a blank canvas.
- Drag-and-drop editing: shape libraries, snapping, and auto-layout that keep diagrams clean without manual pixel-nudging.
- Real-time co-editing: multiple people editing the same canvas at once, with cursors, comments, and version history.
- Export formats: PNG, SVG, PDF, and often HTML or embeddable links, so diagrams live wherever your team reads them.
- Integrations: connections to Confluence, Jira, GitHub, Notion, VS Code, and cloud storage so diagrams stay close to the work they describe.
- AI diagramming: generate or refine diagrams from a prompt, auto-arrange messy layouts, and speed up first drafts.
- Diagram-as-code: define diagrams in text (like Mermaid syntax) so they version-control cleanly and regenerate on demand.
- Security and privacy controls: local or self-hosted options, access management, and clear data handling for teams with compliance needs.
The distinction that matters most for product teams: some tools optimize for polished final artifacts, some for live collaboration, and some for technical accuracy that survives frequent releases. The right choice depends on which of those you need most.
When to use diagramming software
Not every diagram serves the same purpose. Match the tool to the job.
Map a workflow or process
Reach for flowchart software when your team needs to document handoffs, approval chains, onboarding flows, or operational steps. The goal here is clarity and maintainability: anyone should be able to open the diagram, understand the sequence, and update it when the process changes. Process diagram software with strong templates and easy editing wins in this scenario, because the diagram will be revised often and read by non-technical stakeholders.
Explain a system or architecture
When product and engineering need to communicate how a system fits together, you want architecture diagram software built for technical accuracy. Software architecture diagrams using C4, UML, or dependency maps demand structure that a generic drawing tool struggles to enforce. This is where code-friendly and architecture-first tools earn their place, because the diagram must stay aligned with an evolving codebase and satisfy technical stakeholders who will spot a wrong dependency instantly.
Align cross-functional teams
When PMs, designers, operations, and engineering need a shared visual artifact for planning or a decision, collaboration matters as much as the final image. Look for visual collaboration tools with comments, real-time co-editing, and integrations into the docs and project tools your team already lives in. The diagram becomes a working surface, not a static deliverable, and everyone can contribute without waiting on one person to make edits.
Comparison table
The table below compares each tool by intent, its core differentiation, entry pricing, and G2 rating. Use it to shortlist two or three options, then read the detailed sections for fit. Pricing reflects verified figures at the time of writing; ratings come from each tool's current G2 listing.
| # | Product | Intent | Key differentiation | Pricing | G2 rating |
|---|---|---|---|---|---|
| 1 | draw.io | Broad, security-first diagramming | Free, no server-side storage, deep Atlassian integration | Free | 4.4/5 |
| 2 | Lucidchart | All-purpose collaborative diagramming | AI assist, large template library, Visio import/export | From $7.95/mo | 4.5/5 |
| 3 | Miro | Whiteboard-style visual collaboration | 7000+ templates, 250+ integrations, workshop tools | Free; Starter from $8/mo | 4.6/5 |
| 4 | Excalidraw | Fast, sketch-style diagramming | Free no-account editor, hand-drawn aesthetic, open source | Free | 4.5/5 |
| 5 | IcePanel | Software architecture modeling | C4 model, drafting for current vs future state | Free; Growth from $40/editor/mo | 5.0/5 |
| 6 | tldraw | Browser-based sketching and canvas SDK | Instant start, infinite canvas, developer SDK | Free (hobby) | Not listed |
| 7 | Gliffy | Confluence-native business diagramming | Atlassian-embedded, Mermaid support, AI diagrams | Free up to 10 users | 4.4/5 |
| 8 | MermaidChart | Diagram-as-code | Text-based Mermaid diagrams, AI, version control | Free; Plus from $10/mo | 4.7/5 |
1. draw.io
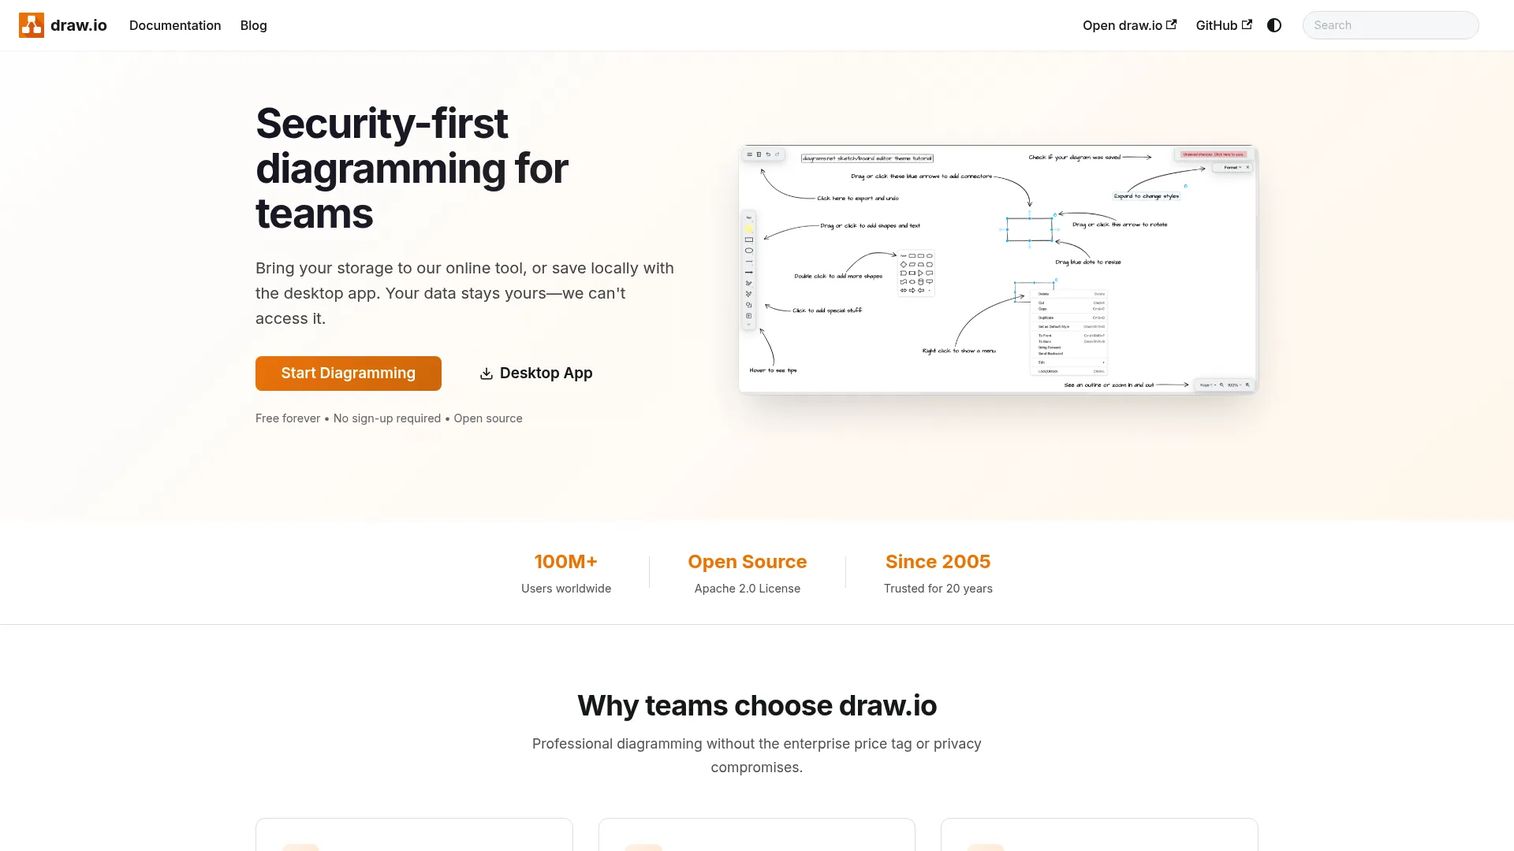
draw.io is free diagramming software for building and sharing technical diagrams, with web, desktop, and integration-based deployment. Its reputation rests on one thing most tools cannot claim: the free online editor stores nothing server-side. For teams handling sensitive architecture or process data, that privacy posture is a real reason to choose it over a cloud-only alternative. It handles flowcharts, network diagrams, org charts, and software architecture diagrams without pushing you toward a subscription.
Best for: teams that want a free, security-conscious diagramming tool that lives close to their existing docs and project stack.
Key strengths
- Security and privacy posture: the free online editor has no server-side storage, so diagram data stays under your control.
- Broad integrations and file compatibility: works with Confluence, Jira, and multiple cloud storage options, keeping diagrams next to the work.
- Wide export support: exports to PNG, SVG, PDF, HTML, URL, and XML for embedding anywhere.
Why choose draw.io: it is the pragmatic default for PMs who want diagrams inside Confluence or Jira without procurement friction or per-seat costs. If your priority is control over your data and zero cost, few tools match it. The trade-off is a less polished, more utilitarian editing experience compared to premium suites, which most technical teams accept happily.
draw.io pricing: the tool is free to use and self-deploy. Paid licensing applies to the Confluence and Jira apps for larger teams, handled through Atlassian's marketplace, but the core editor carries no charge. It holds a 4.4/5 rating on G2.
2. Lucidchart
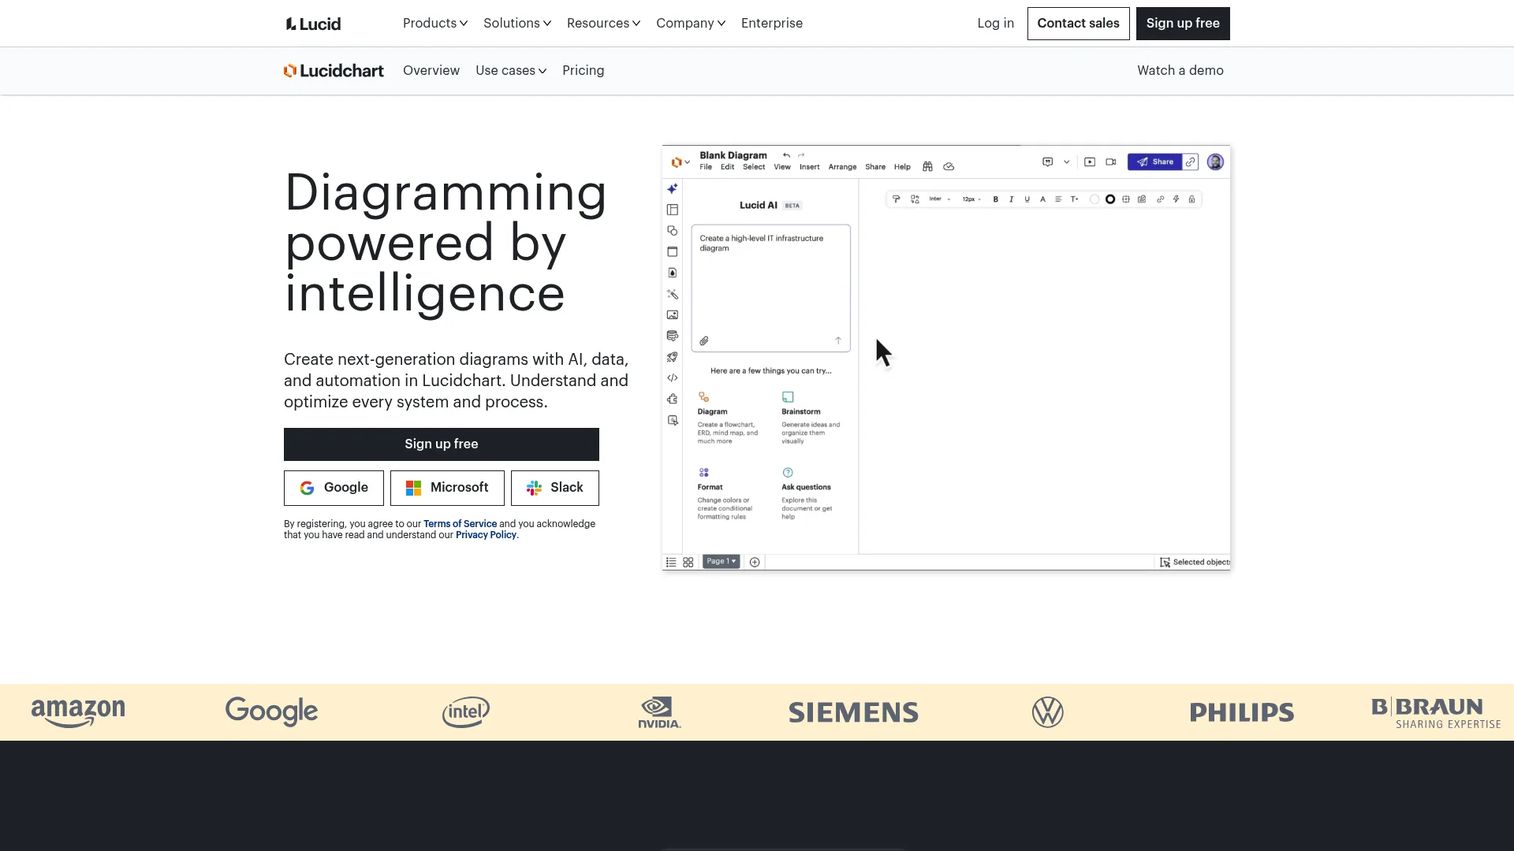
Lucidchart is cloud-based intelligent diagramming software for flowcharts, process maps, org charts, and other visuals, with a heavy emphasis on collaboration and automation. It is the closest thing to an all-purpose default for teams that want polish, a deep template library, and AI diagramming in one place. For PMs who need to move between a process map on Monday and an architecture sketch on Wednesday, its breadth removes the need for a second tool.
Best for: teams that need collaborative, polished diagramming across process visualization, org design, and technical documentation.
Key strengths
- Real-time collaboration: multiple editors work the same canvas with comments and live cursors.
- Visio import and export: migrate legacy diagrams in and out without rebuilding from scratch.
- Shape libraries and templates: a large starter set covering flowcharts, UML, and process diagrams.
Why choose Lucidchart: it fits teams that value ecosystem breadth and want AI to speed up first drafts. The intelligence and template depth make it forgiving for occasional users while still serving power users. The consideration is cost at scale, since per-seat pricing adds up across a large cross-functional group, so weigh how many people actually need edit access.
Lucidchart pricing: a free plan is available. Paid Individual plans start at $7.95/month, and Team plans start at $9.00 per user/month, both billed monthly. Enterprise pricing requires contacting sales. The Lucid Visual Collaboration Suite, which includes Lucidchart, holds a 4.5/5 rating on G2.
3. Miro
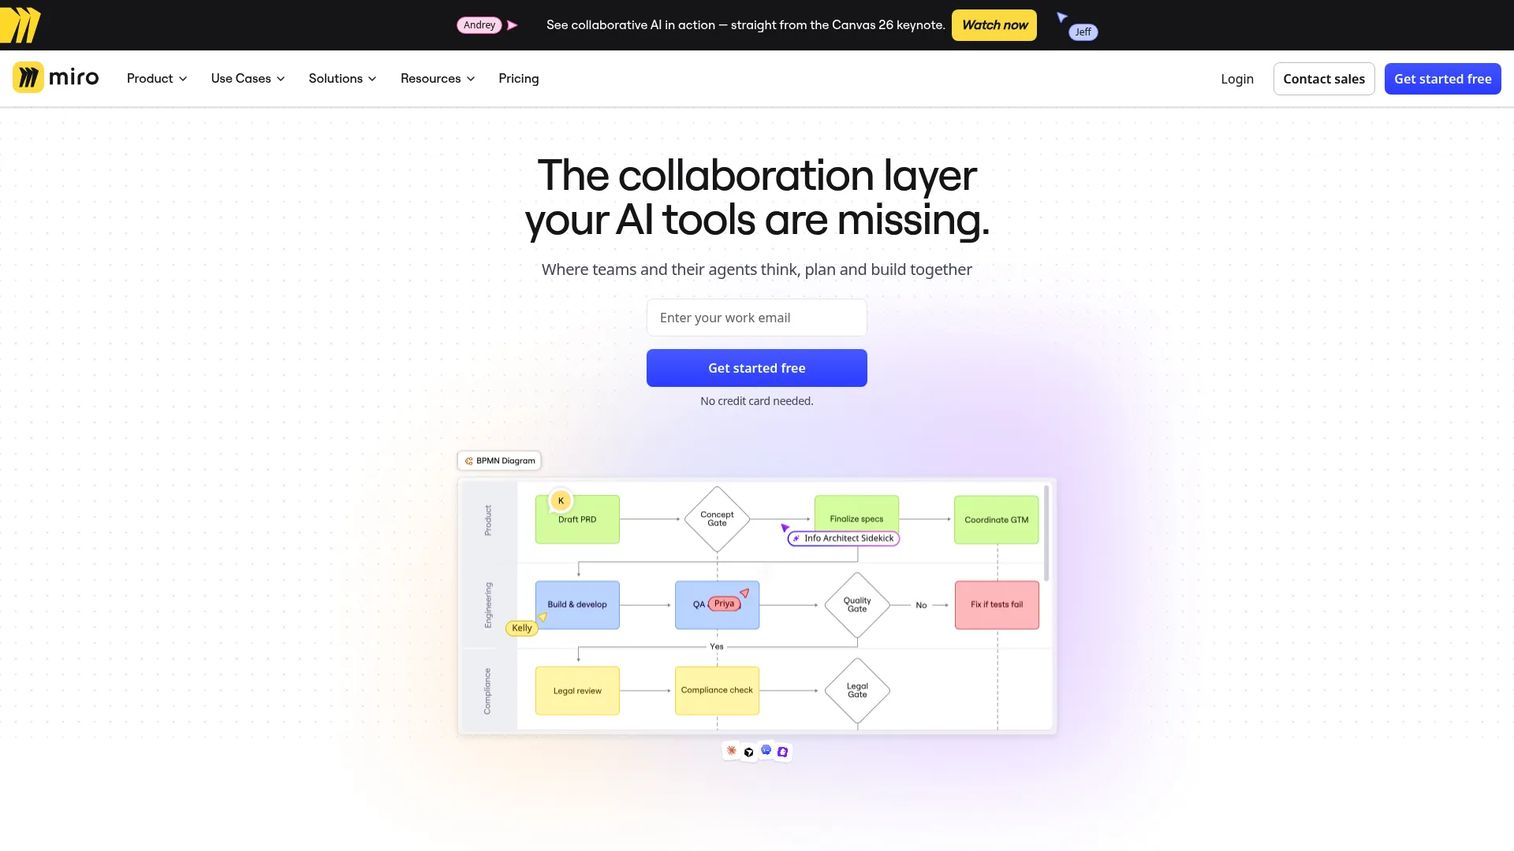
Miro is an AI-powered visual collaboration workspace for brainstorming, planning, diagramming, and workshops. It is strongest when the diagram is part of a larger session rather than a standalone artifact. When a PM runs a discovery workshop, a roadmap review, or a cross-team planning session, Miro's infinite canvas lets diagramming, sticky notes, and discussion happen in one place. That makes it a natural fit for the alignment side of product work.
Best for: cross-functional teams that need a shared online whiteboard from ideation through delivery.
Key strengths
- Template depth: 7000+ templates covering flowcharts, journey maps, retros, and planning frameworks.
- Broad integrations: 250+ integrations connect Miro to the tools your team already uses.
- Workshop-ready features: presentations, Talktrack, and an AI-powered workspace support live and async collaboration.
Why choose Miro: it excels when visual collaboration matters as much as the final diagram. For product teams that live in workshops and want participation from designers, engineers, and stakeholders at once, it removes friction. If your need is a precise, version-controlled architecture diagram, a more structured tool will serve better, but for collaborative thinking Miro is hard to beat.
Miro pricing: the Free plan costs $0. Starter is $8/month per member billed yearly, with a Business tier above it, and Enterprise offers custom pricing from 30 members. Annual billing saves 20% over monthly. Miro holds a 4.6/5 rating on G2.
4. Excalidraw
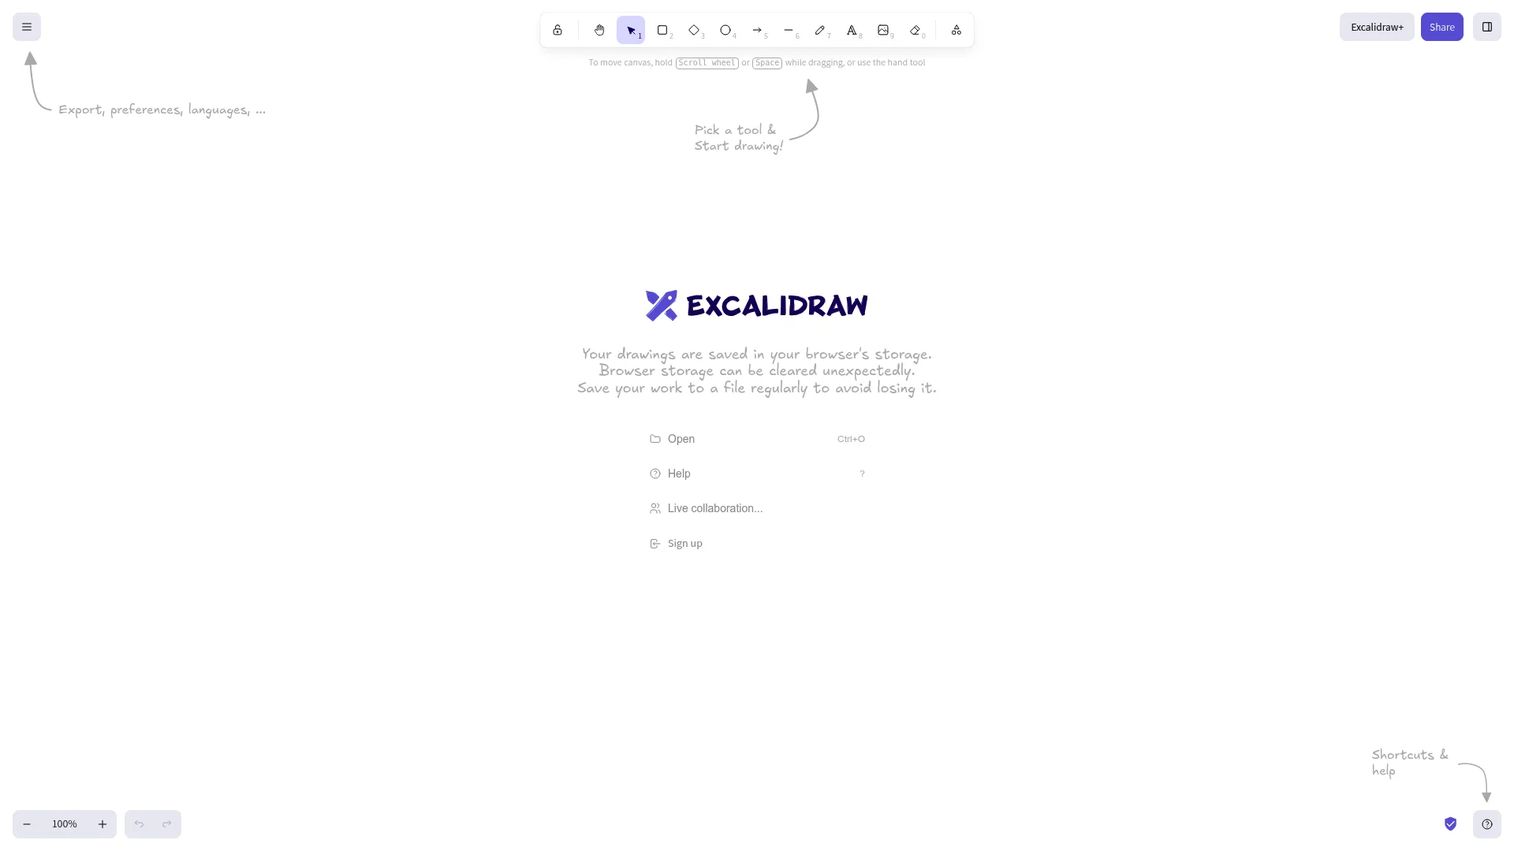
Excalidraw is a free, open-source collaborative whiteboard for hand-drawn-style diagrams, wireframes, and sketches. Its deliberate sketchy aesthetic is the point: a rough diagram signals "this is a draft, let's discuss" rather than "this is final, don't question it." For early-stage thinking, that framing keeps conversations open. PMs, designers, and engineers reach for it when they need to capture an idea fast without opening a heavy editor.
Best for: teams and individuals who need fast, sketch-style diagramming and lightweight collaboration.
Key strengths
- Free no-account editor: open the canvas and start drawing immediately, no signup required.
- Real-time collaboration: share a link and co-edit live with your team.
- Generative AI features: speed up diagram creation with AI assistance.
Why choose Excalidraw: it wins for speed and low friction during early product discussions. When you need a readable diagram in two minutes to unblock a conversation, its simplicity is the feature, not a limitation. It is not built for governed, permanent architecture documentation, so pair it with a more structured tool for artifacts that must persist and stay accurate over time.
Excalidraw pricing: the core editor is free forever. Excalidraw Plus adds team features with a 14-day free trial; a public paid price was not listed at the time of writing. Excalidraw holds a 4.5/5 rating on G2.
5. IcePanel

IcePanel is a C4-model-based software architecture modeling and diagramming tool. Unlike general drawing tools, it enforces structure: you model systems, containers, and components in a way that stays consistent as the architecture evolves. For engineering-led PMs and platform teams, that consistency is what keeps a diagram trustworthy six months later. It is purpose-built for the moment when a wrong dependency in a diagram would mislead a whole team.
Best for: teams documenting and communicating software architecture with the C4 model.
Key strengths
- Flows and dependencies: map how data and requests move through your system with explicit dependency tracking.
- Drafting for current vs future state: model where the architecture is today and where it is heading in the same tool.
- Domains and SSO: organize large systems by domain and manage access with single sign-on.
Why choose IcePanel: it is the most compelling option when the diagram must stay aligned with a living system and satisfy technical stakeholders. The C4 structure prevents the sprawl that plagues freeform architecture diagrams. For non-technical process mapping it is more than you need, so reserve it for genuine software architecture work where accuracy is non-negotiable.
IcePanel pricing: a Free plan is available at $0. Growth is $40/editor/month and Scale is $80/editor/month, both billed annually, with custom Enterprise pricing. IcePanel holds a 5.0/5 rating on G2, based on a small number of reviews.
6. tldraw
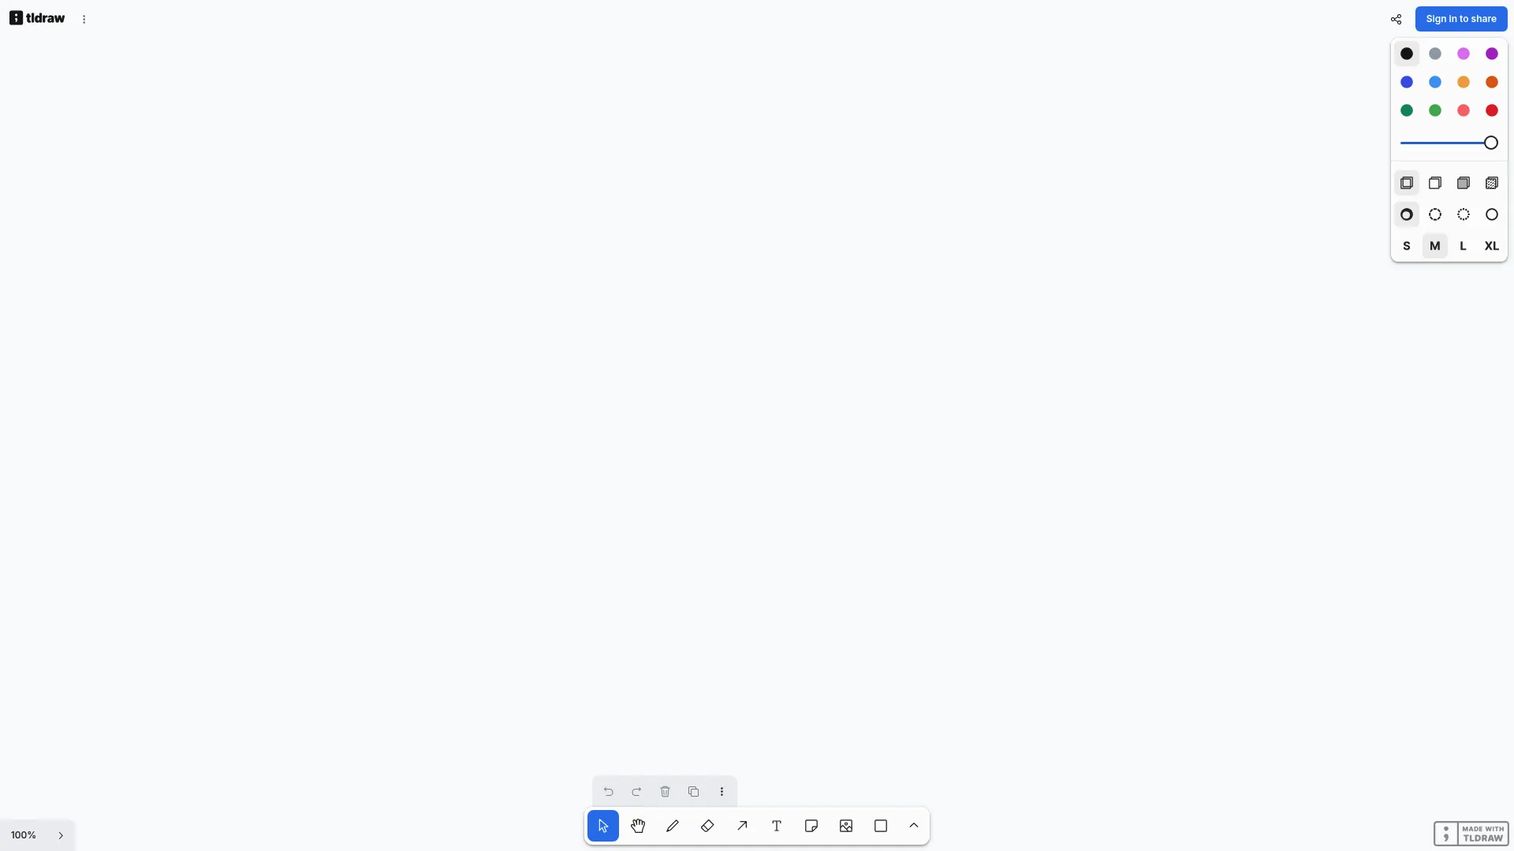
tldraw is a free collaborative whiteboard and infinite-canvas SDK for building canvas apps. As a diagramming tool it stands out for how fast it starts: open the page and you are drawing, with no onboarding wall. That makes it a strong pick for early discussions, quick sketches, and lightweight visual thinking where cleanliness and speed matter more than a deep shape library. It also doubles as a developer SDK for teams building their own canvas experiences.
Best for: teams that want an instant, uncluttered whiteboard, or developers building an infinite-canvas product.
Key strengths
- Real-time collaboration: co-edit the canvas live with your team.
- Freehand drawing and rich text: sketch, annotate, and add formatted text on one surface.
- Shapes, arrows, and media: add embeds, images, and media alongside diagram elements.
Why choose tldraw: it beats heavier tools when you want zero setup and a clean canvas for rough visual thinking. For PMs running quick alignment sessions or capturing an idea mid-meeting, the speed is the draw. For formal, versioned documentation you will want a more structured option, but for fast ideation tldraw is refreshingly direct.
tldraw pricing: the whiteboard is free to use. Its SDK licensing includes a 100-day free trial, a commercial license with value-based pricing for production use, startup pricing for early-stage companies, and a free hobby license for non-commercial projects. A current G2 rating for tldraw was not available at the time of writing.
7. Gliffy

Gliffy is diagramming software for Confluence, Jira, and standalone online use. Its strongest argument is proximity: if your team already documents everything in Confluence, Gliffy puts diagram creation right inside the page. No context-switching, no exporting images, no broken links when a diagram changes. For PMs and engineering teams living in Atlassian, that native fit lowers the barrier to keeping process documentation current.
Best for: teams needing Confluence-native technical diagramming with a familiar adoption path.
Key strengths
- Drag-and-drop diagramming: build flowcharts and process maps quickly with a straightforward editor.
- Mermaid diagram creation: generate diagrams from Mermaid syntax for code-friendly workflows.
- AI-generated editable diagrams: start from an AI draft and refine it directly.
Why choose Gliffy: it fits teams that want low disruption and a tool that meets them where they already work. The Atlassian-native workflow means adoption is easy because nobody has to learn a separate app. For teams outside the Atlassian ecosystem, a standalone tool may offer broader reach, but for Confluence and Jira shops Gliffy is the path of least resistance.
Gliffy pricing: Gliffy Diagrams for Confluence is free for up to 10 users, then $3.80/month per user for 11-100 users billed annually. Gliffy's Zero Egress compliance-ready option starts at $2.80/month for 1-100 users. Standalone Gliffy Online is priced separately. Gliffy holds a 4.4/5 rating on G2.
8. MermaidChart
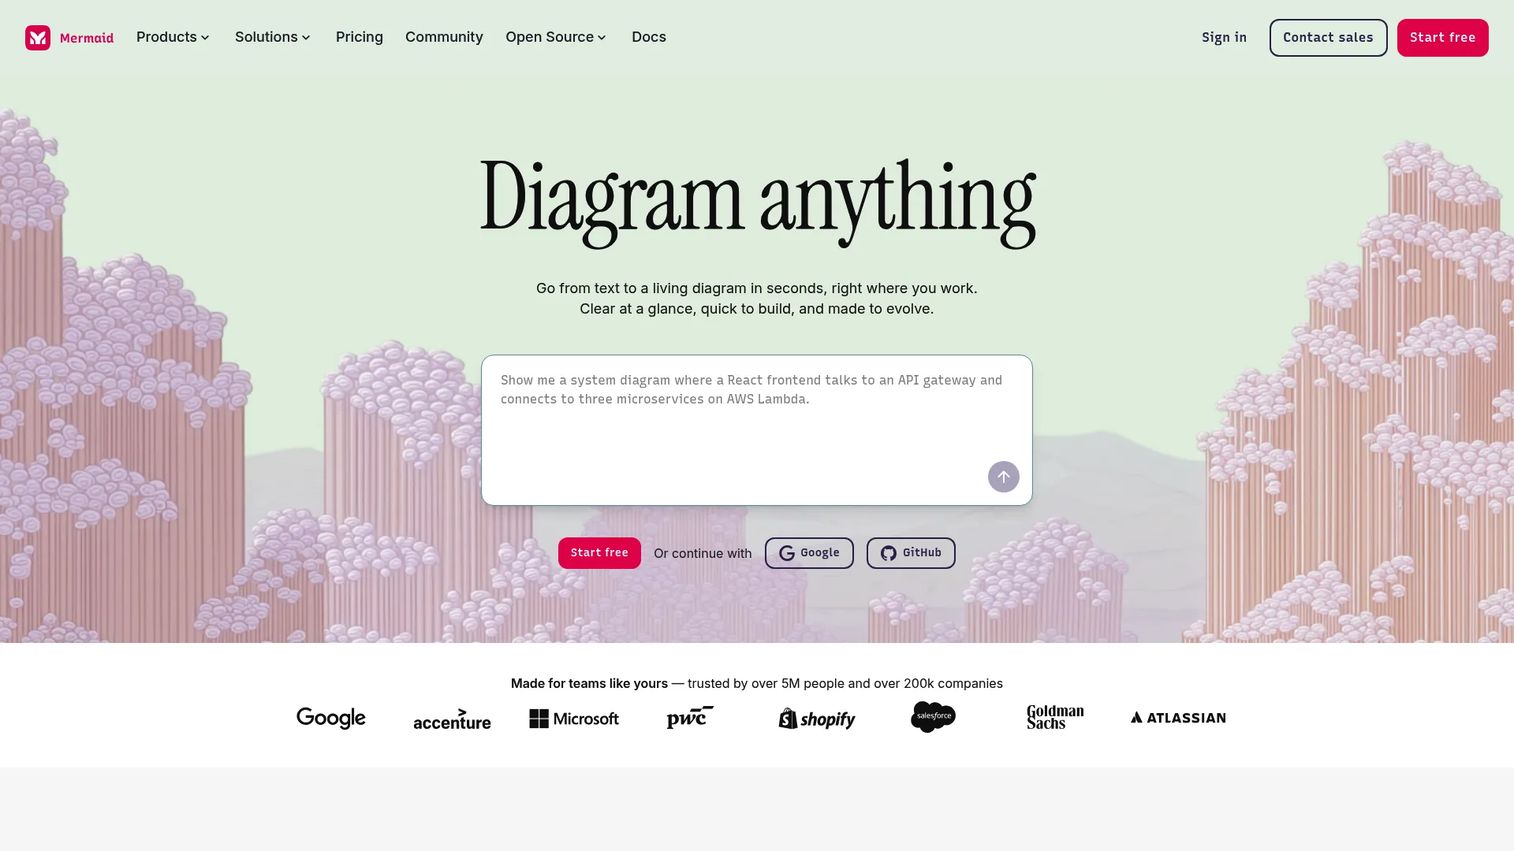
MermaidChart is web-based diagramming software for creating and editing Mermaid diagrams with AI and collaboration features. It is the clearest expression of diagram-as-code in this list: you write diagrams in text, and they render into flowcharts, sequence diagrams, and more. Because the source is text, diagrams version-control cleanly in GitHub, regenerate on demand, and never drift into stale image files. For PMs working closely with engineering or documentation-heavy teams, that portability is the whole appeal.
Best for: teams and individuals who want text-based diagramming with AI assistance and real-time collaboration.
Key strengths
- AI diagramming: generate Mermaid diagrams from prompts and refine them fast.
- Real-time collaboration: co-edit diagrams live across a team.
- Visual and code-based editing: switch between the text source and a visual editor as needed.
Why choose MermaidChart: it is the strongest fit when diagrams belong in your codebase and documentation workflows. Text-based diagrams live in version control, survive refactors, and reproduce identically every time, which solves the stale-diagram problem better than any drawing tool. If your stakeholders are non-technical and never touch a repo, a visual-first tool will feel more natural, but for developer-adjacent teams this is the durable choice.
MermaidChart pricing: the Basic plan is free. Plus is $10 per user/month and Premium is $20 per user/month, both billed annually, with custom Enterprise pricing. MermaidChart holds a 4.7/5 rating on G2.
Considerations before you choose
Feature lists blur together fast. These are the criteria that actually decide whether a tool sticks with your team.
Collaboration and real-time co-editing
If more than one person will touch a diagram, live co-editing and comments are not optional. Check whether editing requires a paid seat, how version history works, and whether stakeholders can comment without an account. A tool that forces everyone onto a paid plan to leave a note will quietly limit adoption.
Integrations with your existing stack
The best diagram is the one people find without hunting. Verify native support for Confluence, Jira, Notion, GitHub, VS Code, or whatever your team lives in. Diagrams that embed and stay linked beat diagrams exported as images that go stale the moment the source changes.
Security and privacy posture
For sensitive architecture or process data, ask where diagrams are stored and who can access them. Local or self-hosted options, clear data handling, and access controls matter more as the diagram describes real systems. This is where a privacy-first tool earns its place over a cloud-only default.
Technical depth and diagram-as-code
If your diagrams describe evolving systems, favor tools that enforce structure or support diagram-as-code. C4-aware and text-based options keep software architecture diagrams accurate across releases, which manual drawing tools struggle to guarantee over time.
Maintainability across releases
Product changes constantly, and so should the diagram. Choose a tool that makes updates fast and low-friction, because a diagram that is painful to edit is a diagram that rots. Ease of maintenance, not initial drawing speed, is what determines whether the tool survives a year.
Conclusion
There is no single best diagramming software, only the best fit for how your team works. If you want broad utility with a strong privacy posture and no cost barrier, draw.io is the pragmatic default. For all-purpose, AI-assisted diagramming across process and org work, Lucidchart earns its place. Architecture teams that need diagrams to stay accurate should reach for IcePanel and the C4 model, while code-first teams get durable, version-controlled diagrams from MermaidChart. When the diagram is really a collaboration surface for a workshop or planning session, Miro leads, with Excalidraw and tldraw covering fast, lightweight sketching and Gliffy serving Atlassian-native teams.
The practical move: pick based on workflow compatibility, not feature count. Shortlist two tools from this list, run a real diagram through each with the people who will actually use them, and see which one stays current after a month. The tool that gets updated is the tool that works.
FAQs
For most PMs, the best choice prioritizes collaboration, editability, integrations, and exportability over advanced modeling features. Lucidchart and Miro suit cross-functional planning and process work, while draw.io is a strong, free default that lives inside Confluence and Jira. Choose based on where your team already documents work, since a diagram nobody can find never gets used.
draw.io is the strongest fully free option, with no server-side storage on its online editor and broad export support. Excalidraw and tldraw are excellent free choices for fast, sketch-style diagramming. Miro, Lucidchart, IcePanel, Gliffy, and MermaidChart all offer free tiers, though advanced collaboration, governance, and integrations typically live in paid plans.
IcePanel is purpose-built for software architecture diagrams using the C4 model, keeping systems, containers, and components consistent as the codebase evolves. MermaidChart suits teams that prefer diagram-as-code, with text-based diagrams that version-control cleanly. For lighter architecture sketches, draw.io and Lucidchart both handle UML and dependency maps well.
Yes, for anything that changes. Dedicated diagramming tools are easier to update, comment on, and version than a static slide. A process map in slides goes stale the moment the process shifts, and correcting it means redrawing shapes by hand. Diagramming software keeps the map editable, shareable, and linked to where your team reads it.
Prioritize real-time co-editing, integrations with your docs and project tools, security and privacy controls, template depth, export formats, and technical workflow fit. For teams shipping frequently, maintainability matters most: the tool has to make updates fast, or diagrams rot as the product changes. Test against a real diagram before committing.
For live, in-room brainstorming, physical whiteboards still have a place, but tools like Miro and tldraw come close by combining an infinite canvas with real-time collaboration and persistence. Where digital tools clearly win is documentation: a whiteboard photo is unsearchable and uneditable, while a digital canvas stays live, linkable, and updatable long after the session ends.
Gliffy and draw.io both offer deep Atlassian integration, letting you create and edit diagrams directly inside Confluence and Jira. That native fit matters because it removes context-switching and keeps diagrams linked to the pages that reference them, so they update in place instead of breaking as stale exported images. For Atlassian-heavy teams, either is a low-friction choice.