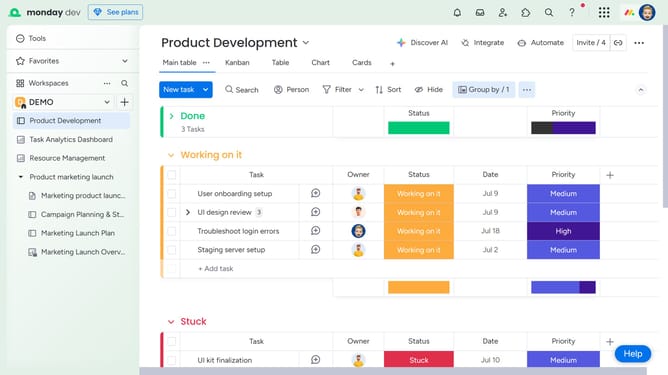
How to filter a Chart Widget in Monday.com
Here is how to filter a chart widget in monday.com
- First, open the dashboard containing the Chart Widget
- Next locate the Chart Widget you want to filter
- Click the more options menu (three dots) in the top-right corner of the widget
- Select "Settings" from the dropdown menu
- Then click on the "Filter" button in the expanded widget view
- Next click on the "Boards" dropdown in the filter settings
- Then select the board you want to filter by from the dropdown menu
- Finally, start adding a filter by choosing a column, setting the condition, and selecting the value
- Once you're done, you can lick “New filter” to apply additional filtering conditions, if needed
- The chart will update automatically to display data that meets your filter criteria
Why should you filter a Chart Widget in Monday.com
Monday.com is a versatile work operating system designed to streamline project management and team collaboration.
Filtering a Chart Widget in Monday.com refines data presentation, allowing users to focus on relevant information. By choosing specific criteria, teams can tailor their visual insights, enhancing clarity and decision-making.
This feature empowers users to make informed decisions quickly, as it eliminates unnecessary data noise. Embracing this capability ensures more precise tracking of project progress and performance metrics.
Last update