How to bold the font of a table chart title in Looker Studio
Here is how to bold the font of a table chart title in looker studio
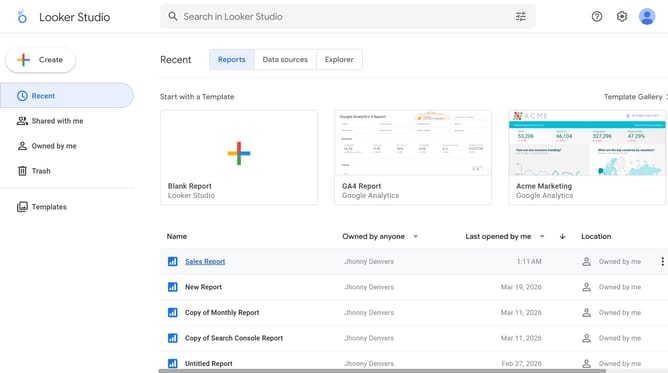
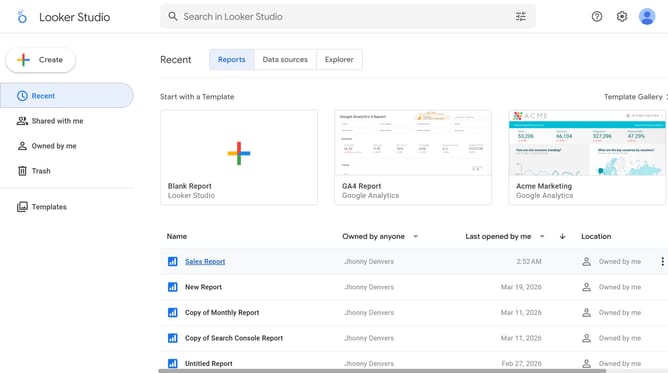
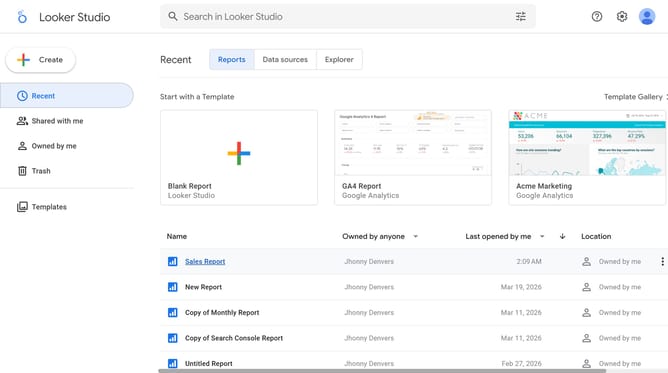
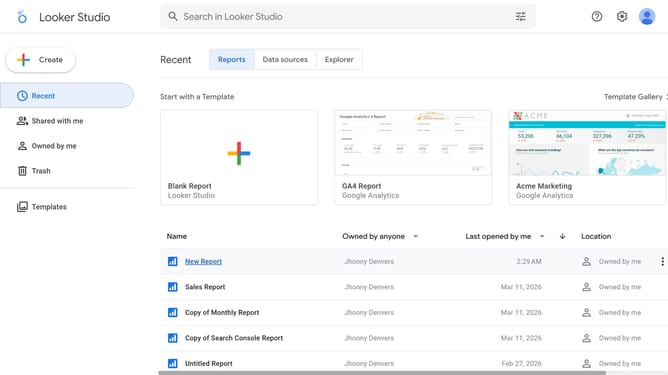
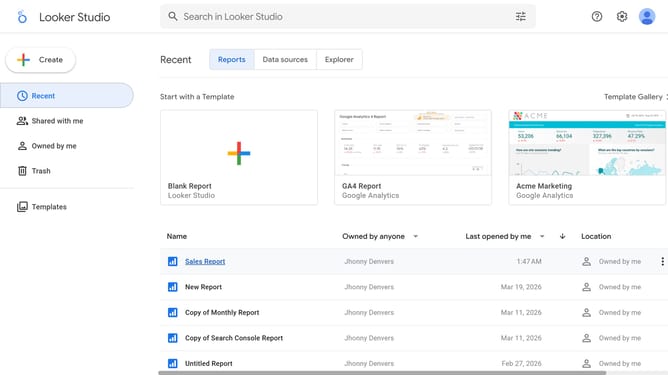
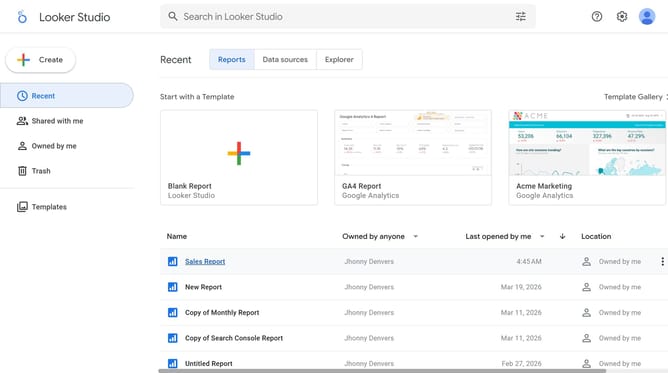
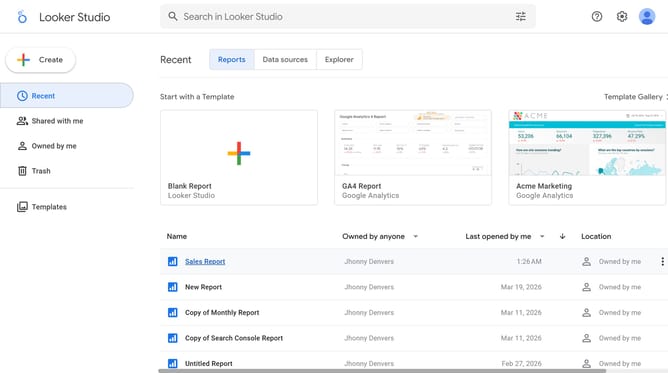
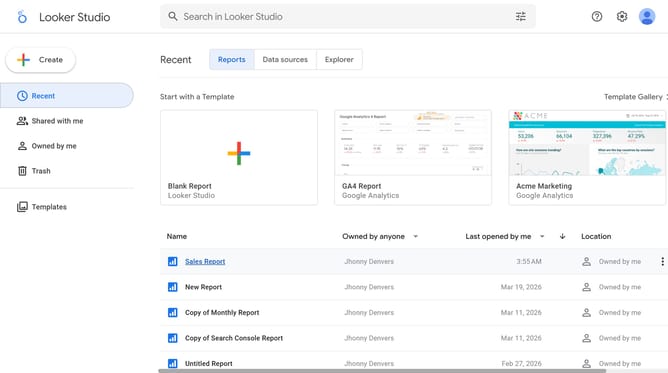
- First click on the file name from the reports list to open it
- Then click on "Edit" button in the top toolbar
- Next click on "Manage pages" option in the page navigation toolbar
- Next click on the page name that you want to manage in the right sidebar
- Next click on the "Show properties" button above the table chart
- Finally click on "Bold" button in the Table properties sidebar panel
Why should you bold the font of a table chart title in Looker Studio
Looker Studio is a powerful tool designed to visualize and analyze data efficiently, transforming complex information into clear insights.
One of its standout features is the ability to customize table chart titles, such as bolding the font. This feature enhances readability, making critical data points stand out at a glance.
Using the bold font for table chart titles not only adds emphasis to your data displays but also contributes to a more professional and polished presentation. This small adjustment can greatly improve the overall impact of your data stories in Looker Studio.
Last update